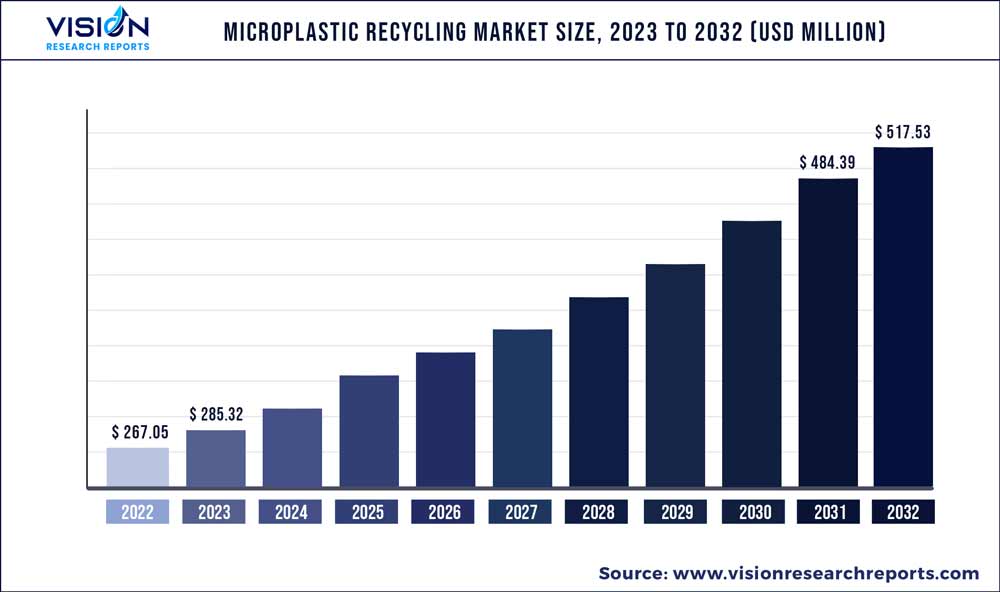
The global microplastic recycling market size was estimated at around USD 267.05 million in 2022 and it is projected to hit around USD 517.53 million by 2032, growing at a CAGR of 6.84% from 2023 to 2032. The microplastic recycling market in the United States was accounted for USD 61.4 million in 2022.

Key Pointers
Report Scope of the Microplastic Recycling Market
| Report Coverage | Details |
| Revenue Share of Europe in 2022 | 45% |
| Revenue Forecast by 2032 | USD 517.53 billion |
| Growth Rate from 2023 to 2032 | CAGR of 6.84% |
| Base Year | 2022 |
| Forecast Period | 2023 to 2032 |
| Market Analysis (Terms Used) | Value (US$ Million/Billion) or (Volume/Units) |
| Companies Covered | Carbios; Purecycle technologies; Ioniqa; Calyxia; Polygonesystems; PlanetCare; ECOFARIO; Ocean Diagnostics; Oceanworks; Matter. |
The market is expected to grow in the coming years owing to increasing government regulations, environmental concerns, technological advancements, consumer awareness, and the increasing use of microplastics in different industries. Significant research and development in the U.S. regarding microplastic recycling is expected to be a major market driver in the country. Manufacturers are engaged in developing new technologies and processes for the efficient and cost-effective recycling of microplastics. Manufacturers in the country have set sustainability goals which have increased demand for recycled plastics including microplastics.
Different governments across the globe are implementing regulations to reduce plastic waste, which in turn is expected to drive the demand for microplastic recycling. In addition, increasing consumer awareness regarding the environmental impact of their actions and are seeking out sustainable products and services. This has led to an increase in demand for products made from recycled materials, including microplastics.
Microplastic recycling generates revenue for businesses and reduces production costs in the recycling industry. Recycling microplastics reduces the amount of plastic waste that ends up in landfills or oceans, thereby minimizing the impact on the environment. Furthermore, increasing demand from end-use industries including automotive & transportation, packaging, consumer goods, textile, and others is creating lucrative opportunities for microplastic recycling.
Product Insights
Secondary product segment led the market and accounted for more than 77% share of the global revenue share in 2022. Secondary microplastic recycling refers to the process of recovering microplastics that have already been used and discarded, such as plastic bottles, packaging, and other waste. Secondary microplastic recycling can help minimize the amount of plastic waste that ends up in landfills, oceans, and other natural environments. In addition, secondary microplastic recycling can be cost-effective, as recycled materials are less expensive than virgin materials.
Microbeads are easily available from the personal care industry, which is a significant feedstock for the microplastic recycling market. Owing to technological advancements in recycling it possible to recover microbeads from waste streams and transform those into high-quality recycled materials. Also, the use of recycled microbeads can provide manufacturers with a competitive edge in meeting consumer demand for sustainable products.
End-Use Insights
Packaging end-use segment led the market and accounted for more than 63% share of the global revenue share in 2022. The packaging industry is shifting towards sustainable and eco-friendly packaging solutions owing to government regulations and growing consumer awareness. The use of recycled plastics, including microplastics, is seen as an effective way to reduce the environmental impact of packaging.
Similar to the packaging industry, there is a growing demand for sustainable textiles that are made from recycled materials. Recycled microplastics can be used to produce a range of textiles, including clothing, carpeting, and upholstery.
Owing to environmental concerns automotive manufacturers are focusing on reducing the weight of vehicles which will help reduce emissions and improve fuel efficiency as well. The use of recycled microplastics in lightweight materials can help achieve these goals while also promoting sustainability. Recycled microplastics can be used in the production of different interior components including seating, door panels, and dashboard panels.
Regional Insights
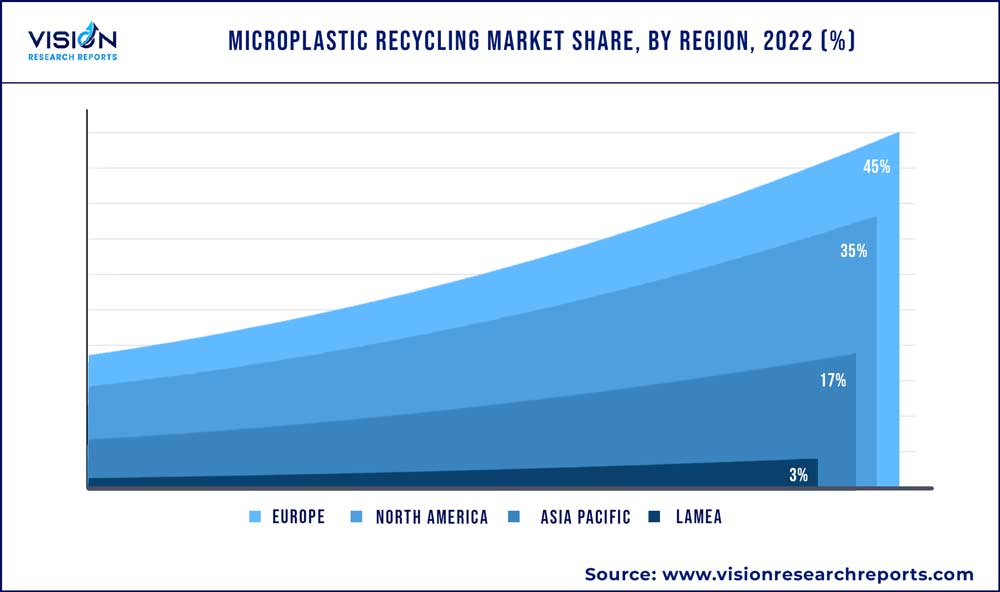
Europe dominated the market and accounted for more than 45% share of global revenue in 2022. The European Union has implemented strict regulations on the use of single-use plastics and waste management. The EU Circular Economy Package aims to promote the transition to a more sustainable and resource-efficient economy, and microplastic recycling is an important part of this. The European Union has set a target of recycling approximately 55% of plastic packaging waste by 2030, and microplastic recycling is seen as an important part of achieving this goal.

Different manufacturers in Europe are promoting microplastic recycling. For instance, Ioniqa the Dutch company is using a chemical recycling process to turn PET waste into high-quality raw materials, including microplastics.
Microplastics have become a major environmental issue in North America, owing to the growing public concerns and awareness about their impact on wildlife and human health. In North America, various government regulations are aimed at reducing plastic waste and promoting recycling. For instance, taking effect in January 2022, California passed a law requiring manufacturers to use a minimum amount of recycled plastic in their products. The plastic beverage containers must contain at least 15% recycled content.
Microplastic Recycling Market Segmentations:
By Product
By End-use
By Regional
Chapter 1. Introduction
1.1. Research Objective
1.2. Scope of the Study
1.3. Definition
Chapter 2. Research Methodology
2.1. Research Approach
2.2. Data Sources
2.3. Assumptions & Limitations
Chapter 3. Executive Summary
3.1. Market Snapshot
Chapter 4. Market Variables and Scope
4.1. Introduction
4.2. Market Classification and Scope
4.3. Industry Value Chain Analysis
4.3.1. Raw Material Procurement Analysis
4.3.2. Sales and Distribution Channel Analysis
4.3.3. Downstream Buyer Analysis
Chapter 5. COVID 19 Impact on Microplastic Recycling Market
5.1. COVID-19 Landscape: Microplastic Recycling Industry Impact
5.2. COVID 19 - Impact Assessment for the Industry
5.3. COVID 19 Impact: Global Major Government Policy
5.4. Market Trends and Opportunities in the COVID-19 Landscape
Chapter 6. Market Dynamics Analysis and Trends
6.1. Market Dynamics
6.1.1. Market Drivers
6.1.2. Market Restraints
6.1.3. Market Opportunities
6.2. Porter’s Five Forces Analysis
6.2.1. Bargaining power of suppliers
6.2.2. Bargaining power of buyers
6.2.3. Threat of substitute
6.2.4. Threat of new entrants
6.2.5. Degree of competition
Chapter 7. Competitive Landscape
7.1.1. Company Market Share/Positioning Analysis
7.1.2. Key Strategies Adopted by Players
7.1.3. Vendor Landscape
7.1.3.1. List of Suppliers
7.1.3.2. List of Buyers
Chapter 8. Global Microplastic Recycling Market, By Product
8.1. Microplastic Recycling Market, by Product, 2023-2032
8.1.1. Primary
8.1.1.1. Market Revenue and Forecast (2020-2032)
8.1.2. Secondary
8.1.2.1. Market Revenue and Forecast (2020-2032)
Chapter 9. Global Microplastic Recycling Market, By End-use
9.1. Microplastic Recycling Market, by End-use, 2023-2032
9.1.1. Packaging
9.1.1.1. Market Revenue and Forecast (2020-2032)
9.1.2. Agriculture
9.1.2.1. Market Revenue and Forecast (2020-2032)
9.1.3. Consumer goods
9.1.3.1. Market Revenue and Forecast (2020-2032)
9.1.4. Textile
9.1.4.1. Market Revenue and Forecast (2020-2032)
9.1.5. Automotive & Transportation
9.1.5.1. Market Revenue and Forecast (2020-2032)
9.1.6. Building & Construction
9.1.6.1. Market Revenue and Forecast (2020-2032)
9.1.7. Others
9.1.7.1. Market Revenue and Forecast (2020-2032)
Chapter 10. Global Microplastic Recycling Market, Regional Estimates and Trend Forecast
10.1. North America
10.1.1. Market Revenue and Forecast, by Product (2020-2032)
10.1.2. Market Revenue and Forecast, by End-use (2020-2032)
10.1.3. U.S.
10.1.3.1. Market Revenue and Forecast, by Product (2020-2032)
10.1.3.2. Market Revenue and Forecast, by End-use (2020-2032)
10.1.4. Rest of North America
10.1.4.1. Market Revenue and Forecast, by Product (2020-2032)
10.1.4.2. Market Revenue and Forecast, by End-use (2020-2032)
10.2. Europe
10.2.1. Market Revenue and Forecast, by Product (2020-2032)
10.2.2. Market Revenue and Forecast, by End-use (2020-2032)
10.2.3. UK
10.2.3.1. Market Revenue and Forecast, by Product (2020-2032)
10.2.3.2. Market Revenue and Forecast, by End-use (2020-2032)
10.2.4. Germany
10.2.4.1. Market Revenue and Forecast, by Product (2020-2032)
10.2.4.2. Market Revenue and Forecast, by End-use (2020-2032)
10.2.5. France
10.2.5.1. Market Revenue and Forecast, by Product (2020-2032)
10.2.5.2. Market Revenue and Forecast, by End-use (2020-2032)
10.2.6. Rest of Europe
10.2.6.1. Market Revenue and Forecast, by Product (2020-2032)
10.2.6.2. Market Revenue and Forecast, by End-use (2020-2032)
10.3. APAC
10.3.1. Market Revenue and Forecast, by Product (2020-2032)
10.3.2. Market Revenue and Forecast, by End-use (2020-2032)
10.3.3. India
10.3.3.1. Market Revenue and Forecast, by Product (2020-2032)
10.3.3.2. Market Revenue and Forecast, by End-use (2020-2032)
10.3.4. China
10.3.4.1. Market Revenue and Forecast, by Product (2020-2032)
10.3.4.2. Market Revenue and Forecast, by End-use (2020-2032)
10.3.5. Japan
10.3.5.1. Market Revenue and Forecast, by Product (2020-2032)
10.3.5.2. Market Revenue and Forecast, by End-use (2020-2032)
10.3.6. Rest of APAC
10.3.6.1. Market Revenue and Forecast, by Product (2020-2032)
10.3.6.2. Market Revenue and Forecast, by End-use (2020-2032)
10.4. MEA
10.4.1. Market Revenue and Forecast, by Product (2020-2032)
10.4.2. Market Revenue and Forecast, by End-use (2020-2032)
10.4.3. GCC
10.4.3.1. Market Revenue and Forecast, by Product (2020-2032)
10.4.3.2. Market Revenue and Forecast, by End-use (2020-2032)
10.4.4. North Africa
10.4.4.1. Market Revenue and Forecast, by Product (2020-2032)
10.4.4.2. Market Revenue and Forecast, by End-use (2020-2032)
10.4.5. South Africa
10.4.5.1. Market Revenue and Forecast, by Product (2020-2032)
10.4.5.2. Market Revenue and Forecast, by End-use (2020-2032)
10.4.6. Rest of MEA
10.4.6.1. Market Revenue and Forecast, by Product (2020-2032)
10.4.6.2. Market Revenue and Forecast, by End-use (2020-2032)
10.5. Latin America
10.5.1. Market Revenue and Forecast, by Product (2020-2032)
10.5.2. Market Revenue and Forecast, by End-use (2020-2032)
10.5.3. Brazil
10.5.3.1. Market Revenue and Forecast, by Product (2020-2032)
10.5.3.2. Market Revenue and Forecast, by End-use (2020-2032)
10.5.4. Rest of LATAM
10.5.4.1. Market Revenue and Forecast, by Product (2020-2032)
10.5.4.2. Market Revenue and Forecast, by End-use (2020-2032)
Chapter 11. Company Profiles
11.1. Carbios
11.1.1. Company Overview
11.1.2. Product Offerings
11.1.3. Financial Performance
11.1.4. Recent Initiatives
11.2. Purecycle technologies
11.2.1. Company Overview
11.2.2. Product Offerings
11.2.3. Financial Performance
11.2.4. Recent Initiatives
11.3. Ioniqa
11.3.1. Company Overview
11.3.2. Product Offerings
11.3.3. Financial Performance
11.3.4. Recent Initiatives
11.4. Calyxia
11.4.1. Company Overview
11.4.2. Product Offerings
11.4.3. Financial Performance
11.4.4. LTE Scientific
11.5. Polygonesystems
11.5.1. Company Overview
11.5.2. Product Offerings
11.5.3. Financial Performance
11.5.4. Recent Initiatives
11.6. PlanetCare
11.6.1. Company Overview
11.6.2. Product Offerings
11.6.3. Financial Performance
11.6.4. Recent Initiatives
11.7. ECOFARIO
11.7.1. Company Overview
11.7.2. Product Offerings
11.7.3. Financial Performance
11.7.4. Recent Initiatives
11.8. Ocean Diagnostics
11.8.1. Company Overview
11.8.2. Product Offerings
11.8.3. Financial Performance
11.8.4. Recent Initiatives
11.9. Oceanworks
11.9.1. Company Overview
11.9.2. Product Offerings
11.9.3. Financial Performance
11.9.4. Recent Initiatives
11.10. Matter.
11.10.1. Company Overview
11.10.2. Product Offerings
11.10.3. Financial Performance
11.10.4. Recent Initiatives
Chapter 12. Research Methodology
12.1. Primary Research
12.2. Secondary Research
12.3. Assumptions
Chapter 13. Appendix
13.1. About Us
13.2. Glossary of Terms
 Cross-segment Market Size and Analysis for
Mentioned Segments
 Additional Company Profiles (Upto 5 With No Cost)
 Additional Countries (Apart From Mentioned Countries)
 Country/Region-specific Report
 Go To Market Strategy
 Region Specific Market Dynamics
 Region Level Market Share
 Import Export Analysis
 Production Analysis
 Others