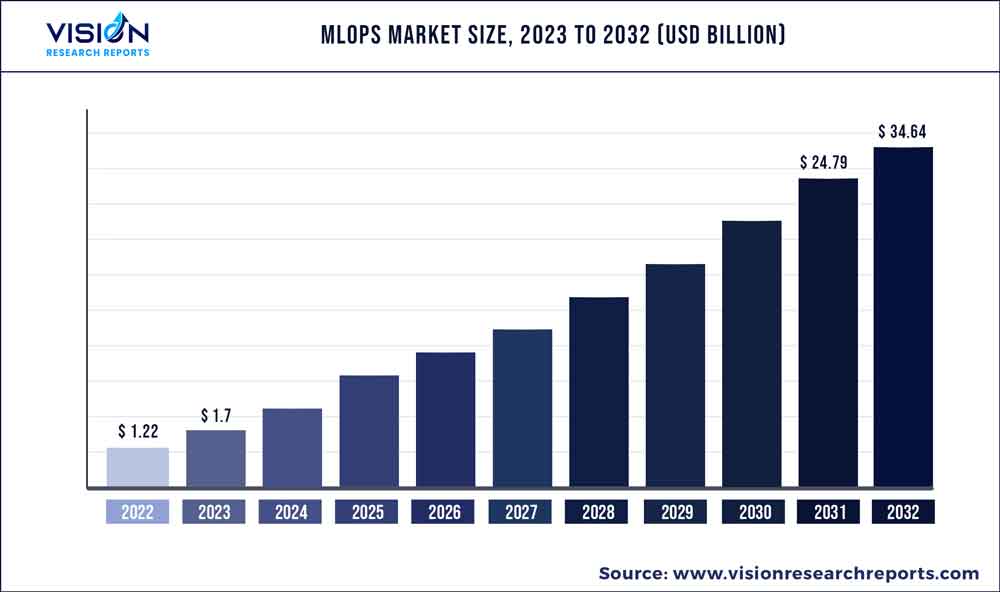
The global MLOps market size was estimated at around USD 1.22 billion in 2022 and it is projected to hit around USD 34.64 billion by 2032, growing at a CAGR of 39.74% from 2023 to 2032. The MLOps market in the United States was accounted for USD 236.3 million in 2022.

Key Pointers
Report Scope of the MLOps Market
| Report Coverage | Details |
| Revenue Share of North America in 2022 | 42% |
| Revenue Forecast by 2032 | USD 34.64 billion |
| Growth Rate from 2023 to 2032 | CAGR of 39.74% |
| Base Year | 2022 |
| Forecast Period | 2023 to 2032 |
| Market Analysis (Terms Used) | Value (US$ Million/Billion) or (Volume/Units) |
| Companies Covered | IBM Corp.; Microsoft; Google LLC; Amazon Web Services, Inc.; Hewlett Packard Enterprise Development LP; Neptune Labs, Inc.; DataRobot, Inc.; Dataiku.; ALTERYX, Inc.; GAVS Technologies N.A., Inc. |
The market has seen significant growth in the past few years and is expected to demonstrate further substantial growth due to the outbreak of the COVID-19 pandemic. This high growth is attributed to the surge in demand for ML/AI-based projects among businesses to meet customers’ needs and upsurge their revenue opportunities. Machine Learning Operations (MLOps) assist in the transition from running a pair of Machine Learning (ML) models manually to using them in the entire business operation. Overall, it helps reduce defects, improve delivery time, and make data science more effective.
Thus, providing lucrative prospects for market growth. MLOps is also the missing bridge between data engineering, ML, and data science. It has emerged as the link that unifies these operations more seamlessly. MLOps assist advanced systems and professionals to consistently deploy machine learning solutions and algorithms for enhanced productivity and significance. The technology is based on a blend of an operating framework for technology and people and an adherence to the most acceptable practices and proven architectural principles.The surge in digital and internet penetration worldwide positively impacts the market's growth. Furthermore, the healthcare industry increasingly uses AI and ML to improve patient outcomes and streamline processes.
AI-powered tools are used for image analysis, predictive modeling, and personalized treatment recommendations. MLOps solutions also help healthcare organizations build and deploy these tools at scale while ensuring compliance with data privacy regulations. Such increasing usage in the healthcare sector is expected to provide lucrative growth opportunities for the market during the forecast period. An increase in the adoption of MLOps technology across industries to enhance productivity & operation also strengthens the market's growth for the future. Moreover, MLOps help lower costs over the entire ML lifecycle and produce numerous possibilities for market growth.
Component Insights
The platform segment led the market in 2022, accounting for over 77% share of the global revenue owing to its feature of optimizing the management and operation of ML models. It helps organizations build, manage, train, and deploy models in a machine learning environment. It accelerates business experiments with purpose-built tools, including data preparation, classification, monitoring, training & tuning, and other activities. For instance, in October 2022, Weights & Biases, a provider of a developer-first MLOps platform, revealed significant enhancements to its developer-first MLOps platform. The latest enhancements will boost ML activities for practitioners and enterprises, delivering an end-to-end, seamless MLOps experience. The service segment is estimated to grow significantly over the forecast period.
Services in the MLOps market study include MLOps development, consulting, monitoring services, and license & maintenance services. MLOps services help organizations drive growth by enabling them to develop, deploy, and manage machine learning models efficiently. By leveraging these services, organizations can accelerate time-to-market, improve model accuracy, enhance operational efficiency, expand use cases, and facilitate collaboration. For instance, in December 2021, NxtGen Datacenter & Cloud Technologies Pvt. Ltd., a data center and cloud services provider, in partnership with Katonic Pty. Ltd., an AI startup, launched MLOps as a Service offering to strengthen, simplify, and accelerate mainstream adoption of AI by digital native startups, enterprises, educational institutions, research institutes, and government entities.
Deployment Insights
The on-premises segment held the largest revenue share of over 59% in 2022. This is attributed to the numerous benefits offered by the on-premises deployment, such as high data safety and security. Enterprises prefer the On-premise model, as keeping data and models within a company's data center ensures they are secure and protected from external threats. In addition, with on-premise infrastructure, enterprises have greater control over their machinelearning pipeline, which can improve efficiency and reduce costs. For instance, in June 2022, Domino Data Lab, Inc. announced the launch of its nexus hybrid enterprise MLOps architecture. The architecture will let enterprises rapidly control, scale, and stage data science work across various compute clusters, on-premises, in different regions, and across clouds.
The cloud segment is predicted to foresee significant growth in the forecast period. Disaster management via cloud-based backup systems, automatic software upgrades, enhanced efficiency, and flexibility are key benefits of increasing the implementation of cloud-based delivery models for deep-learning software services and solutions. By leveraging cloud infrastructure, organizations can avoid the upfront costs of building and maintaining their data centers. It provides the flexibility to experiment with different machinelearning models and algorithms without investing in expensive hardware or software.
Vertical Insights
The BFSI segment held the largest revenue share of over 20% in 2022. The adoption of machine learning by the financial sector has been on the rise, primarily for solving specific challenges, such as yield management, predictive maintenance of legacy systems, and fraud detection. Financial institutions can automate integrating ML/AI models into applications using MLOps without a flaw at digital channels or touchpoints where clients interact with banks to enhance their overall experiences. Furthermore, it allows financial institutions to train the models with their statistics and information. As a result, they are no longer required to outsource their stored figures and facts to third-party sellers, who cannot frequently deliver enterprise-grade data on a big scale.
The government segment is predicted to foresee significant growth in the forecast period. Furthermore, the healthcare & life sciences segment held a significant global revenue share in 2022. The deployment of AI tools and processes in the healthcare industry for faster and better outcomes, especially for disease diagnosis, is boosting the demand and growth of the operationalization of machine learning. This technology in healthcare can be employed for better diagnosis using various tools and software to analyze images and medical reports. For instance, a machine learning algorithm can predict a disease based on training in similar cases and achieve better pattern recognition. This field of automation can improve healthcare services' overall cost efficiency by using technology instead of manual processes.
Organization Size Insights
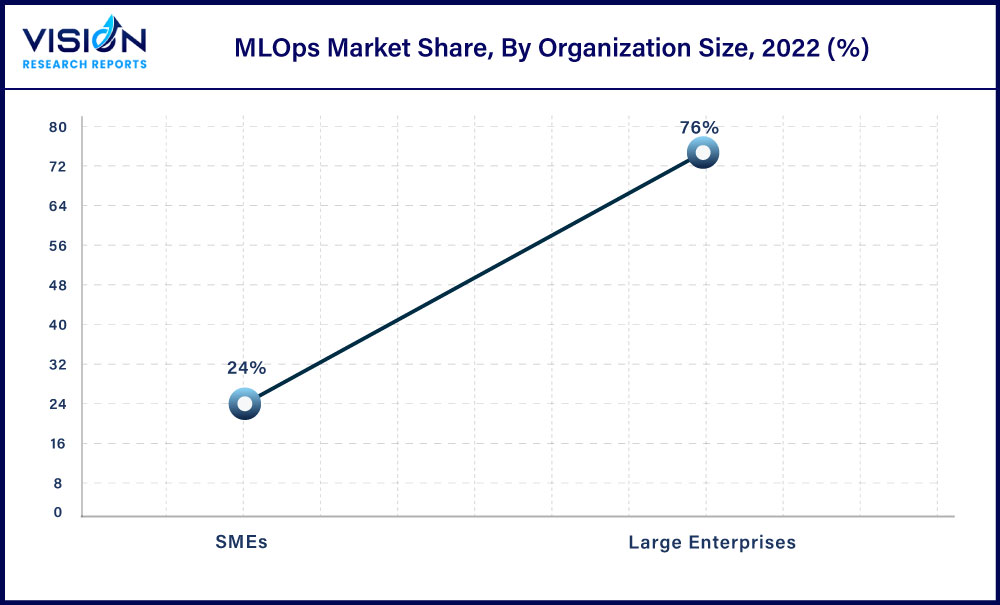
The large enterprises segment led the market in 2022, accounting for over 76% share of the global revenue owing to the growing implementation of Al technology and data science across large enterprises to present quantitative insights into their operations. Large enterprises can benefit from MLOps by improving the scalability and reliability of their machine learning models, reducing the time and resources required to deploy and manage these models, and enabling faster decision-making and innovation. Furthermore, MLOps can help large enterprises scale their ML models by automating tasks like model training, testing, and deployment. This can help organizations handle large volumes of data and rapidly changing business requirements.

The SMEs segment is estimated to grow significantly over the forecast period. SMEs are increasingly recognizing the value of adopting MLOps to drive growth and gain a competitive edge in their respective industries. The adoption of MLOps can further enhance the growth potential of SMEs as it enables them to leverage the power of machine learning to gain insights into customer behavior, optimize marketing campaigns, improve product development, and enhance operational efficiency. With the help of MLOps, SMEs can access powerful predictive models that can drive growth and help them stay competitive in the marketplace. For instance, in June 2022, OmniML, a startup AI company, announced the launch of Omnimizer. The new platform simplifies and boosts MLOps by bridging the gap between edge hardware and ML models.
Regional Insights
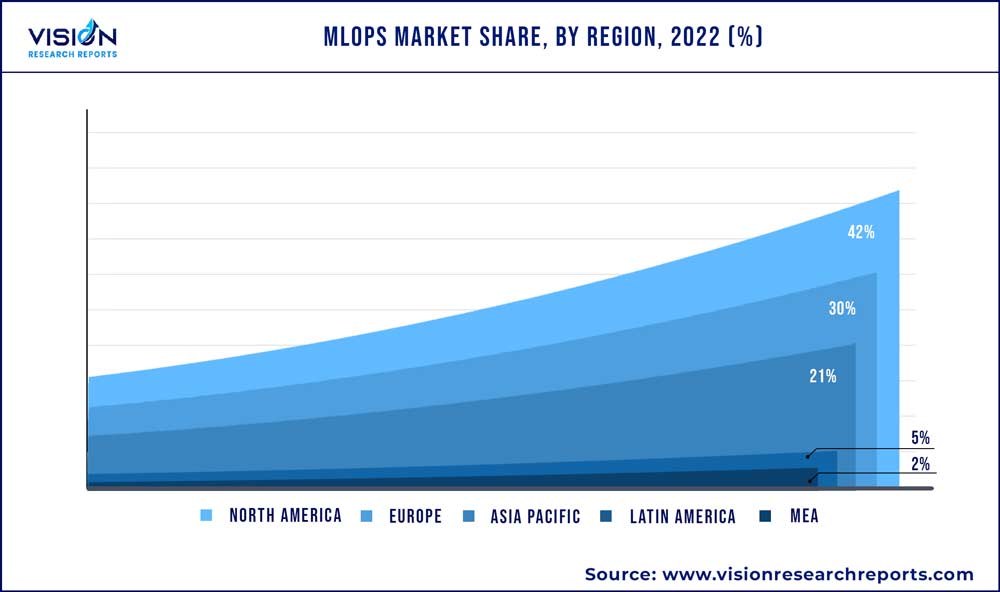
North America dominated the market in 2022, accounting for over 42% share of the global revenue owing to Al's intense research and development competencies in the developed economies, research institutes, and various leading Al companies based in this region. The increasing investment in advanced technologies to enhance customer experience and business operations is anticipated to provide lucrative growth opportunities in North America. Furthermore, the region has had strong R&D capabilities in Al and invested heavily in Al-related technologies over the past few years. Also, they have enforced policies to support the development of the field. For instance, in December 2022, Allegro AI, an open-source company, stated that it had reached a landmark year of growth, setting new milestones in user base, revenue, and collaborations.

The company also announced opening its first office in the U.S. to meet the high demand for its platform. Asia Pacific is anticipated to register the fastest CAGR over the forecast period. The region has a rapidly growing cloud computing market, with major players, such as Amazon Web Services, Inc., Microsoft, and Google, expanding their presence there. Cloud-based MLOps solutions are expected to see significant adoption in the region as organizations leverage cloud infrastructure's scalability and flexibility. Furthermore, governments and businesses across the APAC region are investing heavily in AI and machine learning. This investment drives demand for MLOps solutions that can help organizations develop and deploy machine learning models at a scale.
MLOps Market Segmentations:
By Component
By Deployment
By Organization Size
By Vertical
By Regional
Chapter 1. Introduction
1.1. Research Objective
1.2. Scope of the Study
1.3. Definition
Chapter 2. Research Methodology
2.1. Research Approach
2.2. Data Sources
2.3. Assumptions & Limitations
Chapter 3. Executive Summary
3.1. Market Snapshot
Chapter 4. Market Variables and Scope
4.1. Introduction
4.2. Market Classification and Scope
4.3. Industry Value Chain Analysis
4.3.1. Raw Material Procurement Analysis
4.3.2. Sales and Distribution Channel Analysis
4.3.3. Downstream Buyer Analysis
Chapter 5. COVID 19 Impact on MLOps Market
5.1. COVID-19 Landscape: MLOps Industry Impact
5.2. COVID 19 - Impact Assessment for the Industry
5.3. COVID 19 Impact: Global Major Government Policy
5.4. Market Trends and Opportunities in the COVID-19 Landscape
Chapter 6. Market Dynamics Analysis and Trends
6.1. Market Dynamics
6.1.1. Market Drivers
6.1.2. Market Restraints
6.1.3. Market Opportunities
6.2. Porter’s Five Forces Analysis
6.2.1. Bargaining power of suppliers
6.2.2. Bargaining power of buyers
6.2.3. Threat of substitute
6.2.4. Threat of new entrants
6.2.5. Degree of competition
Chapter 7. Competitive Landscape
7.1.1. Company Market Share/Positioning Analysis
7.1.2. Key Strategies Adopted by Players
7.1.3. Vendor Landscape
7.1.3.1. List of Suppliers
7.1.3.2. List of Buyers
Chapter 8. Global MLOps Market, By Component
8.1. MLOps Market, by Component, 2023-2032
8.1.1. Platform
8.1.1.1. Market Revenue and Forecast (2020-2032)
8.1.2. Service
8.1.2.1. Market Revenue and Forecast (2020-2032)
Chapter 9. Global MLOps Market, By Deployment
9.1. MLOps Market, by Deployment, 2023-2032
9.1.1. Cloud
9.1.1.1. Market Revenue and Forecast (2020-2032)
9.1.2. On-premises
9.1.2.1. Market Revenue and Forecast (2020-2032)
Chapter 10. Global MLOps Market, By Organization Size
10.1. MLOps Market, by Organization Size, 2023-2032
10.1.1. SMEs
10.1.1.1. Market Revenue and Forecast (2020-2032)
10.1.2. Large Enterprises
10.1.2.1. Market Revenue and Forecast (2020-2032)
Chapter 11. Global MLOps Market, By Vertical
11.1. MLOps Market, by Vertical, 2023-2032
11.1.1. BFSI
11.1.1.1. Market Revenue and Forecast (2020-2032)
11.1.2. Healthcare & Life Sciences
11.1.2.1. Market Revenue and Forecast (2020-2032)
11.1.3. Retail & E-Commerce
11.1.3.1. Market Revenue and Forecast (2020-2032)
11.1.4. IT & Telecom
11.1.4.1. Market Revenue and Forecast (2020-2032)
11.1.5. Energy & Utilities
11.1.5.1. Market Revenue and Forecast (2020-2032)
11.1.6. Government & Public Sector
11.1.6.1. Market Revenue and Forecast (2020-2032)
11.1.7. Media & Entertainment
11.1.7.1. Market Revenue and Forecast (2020-2032)
11.1.8. Others
11.1.8.1. Market Revenue and Forecast (2020-2032)
Chapter 12. Global MLOps Market, Regional Estimates and Trend Forecast
12.1. North America
12.1.1. Market Revenue and Forecast, by Component (2020-2032)
12.1.2. Market Revenue and Forecast, by Deployment (2020-2032)
12.1.3. Market Revenue and Forecast, by Organization Size (2020-2032)
12.1.4. Market Revenue and Forecast, by Vertical (2020-2032)
12.1.5. U.S.
12.1.5.1. Market Revenue and Forecast, by Component (2020-2032)
12.1.5.2. Market Revenue and Forecast, by Deployment (2020-2032)
12.1.5.3. Market Revenue and Forecast, by Organization Size (2020-2032)
12.1.5.4. Market Revenue and Forecast, by Vertical (2020-2032)
12.1.6. Rest of North America
12.1.6.1. Market Revenue and Forecast, by Component (2020-2032)
12.1.6.2. Market Revenue and Forecast, by Deployment (2020-2032)
12.1.6.3. Market Revenue and Forecast, by Organization Size (2020-2032)
12.1.6.4. Market Revenue and Forecast, by Vertical (2020-2032)
12.2. Europe
12.2.1. Market Revenue and Forecast, by Component (2020-2032)
12.2.2. Market Revenue and Forecast, by Deployment (2020-2032)
12.2.3. Market Revenue and Forecast, by Organization Size (2020-2032)
12.2.4. Market Revenue and Forecast, by Vertical (2020-2032)
12.2.5. UK
12.2.5.1. Market Revenue and Forecast, by Component (2020-2032)
12.2.5.2. Market Revenue and Forecast, by Deployment (2020-2032)
12.2.5.3. Market Revenue and Forecast, by Organization Size (2020-2032)
12.2.5.4. Market Revenue and Forecast, by Vertical (2020-2032)
12.2.6. Germany
12.2.6.1. Market Revenue and Forecast, by Component (2020-2032)
12.2.6.2. Market Revenue and Forecast, by Deployment (2020-2032)
12.2.6.3. Market Revenue and Forecast, by Organization Size (2020-2032)
12.2.6.4. Market Revenue and Forecast, by Vertical (2020-2032)
12.2.7. France
12.2.7.1. Market Revenue and Forecast, by Component (2020-2032)
12.2.7.2. Market Revenue and Forecast, by Deployment (2020-2032)
12.2.7.3. Market Revenue and Forecast, by Organization Size (2020-2032)
12.2.7.4. Market Revenue and Forecast, by Vertical (2020-2032)
12.2.8. Rest of Europe
12.2.8.1. Market Revenue and Forecast, by Component (2020-2032)
12.2.8.2. Market Revenue and Forecast, by Deployment (2020-2032)
12.2.8.3. Market Revenue and Forecast, by Organization Size (2020-2032)
12.2.8.4. Market Revenue and Forecast, by Vertical (2020-2032)
12.3. APAC
12.3.1. Market Revenue and Forecast, by Component (2020-2032)
12.3.2. Market Revenue and Forecast, by Deployment (2020-2032)
12.3.3. Market Revenue and Forecast, by Organization Size (2020-2032)
12.3.4. Market Revenue and Forecast, by Vertical (2020-2032)
12.3.5. India
12.3.5.1. Market Revenue and Forecast, by Component (2020-2032)
12.3.5.2. Market Revenue and Forecast, by Deployment (2020-2032)
12.3.5.3. Market Revenue and Forecast, by Organization Size (2020-2032)
12.3.5.4. Market Revenue and Forecast, by Vertical (2020-2032)
12.3.6. China
12.3.6.1. Market Revenue and Forecast, by Component (2020-2032)
12.3.6.2. Market Revenue and Forecast, by Deployment (2020-2032)
12.3.6.3. Market Revenue and Forecast, by Organization Size (2020-2032)
12.3.6.4. Market Revenue and Forecast, by Vertical (2020-2032)
12.3.7. Japan
12.3.7.1. Market Revenue and Forecast, by Component (2020-2032)
12.3.7.2. Market Revenue and Forecast, by Deployment (2020-2032)
12.3.7.3. Market Revenue and Forecast, by Organization Size (2020-2032)
12.3.7.4. Market Revenue and Forecast, by Vertical (2020-2032)
12.3.8. Rest of APAC
12.3.8.1. Market Revenue and Forecast, by Component (2020-2032)
12.3.8.2. Market Revenue and Forecast, by Deployment (2020-2032)
12.3.8.3. Market Revenue and Forecast, by Organization Size (2020-2032)
12.3.8.4. Market Revenue and Forecast, by Vertical (2020-2032)
12.4. MEA
12.4.1. Market Revenue and Forecast, by Component (2020-2032)
12.4.2. Market Revenue and Forecast, by Deployment (2020-2032)
12.4.3. Market Revenue and Forecast, by Organization Size (2020-2032)
12.4.4. Market Revenue and Forecast, by Vertical (2020-2032)
12.4.5. GCC
12.4.5.1. Market Revenue and Forecast, by Component (2020-2032)
12.4.5.2. Market Revenue and Forecast, by Deployment (2020-2032)
12.4.5.3. Market Revenue and Forecast, by Organization Size (2020-2032)
12.4.5.4. Market Revenue and Forecast, by Vertical (2020-2032)
12.4.6. North Africa
12.4.6.1. Market Revenue and Forecast, by Component (2020-2032)
12.4.6.2. Market Revenue and Forecast, by Deployment (2020-2032)
12.4.6.3. Market Revenue and Forecast, by Organization Size (2020-2032)
12.4.6.4. Market Revenue and Forecast, by Vertical (2020-2032)
12.4.7. South Africa
12.4.7.1. Market Revenue and Forecast, by Component (2020-2032)
12.4.7.2. Market Revenue and Forecast, by Deployment (2020-2032)
12.4.7.3. Market Revenue and Forecast, by Organization Size (2020-2032)
12.4.7.4. Market Revenue and Forecast, by Vertical (2020-2032)
12.4.8. Rest of MEA
12.4.8.1. Market Revenue and Forecast, by Component (2020-2032)
12.4.8.2. Market Revenue and Forecast, by Deployment (2020-2032)
12.4.8.3. Market Revenue and Forecast, by Organization Size (2020-2032)
12.4.8.4. Market Revenue and Forecast, by Vertical (2020-2032)
12.5. Latin America
12.5.1. Market Revenue and Forecast, by Component (2020-2032)
12.5.2. Market Revenue and Forecast, by Deployment (2020-2032)
12.5.3. Market Revenue and Forecast, by Organization Size (2020-2032)
12.5.4. Market Revenue and Forecast, by Vertical (2020-2032)
12.5.5. Brazil
12.5.5.1. Market Revenue and Forecast, by Component (2020-2032)
12.5.5.2. Market Revenue and Forecast, by Deployment (2020-2032)
12.5.5.3. Market Revenue and Forecast, by Organization Size (2020-2032)
12.5.5.4. Market Revenue and Forecast, by Vertical (2020-2032)
12.5.6. Rest of LATAM
12.5.6.1. Market Revenue and Forecast, by Component (2020-2032)
12.5.6.2. Market Revenue and Forecast, by Deployment (2020-2032)
12.5.6.3. Market Revenue and Forecast, by Organization Size (2020-2032)
12.5.6.4. Market Revenue and Forecast, by Vertical (2020-2032)
Chapter 13. Company Profiles
13.1. IBM Corp.
13.1.1. Company Overview
13.1.2. Product Offerings
13.1.3. Financial Performance
13.1.4. Recent Initiatives
13.2. Microsoft
13.2.1. Company Overview
13.2.2. Product Offerings
13.2.3. Financial Performance
13.2.4. Recent Initiatives
13.3. Google LLC
13.3.1. Company Overview
13.3.2. Product Offerings
13.3.3. Financial Performance
13.3.4. Recent Initiatives
13.4. Amazon Web Services, Inc.
13.4.1. Company Overview
13.4.2. Product Offerings
13.4.3. Financial Performance
13.4.4. Recent Initiatives
13.5. Hewlett Packard Enterprise Development LP
13.5.1. Company Overview
13.5.2. Product Offerings
13.5.3. Financial Performance
13.5.4. Recent Initiatives
13.6. Neptune Labs, Inc.
13.6.1. Company Overview
13.6.2. Product Offerings
13.6.3. Financial Performance
13.6.4. Recent Initiatives
13.7. DataRobot, Inc.
13.7.1. Company Overview
13.7.2. Product Offerings
13.7.3. Financial Performance
13.7.4. Recent Initiatives
13.8. Dataiku.
13.8.1. Company Overview
13.8.2. Product Offerings
13.8.3. Financial Performance
13.8.4. Recent Initiatives
13.9. ALTERYX, Inc.
13.9.1. Company Overview
13.9.2. Product Offerings
13.9.3. Financial Performance
13.9.4. Recent Initiatives
13.10. GAVS Technologies N.A., Inc.
13.10.1. Company Overview
13.10.2. Product Offerings
13.10.3. Financial Performance
13.10.4. Recent Initiatives
Chapter 14. Research Methodology
14.1. Primary Research
14.2. Secondary Research
14.3. Assumptions
Chapter 15. Appendix
15.1. About Us
15.2. Glossary of Terms
 Cross-segment Market Size and Analysis for
Mentioned Segments
 Additional Company Profiles (Upto 5 With No Cost)
 Additional Countries (Apart From Mentioned Countries)
 Country/Region-specific Report
 Go To Market Strategy
 Region Specific Market Dynamics
 Region Level Market Share
 Import Export Analysis
 Production Analysis
 Others