Mobile POS Terminals Market Size, Share, Growth, Trends | Report 2023-2032
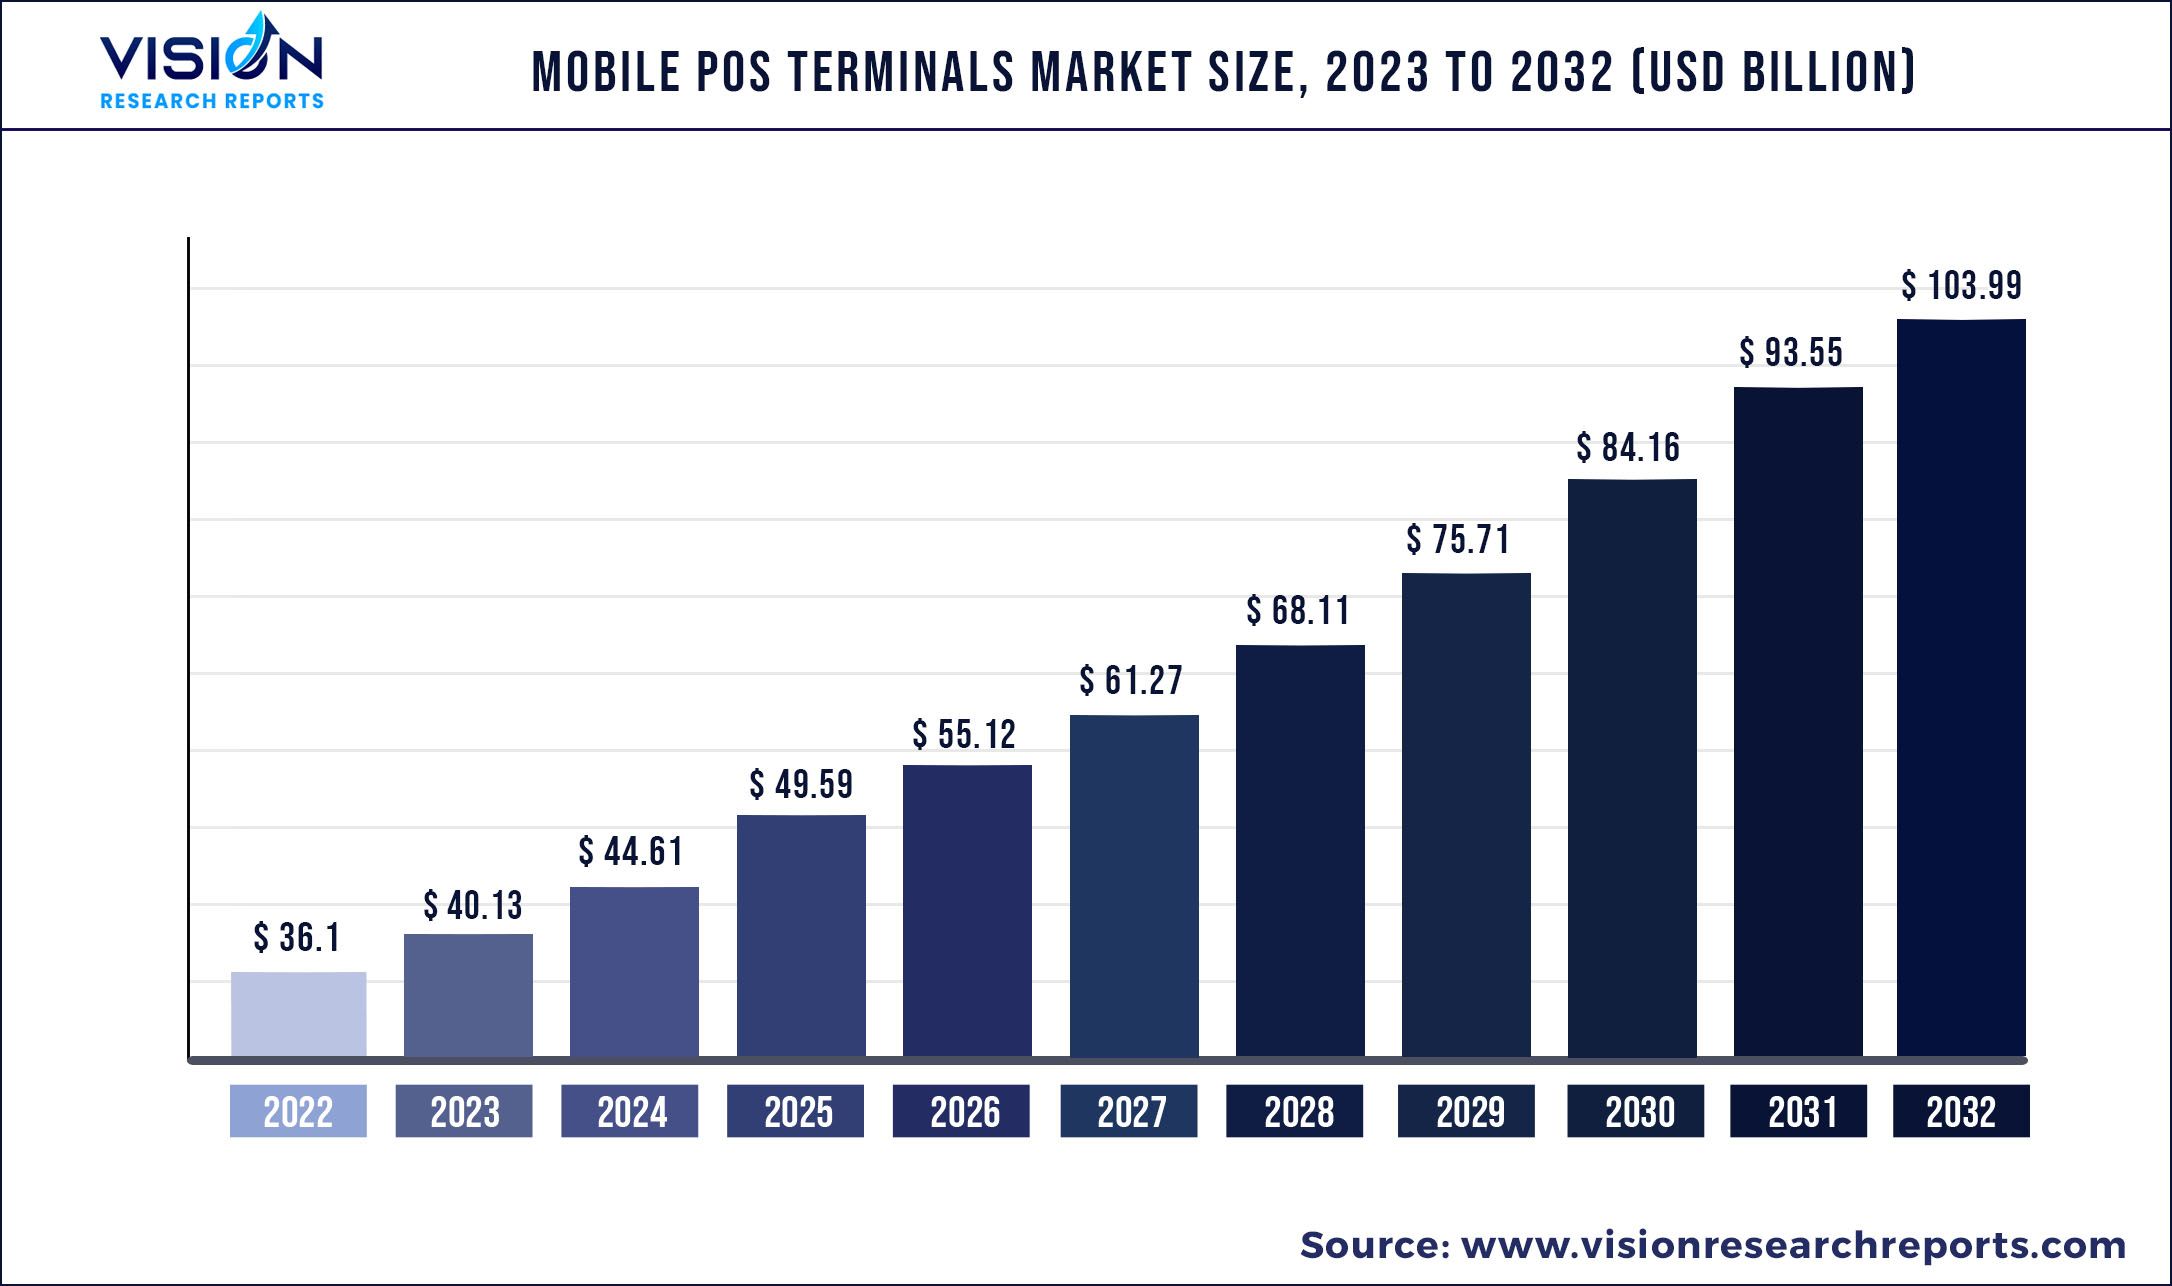
The global mobile POS terminals market size was estimated at around USD 36.1 billion in 2022 and it is projected to hit around USD 103.99 billion by 2032, growing at a CAGR of 11.16% from 2023 to 2032.
Key Pointers
Report Scope of the Mobile POS Terminals Market
| Report Coverage | Details |
| Market Size in 2022 | USD 36.1 billion |
| Revenue Forecast by 2032 | USD 103.99 billion |
| Growth rate from 2023 to 2032 | CAGR of 11.16% |
| Base Year | 2022 |
| Forecast Period | 2023 to 2032 |
| Regions Covered | North America, Europe, Asia Pacific, Latin America, Middle East & Africa |
| Companies Covered | Fiserv, Inc.; Hewlett Packard Enterprise Development LP; Ingenico; NEC Corporation; Oracle; Panasonic Holdings Corporation; PAX Technology; Posiflex Technology, Inc.; QVS Software; SAMSUNG; SPECTRA Technologies; TOSHIBA CORPORATION; VeriFone, Inc.; Zebra Technologies Corp. |
A mobile POS terminals device is a smartphone, tablet, or wireless device which wirelessly executes the functions such as cash registers or electronic POS terminals. The mobile POS terminals market has grown in recent years due to improved deployments in large retailers across a wide range of store formats in regional markets. The convergence of mobile and online payment channels at a time of significant growth in the mobile app and smartphone industry is being one of the driving factors for mPOS terminal adoption.
A major factor driving the mobile POS terminals market is the increasing emphasis of businesses on improving the customer experience. Mobile POS solutions are adopted because of check-out lines at markets and large stores frequently waste customers' time. However, customers can make the sale directly from the main product area in a store, paying for the products digitally and avoiding long lines. These solutions increase customer satisfaction, which increases brand loyalty and trust, hence businesses are rapidly shifting from traditional systems to smartphone and tablet POS.
Escalating demand for mPOS terminals across industries is one of the major factors driving the overall market. The affordable price of installing mPOS in the store along with security and intuitive interface has encouraged small and mid-size businesses (SMBs) to adopt the solution for their stores. Although SMBs are struggling to navigate the impact of business disruptions and lost traffic during the COVID-19 outbreak, the demand for mPOS is expected to increase as more people use digital payment to shop from their homes. Moreover, a reduction in Total Cost of Ownership (TCO) and improved return on investments offered by mPOS terminals have considerably increased their demand in SMBs.
However, there are some factors that impede the growth of the market. The prevailing cash payment system in many countries coupled with the stringent government regulation for payment processing is expected to restrain the mPOS terminal market growth. Cash payment at small vendors, fairs, and countries with poor economic conditions will slow down the growth in the forecast period. While adhering to PCI and other payments and data collection compliance ensure secure payment, the complexity of adhering to them hinders the adoption of mPOS terminal.
Moreover, new emerging market players are introducing new strategic initiatives and partnerships among others that leverage the growth of the market. These strategies include mobile discounts, loyalty programs, gift cards, vouchers, and cash-back offers among others. Key trends such as increasing technological advancements such as cloud-based mPOS increase the growth of the market. Hence, emerging market players and technological trends provide lucrative opportunities for market growth.
COVID-19 had a positive impact on the mobile POS terminals market. Digitization accelerated in the hospitality and retail sectors owing to increased emphasis on social distancing and the mandatory use of masks to avoid COVID-19 contraction. Many financial service providers increased the limits for contactless payments, allowing for simpler and more streamlined cashless transactions. As a result, mobile POS terminals gained popularity because they provided a quicker and more seamless payment option.
Mobile POS Terminals Market Segmentations:
| By Component | By Type | By Application |
|
Hardware Software |
Tablets Others |
Restaurant Hospitality Healthcare Retail Warehouse Entertainment Others |
Chapter 1. Introduction
1.1. Research Objective
1.2. Scope of the Study
1.3. Definition
Chapter 2. Research Methodology
2.1. Research Approach
2.2. Data Sources
2.3. Assumptions & Limitations
Chapter 3. Executive Summary
3.1. Market Snapshot
Chapter 4. Market Variables and Scope
4.1. Introduction
4.2. Market Classification and Scope
4.3. Industry Value Chain Analysis
4.3.1. Raw Material Procurement Analysis
4.3.2. Sales and Distribution Component Analysis
4.3.3. Downstream Buyer Analysis
Chapter 5. COVID 19 Impact on Mobile POS Terminals Market
5.1. COVID-19 Landscape: Mobile POS Terminals Industry Impact
5.2. COVID 19 - Impact Assessment for the Industry
5.3. COVID 19 Impact: Global Major Government Policy
5.4. Market Trends and Opportunities in the COVID-19 Landscape
Chapter 6. Market Dynamics Analysis and Trends
6.1. Market Dynamics
6.1.1. Market Drivers
6.1.2. Market Restraints
6.1.3. Market Opportunities
6.2. Porter’s Five Forces Analysis
6.2.1. Bargaining power of suppliers
6.2.2. Bargaining power of buyers
6.2.3. Threat of substitute
6.2.4. Threat of new entrants
6.2.5. Degree of competition
Chapter 7. Competitive Landscape
7.1.1. Company Market Share/Positioning Analysis
7.1.2. Key Strategies Adopted by Players
7.1.3. Vendor Landscape
7.1.3.1. List of Suppliers
7.1.3.2. List of Buyers
Chapter 8. Global Mobile POS Terminals Market, By Component
8.1. Mobile POS Terminals Market, by Component, 2023-2032
8.1.1 Hardware
8.1.1.1. Market Revenue and Forecast (2020-2032)
8.1.2. Software
8.1.2.1. Market Revenue and Forecast (2020-2032)
Chapter 9. Global Mobile POS Terminals Market, By Type
9.1. Mobile POS Terminals Market, by Type, 2023-2032
9.1.1. Tablets
9.1.1.1. Market Revenue and Forecast (2020-2032)
9.1.2. Others
9.1.2.1. Market Revenue and Forecast (2020-2032)
Chapter 10. Global Mobile POS Terminals Market, By Application
10.1. Mobile POS Terminals Market, by Application, 2023-2032
10.1.1. Restaurant
10.1.1.1. Market Revenue and Forecast (2020-2032)
10.1.2. Hospitality
10.1.2.1. Market Revenue and Forecast (2020-2032)
10.1.3. Healthcare
10.1.3.1. Market Revenue and Forecast (2020-2032)
10.1.4. Retail
10.1.4.1. Market Revenue and Forecast (2020-2032)
10.1.5. Warehouse
10.1.5.1. Market Revenue and Forecast (2020-2032)
10.1.6. Entertainment
10.1.6.1. Market Revenue and Forecast (2020-2032)
10.1.7. Others
10.1.7.1. Market Revenue and Forecast (2020-2032)
Chapter 11. Global Mobile POS Terminals Market, Regional Estimates and Trend Forecast
11.1. North America
11.1.1. Market Revenue and Forecast, by Component (2020-2032)
11.1.2. Market Revenue and Forecast, by Type (2020-2032)
11.1.3. Market Revenue and Forecast, by Application (2020-2032)
11.1.4. U.S.
11.1.4.1. Market Revenue and Forecast, by Component (2020-2032)
11.1.4.2. Market Revenue and Forecast, by Type (2020-2032)
11.1.4.3. Market Revenue and Forecast, by Application (2020-2032)
11.1.5. Rest of North America
11.1.5.1. Market Revenue and Forecast, by Component (2020-2032)
11.1.5.2. Market Revenue and Forecast, by Type (2020-2032)
11.1.5.3. Market Revenue and Forecast, by Application (2020-2032)
11.2. Europe
11.2.1. Market Revenue and Forecast, by Component (2020-2032)
11.2.2. Market Revenue and Forecast, by Type (2020-2032)
11.2.3. Market Revenue and Forecast, by Application (2020-2032)
11.2.4. UK
11.2.4.1. Market Revenue and Forecast, by Component (2020-2032)
11.2.4.2. Market Revenue and Forecast, by Type (2020-2032)
11.2.4.3. Market Revenue and Forecast, by Application (2020-2032)
11.2.5. Germany
11.2.5.1. Market Revenue and Forecast, by Component (2020-2032)
11.2.5.2. Market Revenue and Forecast, by Type (2020-2032)
11.2.5.3. Market Revenue and Forecast, by Application (2020-2032)
11.2.6. France
11.2.6.1. Market Revenue and Forecast, by Component (2020-2032)
11.2.6.2. Market Revenue and Forecast, by Type (2020-2032)
11.2.6.3. Market Revenue and Forecast, by Application (2020-2032)
11.2.7. Rest of Europe
11.2.7.1. Market Revenue and Forecast, by Component (2020-2032)
11.2.7.2. Market Revenue and Forecast, by Type (2020-2032)
11.2.7.3. Market Revenue and Forecast, by Application (2020-2032)
11.3. APAC
11.3.1. Market Revenue and Forecast, by Component (2020-2032)
11.3.2. Market Revenue and Forecast, by Type (2020-2032)
11.3.3. Market Revenue and Forecast, by Application (2020-2032)
11.3.4. India
11.3.4.1. Market Revenue and Forecast, by Component (2020-2032)
11.3.4.2. Market Revenue and Forecast, by Type (2020-2032)
11.3.4.3. Market Revenue and Forecast, by Application (2020-2032)
11.3.5. China
11.3.5.1. Market Revenue and Forecast, by Component (2020-2032)
11.3.5.2. Market Revenue and Forecast, by Type (2020-2032)
11.3.5.3. Market Revenue and Forecast, by Application (2020-2032)
11.3.6. Japan
11.3.6.1. Market Revenue and Forecast, by Component (2020-2032)
11.3.6.2. Market Revenue and Forecast, by Type (2020-2032)
11.3.6.3. Market Revenue and Forecast, by Application (2020-2032)
11.3.7. Rest of APAC
11.3.7.1. Market Revenue and Forecast, by Component (2020-2032)
11.3.7.2. Market Revenue and Forecast, by Type (2020-2032)
11.3.7.3. Market Revenue and Forecast, by Application (2020-2032)
11.4. MEA
11.4.1. Market Revenue and Forecast, by Component (2020-2032)
11.4.2. Market Revenue and Forecast, by Type (2020-2032)
11.4.3. Market Revenue and Forecast, by Application (2020-2032)
11.4.4. GCC
11.4.4.1. Market Revenue and Forecast, by Component (2020-2032)
11.4.4.2. Market Revenue and Forecast, by Type (2020-2032)
11.4.4.3. Market Revenue and Forecast, by Application (2020-2032)
11.4.5. North Africa
11.4.5.1. Market Revenue and Forecast, by Component (2020-2032)
11.4.5.2. Market Revenue and Forecast, by Type (2020-2032)
11.4.5.3. Market Revenue and Forecast, by Application (2020-2032)
11.4.6. South Africa
11.4.6.1. Market Revenue and Forecast, by Component (2020-2032)
11.4.6.2. Market Revenue and Forecast, by Type (2020-2032)
11.4.6.3. Market Revenue and Forecast, by Application (2020-2032)
11.4.7. Rest of MEA
11.4.7.1. Market Revenue and Forecast, by Component (2020-2032)
11.4.7.2. Market Revenue and Forecast, by Type (2020-2032)
11.4.7.3. Market Revenue and Forecast, by Application (2020-2032)
11.5. Latin America
11.5.1. Market Revenue and Forecast, by Component (2020-2032)
11.5.2. Market Revenue and Forecast, by Type (2020-2032)
11.5.3. Market Revenue and Forecast, by Application (2020-2032)
11.5.4. Brazil
11.5.4.1. Market Revenue and Forecast, by Component (2020-2032)
11.5.4.2. Market Revenue and Forecast, by Type (2020-2032)
11.5.4.3. Market Revenue and Forecast, by Application (2020-2032)
11.5.5. Rest of LATAM
11.5.5.1. Market Revenue and Forecast, by Component (2020-2032)
11.5.5.2. Market Revenue and Forecast, by Type (2020-2032)
11.5.5.3. Market Revenue and Forecast, by Application (2020-2032)
Chapter 12. Company Profiles
12.1. Fiserv, Inc.
12.1.1. Company Overview
12.1.2. Product Offerings
12.1.3. Financial Performance
12.1.4. Recent Initiatives
12.2. Hewlett Packard Enterprise Development LP
12.2.1. Company Overview
12.2.2. Product Offerings
12.2.3. Financial Performance
12.2.4. Recent Initiatives
12.3. Ingenico
12.3.1. Company Overview
12.3.2. Product Offerings
12.3.3. Financial Performance
12.3.4. Recent Initiatives
12.4. NEC Corporation
12.4.1. Company Overview
12.4.2. Product Offerings
12.4.3. Financial Performance
12.4.4. Recent Initiatives
12.5. Oracle
12.5.1. Company Overview
12.5.2. Product Offerings
12.5.3. Financial Performance
12.5.4. Recent Initiatives
12.6. Panasonic Holdings Corporation
12.6.1. Company Overview
12.6.2. Product Offerings
12.6.3. Financial Performance
12.6.4. Recent Initiatives
12.7. PAX Technology
12.7.1. Company Overview
12.7.2. Product Offerings
12.7.3. Financial Performance
12.7.4. Recent Initiatives
12.8. Posiflex Technology, Inc.
12.8.1. Company Overview
12.8.2. Product Offerings
12.8.3. Financial Performance
12.8.4. Recent Initiatives
12.9. QVS Software
12.9.1. Company Overview
12.9.2. Product Offerings
12.9.3. Financial Performance
12.9.4. Recent Initiatives
12.10. SAMSUNG
12.10.1. Company Overview
12.10.2. Product Offerings
12.10.3. Financial Performance
12.10.4. Recent Initiatives
Chapter 13. Research Methodology
13.1. Primary Research
13.2. Secondary Research
13.3. Assumptions
Chapter 14. Appendix
14.1. About Us
14.2. Glossary of Terms
 Cross-segment Market Size and Analysis for
Mentioned Segments
Additional Company Profiles (Upto 5 With No Cost)
Additional Countries (Apart From Mentioned Countries)
Country/Region-specific Report
Go To Market Strategy
Region Specific Market DynamicsRegion Level Market Share Import Export AnalysisProduction AnalysisOthers
Cross-segment Market Size and Analysis for
Mentioned Segments
Additional Company Profiles (Upto 5 With No Cost)
Additional Countries (Apart From Mentioned Countries)
Country/Region-specific Report
Go To Market Strategy
Region Specific Market DynamicsRegion Level Market Share Import Export AnalysisProduction AnalysisOthers