Nanoclay Market Size, Trends, Share, Growth | Report 2023-2032
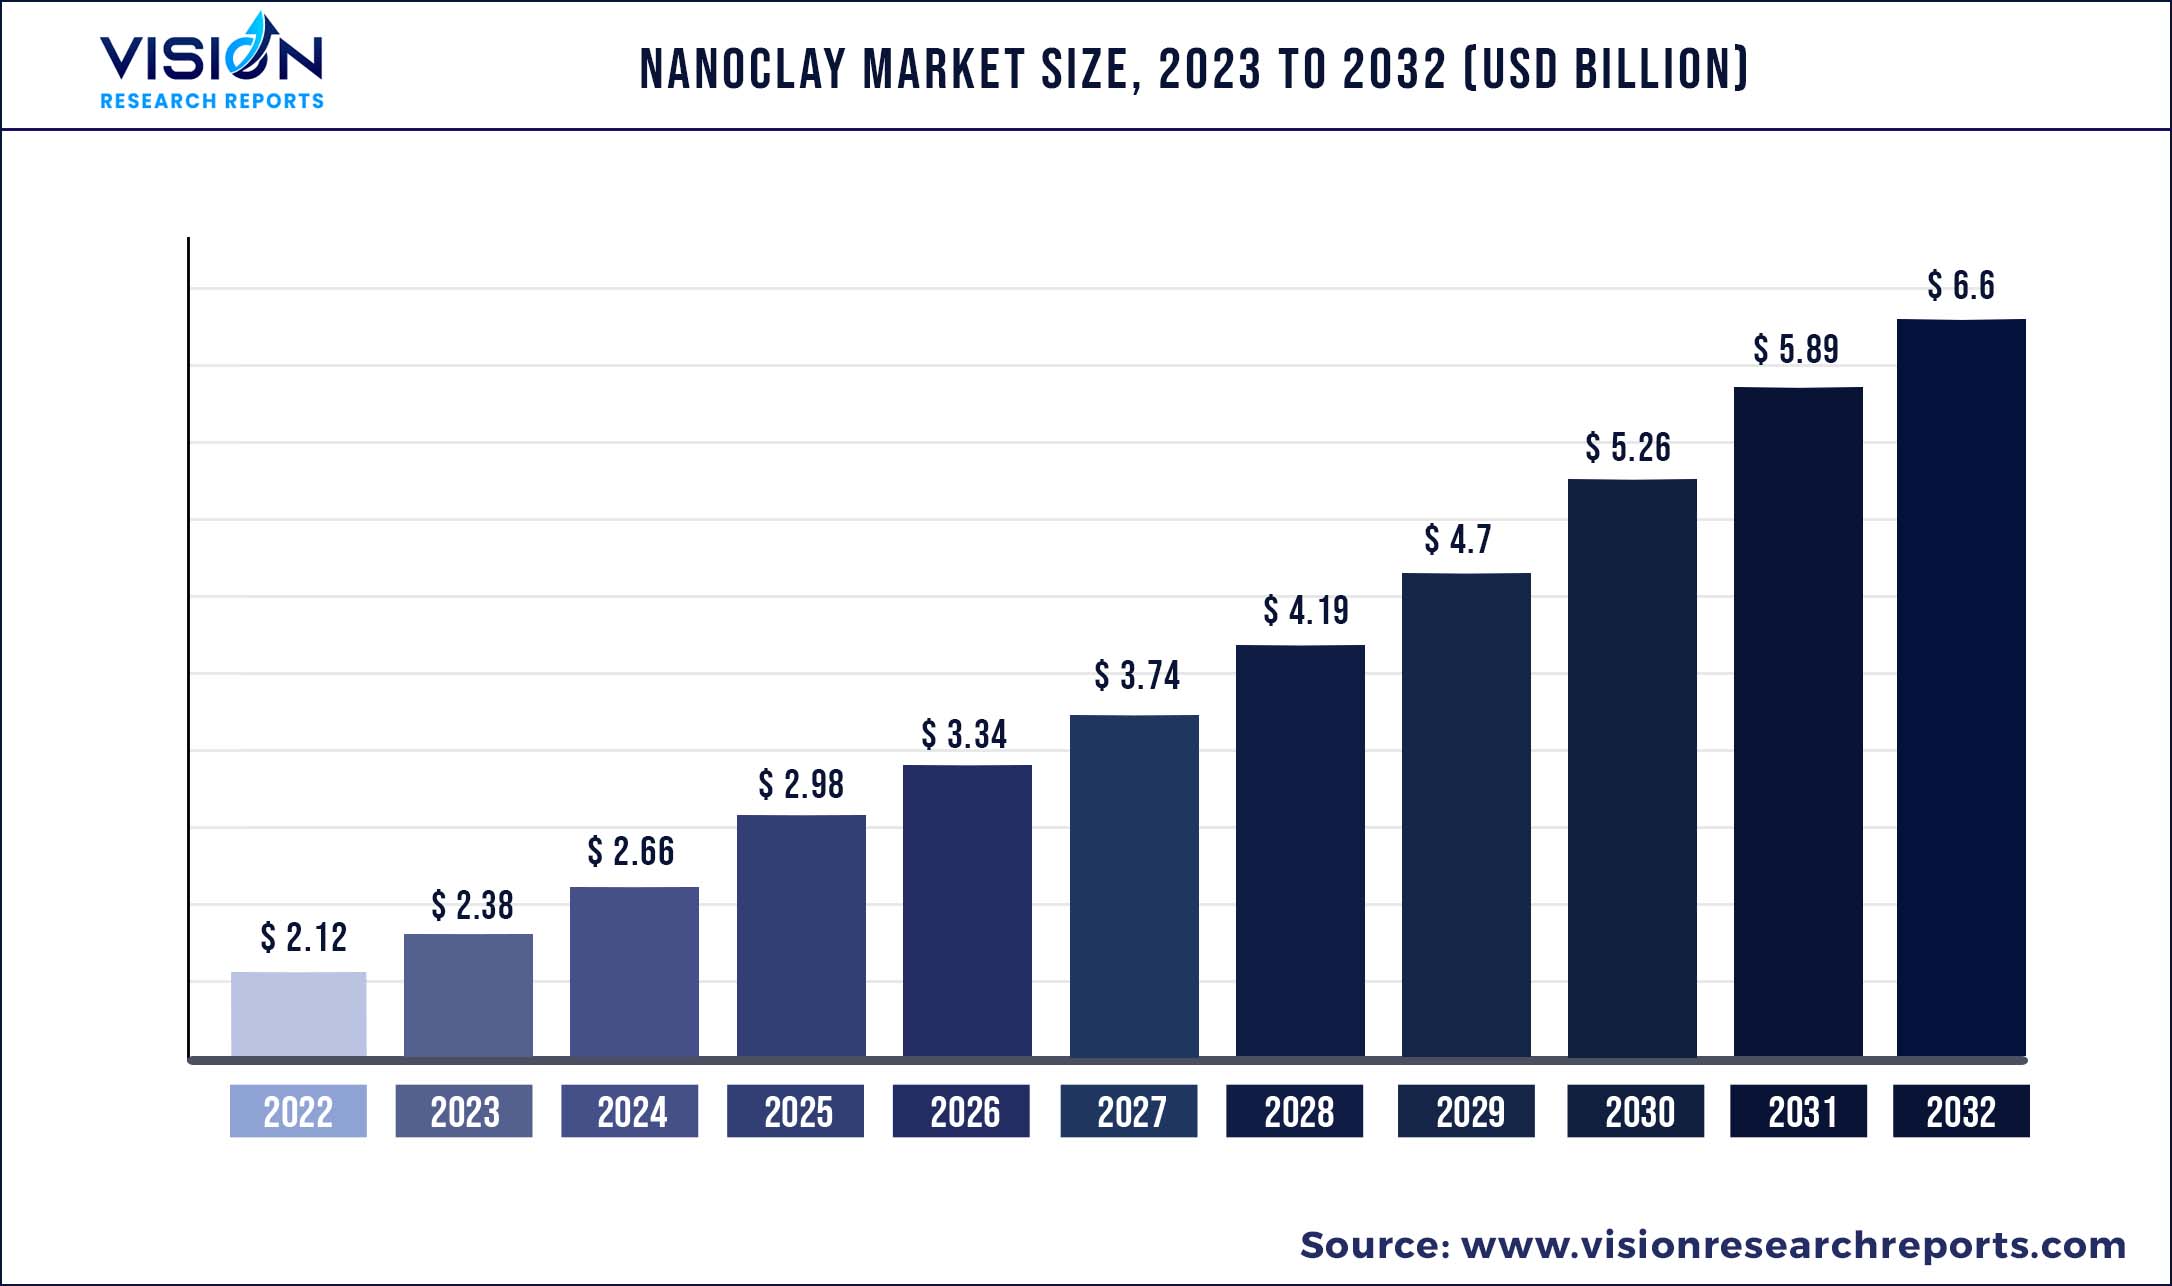
The global nanoclay market size was estimated at around USD 2.12 billion in 2022 and it is projected to hit around USD 6.6 billion by 2032, growing at a CAGR of 12.03% from 2023 to 2032.
Key Pointers
Report Scope of the Nanoclay Market
| Report Coverage | Details |
| Market Size in 2022 | USD 2.12 billion |
| Revenue Forecast by 2032 | USD 6.6 billion |
| Growth rate from 2023 to 2032 | CAGR of 12.03% |
| Base Year | 2022 |
| Forecast Period | 2023 to 2032 |
| Regions Covered | North America, Europe, Asia Pacific, Latin America, Middle East & Africa |
| Companies Covered | Merck KGaA, Hangzhou Sino-Holding Chemicals Co., Ltd, Nanocor Inc., Elementis Specialties, Laviosa Minerals SRL, and Kunimine Industries Co., Ltd, among others |
Nanoclay is a component composed of phyllosilicates, which are compounds based on elements such as oxygen, silicon, and others and are degraded from natural sources and pretreated chemically. Nanoclay is used in different products. Due to their layered structure, they can swell up and shrink as water accumulates between layers. Nanoclay is nanoparticles of layered mineral silicate.
Nanoclay are mainly found from the naturally occurring sedimentary rock ‘bentonite’ which comprises 60%-80% of montmorillonite. Montmorillonite-rich clays have to get up from the transformation and weathering of tuffs, basic rocks, and volcanic ash. Nanoclay is not flammable, it is used in fire protection in plastics and it is mixed in plastics which decreases the quality of combustible material. Nanoclay is used as a plastic additive in food packaging. Plastic is thereby reinforced, and less oxygen penetrates the film, so the food can last longer.
Nanoclay-added plastics also have improved barriers and abrasion properties such as higher tensile strength, low thermal expansion, superior surface qualities, and good processing properties. To use as cat litter, a mixture of sepiolite and zeolites is used. They are characterized by high absorption capability for water and odor-causing elements of urine. Nanoclay can bind the cesium and can be used for reducing radioactive contamination and are extensively used in paints.
Market Overview
Growing demand for coating and packaging applications, changing lifestyles and rapid urbanization, and increasing demand from the food and beverages industry for packaging are driving the growth of the Nanoclay Market. The nanoclay products show improved thermal, mechanical, and biodegradable properties along with enhanced obstruction to microbial and contaminating agents. The product has wide usage in the packaging and coating sector due to its high quality, versatility, flexibility, high tensile strength, and lower cost as compared to other packaging products which help in boosting the growth of the market.
Moreover, increasing demand for nanoclay-based reinforced polymer and increasing growth of the automotive and aerospace industries are providing growth opportunities to the market. The automotive industry uses nano clay in the manufacturing of lightweight components and these components reduce the weight of the vehicle and significantly lower fuel consumption which can offer a great opportunity to the market.
However, high production costs and strict regulatory policies for nanoclay in a few end-user industries can hamper the growth of the market. These nanoclay are specially engineered materials that have gained significance in a short span of time and the equipment and machines that are used are slightly expensive and require high maintenance on a regular basis which requires a huge amount for production.
Nanoclay Market Segmentations:
| By Product | By Distribution Channel | By Application |
|
Kaolinite Smectite Others |
Offline Stores Online Stores |
Packaging Flame Retardants Automotive Paints & Coatings Others |
Chapter 1. Introduction
1.1. Research Objective
1.2. Scope of the Study
1.3. Definition
Chapter 2. Research Methodology
2.1. Research Approach
2.2. Data Sources
2.3. Assumptions & Limitations
Chapter 3. Executive Summary
3.1. Market Snapshot
Chapter 4. Market Variables and Scope
4.1. Introduction
4.2. Market Classification and Scope
4.3. Industry Value Chain Analysis
4.3.1. Raw Material Procurement Analysis
4.3.2. Sales and Distribution Product Analysis
4.3.3. Downstream Buyer Analysis
Chapter 5. COVID 19 Impact on Nanoclay Market
5.1. COVID-19 Landscape: Nanoclay Industry Impact
5.2. COVID 19 - Impact Assessment for the Industry
5.3. COVID 19 Impact: Global Major Government Policy
5.4. Market Trends and Opportunities in the COVID-19 Landscape
Chapter 6. Market Dynamics Analysis and Trends
6.1. Market Dynamics
6.1.1. Market Drivers
6.1.2. Market Restraints
6.1.3. Market Opportunities
6.2. Porter’s Five Forces Analysis
6.2.1. Bargaining power of suppliers
6.2.2. Bargaining power of buyers
6.2.3. Threat of substitute
6.2.4. Threat of new entrants
6.2.5. Degree of competition
Chapter 7. Competitive Landscape
7.1.1. Company Market Share/Positioning Analysis
7.1.2. Key Strategies Adopted by Players
7.1.3. Vendor Landscape
7.1.3.1. List of Suppliers
7.1.3.2. List of Buyers
Chapter 8. Global Nanoclay Market, By Product
8.1. Nanoclay Market, by Product, 2023-2032
8.1.1 Kaolinite
8.1.1.1. Market Revenue and Forecast (2020-2032)
8.1.2. Smectite
8.1.2.1. Market Revenue and Forecast (2020-2032)
8.1.3. Others
8.1.3.1. Market Revenue and Forecast (2020-2032)
Chapter 9. Global Nanoclay Market, By Distribution Channel
9.1. Nanoclay Market, by Distribution Channel, 2023-2032
9.1.1. Offline Stores
9.1.1.1. Market Revenue and Forecast (2020-2032)
9.1.2. Online Stores
9.1.2.1. Market Revenue and Forecast (2020-2032)
Chapter 10. Global Nanoclay Market, By Application
10.1. Nanoclay Market, by Application, 2023-2032
10.1.1. Packaging
10.1.1.1. Market Revenue and Forecast (2020-2032)
10.1.2. Flame Retardants
10.1.2.1. Market Revenue and Forecast (2020-2032)
10.1.3. Automotive
10.1.3.1. Market Revenue and Forecast (2020-2032)
10.1.4. Paints & Coatings
10.1.4.1. Market Revenue and Forecast (2020-2032)
10.1.5. Others
10.1.5.1. Market Revenue and Forecast (2020-2032)
Chapter 11. Global Nanoclay Market, Regional Estimates and Trend Forecast
11.1. North America
11.1.1. Market Revenue and Forecast, by Product (2020-2032)
11.1.2. Market Revenue and Forecast, by Distribution Channel (2020-2032)
11.1.3. Market Revenue and Forecast, by Application (2020-2032)
11.1.4. U.S.
11.1.4.1. Market Revenue and Forecast, by Product (2020-2032)
11.1.4.2. Market Revenue and Forecast, by Distribution Channel (2020-2032)
11.1.4.3. Market Revenue and Forecast, by Application (2020-2032)
11.1.5. Rest of North America
11.1.5.1. Market Revenue and Forecast, by Product (2020-2032)
11.1.5.2. Market Revenue and Forecast, by Distribution Channel (2020-2032)
11.1.5.3. Market Revenue and Forecast, by Application (2020-2032)
11.2. Europe
11.2.1. Market Revenue and Forecast, by Product (2020-2032)
11.2.2. Market Revenue and Forecast, by Distribution Channel (2020-2032)
11.2.3. Market Revenue and Forecast, by Application (2020-2032)
11.2.4. UK
11.2.4.1. Market Revenue and Forecast, by Product (2020-2032)
11.2.4.2. Market Revenue and Forecast, by Distribution Channel (2020-2032)
11.2.4.3. Market Revenue and Forecast, by Application (2020-2032)
11.2.5. Germany
11.2.5.1. Market Revenue and Forecast, by Product (2020-2032)
11.2.5.2. Market Revenue and Forecast, by Distribution Channel (2020-2032)
11.2.5.3. Market Revenue and Forecast, by Application (2020-2032)
11.2.6. France
11.2.6.1. Market Revenue and Forecast, by Product (2020-2032)
11.2.6.2. Market Revenue and Forecast, by Distribution Channel (2020-2032)
11.2.6.3. Market Revenue and Forecast, by Application (2020-2032)
11.2.7. Rest of Europe
11.2.7.1. Market Revenue and Forecast, by Product (2020-2032)
11.2.7.2. Market Revenue and Forecast, by Distribution Channel (2020-2032)
11.2.7.3. Market Revenue and Forecast, by Application (2020-2032)
11.3. APAC
11.3.1. Market Revenue and Forecast, by Product (2020-2032)
11.3.2. Market Revenue and Forecast, by Distribution Channel (2020-2032)
11.3.3. Market Revenue and Forecast, by Application (2020-2032)
11.3.4. India
11.3.4.1. Market Revenue and Forecast, by Product (2020-2032)
11.3.4.2. Market Revenue and Forecast, by Distribution Channel (2020-2032)
11.3.4.3. Market Revenue and Forecast, by Application (2020-2032)
11.3.5. China
11.3.5.1. Market Revenue and Forecast, by Product (2020-2032)
11.3.5.2. Market Revenue and Forecast, by Distribution Channel (2020-2032)
11.3.5.3. Market Revenue and Forecast, by Application (2020-2032)
11.3.6. Japan
11.3.6.1. Market Revenue and Forecast, by Product (2020-2032)
11.3.6.2. Market Revenue and Forecast, by Distribution Channel (2020-2032)
11.3.6.3. Market Revenue and Forecast, by Application (2020-2032)
11.3.7. Rest of APAC
11.3.7.1. Market Revenue and Forecast, by Product (2020-2032)
11.3.7.2. Market Revenue and Forecast, by Distribution Channel (2020-2032)
11.3.7.3. Market Revenue and Forecast, by Application (2020-2032)
11.4. MEA
11.4.1. Market Revenue and Forecast, by Product (2020-2032)
11.4.2. Market Revenue and Forecast, by Distribution Channel (2020-2032)
11.4.3. Market Revenue and Forecast, by Application (2020-2032)
11.4.4. GCC
11.4.4.1. Market Revenue and Forecast, by Product (2020-2032)
11.4.4.2. Market Revenue and Forecast, by Distribution Channel (2020-2032)
11.4.4.3. Market Revenue and Forecast, by Application (2020-2032)
11.4.5. North Africa
11.4.5.1. Market Revenue and Forecast, by Product (2020-2032)
11.4.5.2. Market Revenue and Forecast, by Distribution Channel (2020-2032)
11.4.5.3. Market Revenue and Forecast, by Application (2020-2032)
11.4.6. South Africa
11.4.6.1. Market Revenue and Forecast, by Product (2020-2032)
11.4.6.2. Market Revenue and Forecast, by Distribution Channel (2020-2032)
11.4.6.3. Market Revenue and Forecast, by Application (2020-2032)
11.4.7. Rest of MEA
11.4.7.1. Market Revenue and Forecast, by Product (2020-2032)
11.4.7.2. Market Revenue and Forecast, by Distribution Channel (2020-2032)
11.4.7.3. Market Revenue and Forecast, by Application (2020-2032)
11.5. Latin America
11.5.1. Market Revenue and Forecast, by Product (2020-2032)
11.5.2. Market Revenue and Forecast, by Distribution Channel (2020-2032)
11.5.3. Market Revenue and Forecast, by Application (2020-2032)
11.5.4. Brazil
11.5.4.1. Market Revenue and Forecast, by Product (2020-2032)
11.5.4.2. Market Revenue and Forecast, by Distribution Channel (2020-2032)
11.5.4.3. Market Revenue and Forecast, by Application (2020-2032)
11.5.5. Rest of LATAM
11.5.5.1. Market Revenue and Forecast, by Product (2020-2032)
11.5.5.2. Market Revenue and Forecast, by Distribution Channel (2020-2032)
11.5.5.3. Market Revenue and Forecast, by Application (2020-2032)
Chapter 12. Company Profiles
12.1. Merck KGaA
12.1.1. Company Overview
12.1.2. Product Offerings
12.1.3. Financial Performance
12.1.4. Recent Initiatives
12.2. Hangzhou Sino-Holding Chemicals Co., Ltd
12.2.1. Company Overview
12.2.2. Product Offerings
12.2.3. Financial Performance
12.2.4. Recent Initiatives
12.3. Nanocor Inc.
12.3.1. Company Overview
12.3.2. Product Offerings
12.3.3. Financial Performance
12.3.4. Recent Initiatives
12.4. Elementis Specialties
12.4.1. Company Overview
12.4.2. Product Offerings
12.4.3. Financial Performance
12.4.4. Recent Initiatives
12.5. Laviosa Minerals SRL
12.5.1. Company Overview
12.5.2. Product Offerings
12.5.3. Financial Performance
12.5.4. Recent Initiatives
12.6. Kunimine Industries Co., Ltd
12.6.1. Company Overview
12.6.2. Product Offerings
12.6.3. Financial Performance
12.6.4. Recent Initiatives
12.7. others
12.7.1. Company Overview
12.7.2. Product Offerings
12.7.3. Financial Performance
12.7.4. Recent Initiatives
Chapter 13. Research Methodology
13.1. Primary Research
13.2. Secondary Research
13.3. Assumptions
Chapter 14. Appendix
14.1. About Us
14.2. Glossary of Terms
 Cross-segment Market Size and Analysis for
Mentioned Segments
Additional Company Profiles (Upto 5 With No Cost)
Additional Countries (Apart From Mentioned Countries)
Country/Region-specific Report
Go To Market Strategy
Region Specific Market DynamicsRegion Level Market Share Import Export AnalysisProduction AnalysisOthers
Cross-segment Market Size and Analysis for
Mentioned Segments
Additional Company Profiles (Upto 5 With No Cost)
Additional Countries (Apart From Mentioned Countries)
Country/Region-specific Report
Go To Market Strategy
Region Specific Market DynamicsRegion Level Market Share Import Export AnalysisProduction AnalysisOthers