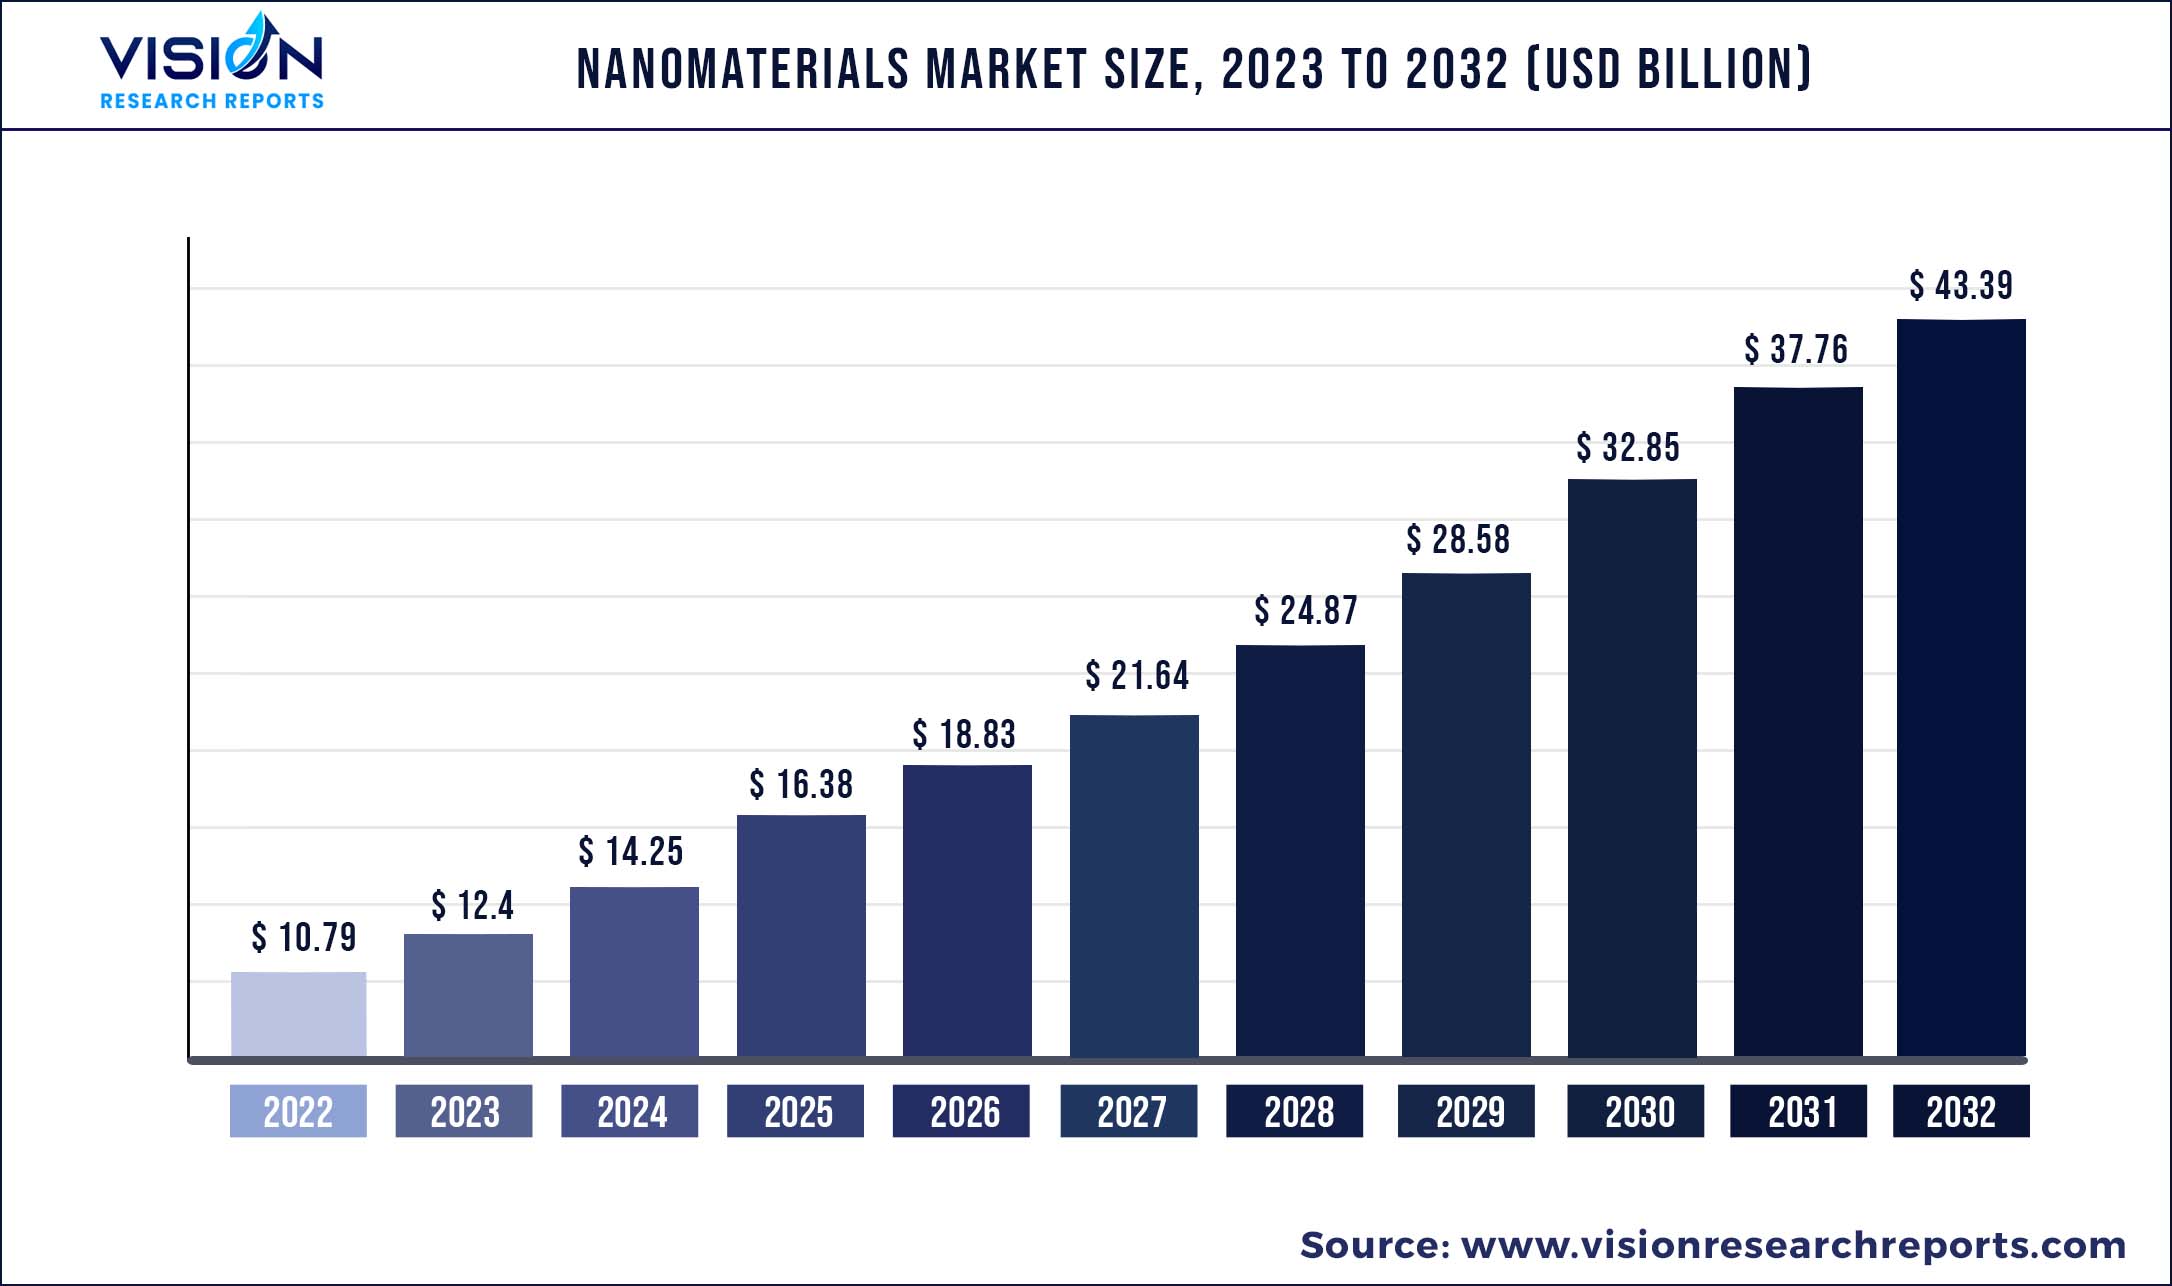
The global nanomaterials market size was estimated at around USD 10.79 billion in 2022 and it is projected to hit around USD 43.39 billion by 2032, growing at a CAGR of 14.93% from 2023 to 2032.
Key Pointers
Report Scope of the Nanomaterials Market
| Report Coverage | Details |
| Market Size in 2022 | USD 10.79 billion |
| Revenue Forecast by 2032 | USD 43.39 billion |
| Growth rate from 2023 to 2032 | CAGR of 14.93% |
| Base Year | 2022 |
| Forecast Period | 2023 to 2032 |
| Regions Covered | North America, Europe, Asia Pacific, Latin America, Middle East & Africa |
| Companies Covered | Strem Chemicals, Inc.; American Elements; US Research Nanomaterials, Inc.; Nanocomposix, Inc.; Frontier Carbon Corporation; Nanoshel LLC; SkySpring Nanomaterials, Inc.; Nanophase Technologies Corporation; Cytodiagnostics, Inc.; Quantum Materials Corp. |
The market is expected to be driven by increasing demand for the product in electronic applications owing to its increased surface area at the time of application coupled with its high superparamagnetic properties. The application of nanomaterials is also increasing in the medical industry on account of the utilization of products in various in-vitro and in vivo applications. The rising investment by various research laboratories and biomedical industries for increasing product penetration in targeted drug delivery, gene therapy, and treatment of malignant tumors is expected to boost the growth of the nanomaterials market growth.
The raw materials required to produce nanomaterials vary with different manufacturing processes applied for the production. Raw materials, rare earth metals, alloys, polymers, and composites are either supplied to commercial manufacturers or research laboratories. AppliChem GmbH and Bernd Kraft GmbH are among the major suppliers in the market that provide the required raw materials. The nanomaterials market is quite fragmented, and companies focus on certain types of nanomaterials as well as applications. The major companies are consistently concentrated on research and development (R&D) for product alteration and capacity growth, as well as collaboration with local or regional distributors and manufacturers.
The nanomaterials market in the U.S. is expected to grow due to the growing R&D activities within the country. The U.S. government invests effectively in nanotechnology with the motive of becoming a global power and to lead technological development across the world. It coordinates with 20 government agencies through the National Nanotechnology Initiative (NNI)-an R&D initiative of the U.S. government that combines federal departments and agencies with interests in nanomaterials research, development, and commercialization. Strict regulations in North America and Europe are projected to hinder the growth in these regions.
Regulatory authorities such as the Food and Drug Administration, the U.S. Environmental Protection Agency, and the Health and Consumer Protection Directorate are looking into the harmful impacts of nanoparticles on human health and the environment. A wide range of thermo-chemical methods is used to synthesize nanoparticles, which can be categorized as either surfactant or polymer-assisted precipitation reactions and co-precipitation reactions. Major methods used for the synthesis of nanoparticles include co-precipitation, reverse micelle, copolymer template, and ion exchange resin.
Key Companies & Market Share Insights
The key players operating in the global nanomaterials market include American Elements, BASF SE, Cabot Corporation, AkzoNobel, and Frontier Carbon Corporation. Prominent players have been utilizing different business strategies such as collaborations, business expansion, product development, and mergers and acquisitions.
Companies in the market focus on certain types of nanomaterials as well as applications. Additionally, they have been focusing on R&D for capacity growth and product innovation, as well as coordination with local or regional distributors and manufacturers. Some of the key players operating in the global nanomaterials market include:
Nanomaterials Market Segmentations:
| By Product | By Application |
|
Gold (Au) Silver (Ag) Iron (Fe) Copper (Cu) Platinum (Pt) Titanium (Ti) Nickel (Ni) Aluminum Oxide Antimony Tin Oxide Bismuth Oxide Carbon Nanotubes Other Nanomaterials |
Aerospace Automotive Medical Energy & power Electronics Paints & Coatings Other |
Chapter 1. Introduction
1.1. Research Objective
1.2. Scope of the Study
1.3. Definition
Chapter 2. Research Methodology
2.1. Research Approach
2.2. Data Sources
2.3. Assumptions & Limitations
Chapter 3. Executive Summary
3.1. Market Snapshot
Chapter 4. Market Variables and Scope
4.1. Introduction
4.2. Market Classification and Scope
4.3. Industry Value Chain Analysis
4.3.1. Raw Material Procurement Analysis
4.3.2. Sales and Distribution Channel Analysis
4.3.3. Downstream Buyer Analysis
Chapter 5. COVID 19 Impact on Nanomaterials Market
5.1. COVID-19 Landscape: Nanomaterials Industry Impact
5.2. COVID 19 - Impact Assessment for the Industry
5.3. COVID 19 Impact: Global Major Government Policy
5.4. Market Trends and Opportunities in the COVID-19 Landscape
Chapter 6. Market Dynamics Analysis and Trends
6.1. Market Dynamics
6.1.1. Market Drivers
6.1.2. Market Restraints
6.1.3. Market Opportunities
6.2. Porter’s Five Forces Analysis
6.2.1. Bargaining power of suppliers
6.2.2. Bargaining power of buyers
6.2.3. Threat of substitute
6.2.4. Threat of new entrants
6.2.5. Degree of competition
Chapter 7. Competitive Landscape
7.1.1. Company Market Share/Positioning Analysis
7.1.2. Key Strategies Adopted by Players
7.1.3. Vendor Landscape
7.1.3.1. List of Suppliers
7.1.3.2. List of Buyers
Chapter 8. Global Nanomaterials Market, By Product
8.1. Nanomaterials Market, by Product, 2023-2032
8.1.1. Gold (Au)
8.1.1.1. Market Revenue and Forecast (2020-2032)
8.1.2. Silver (Ag)
8.1.2.1. Market Revenue and Forecast (2020-2032)
8.1.3. Iron (Fe)
8.1.3.1. Market Revenue and Forecast (2020-2032)
8.1.4. Copper (Cu)
8.1.4.1. Market Revenue and Forecast (2020-2032)
8.1.5. Platinum (Pt)
8.1.5.1. Market Revenue and Forecast (2020-2032)
8.1.6. Titanium (Ti)
8.1.6.1. Market Revenue and Forecast (2020-2032)
8.1.7. Nickel (Ni)
8.1.7.1. Market Revenue and Forecast (2020-2032)
8.1.8. Aluminum Oxide
8.1.8.1. Market Revenue and Forecast (2020-2032)
8.1.9. Antimony Tin Oxide
8.1.9.1. Market Revenue and Forecast (2020-2032)
8.1.10. Bismuth Oxide
8.1.10.1. Market Revenue and Forecast (2020-2032)
8.1.11. Carbon Nanotubes
8.1.11.1. Market Revenue and Forecast (2020-2032)
8.1.12. Other Nanomaterials
8.1.12.1. Market Revenue and Forecast (2020-2032)
Chapter 9. Global Nanomaterials Market, By Application
9.1. Nanomaterials Market, by Application, 2023-2032
9.1.1. Aerospace
9.1.1.1. Market Revenue and Forecast (2020-2032)
9.1.2. Automotive
9.1.2.1. Market Revenue and Forecast (2020-2032)
9.1.3. Medical
9.1.3.1. Market Revenue and Forecast (2020-2032)
9.1.4. Energy & power
9.1.4.1. Market Revenue and Forecast (2020-2032)
9.1.5. Electronics
9.1.5.1. Market Revenue and Forecast (2020-2032)
9.1.6. Paints & Coatings
9.1.6.1. Market Revenue and Forecast (2020-2032)
9.1.7. Other
9.1.7.1. Market Revenue and Forecast (2020-2032)
Chapter 10. Global Nanomaterials Market, Regional Estimates and Trend Forecast
10.1. North America
10.1.1. Market Revenue and Forecast, by Product (2020-2032)
10.1.2. Market Revenue and Forecast, by Application (2020-2032)
10.1.3. U.S.
10.1.3.1. Market Revenue and Forecast, by Product (2020-2032)
10.1.3.2. Market Revenue and Forecast, by Application (2020-2032)
10.1.4. Rest of North America
10.1.4.1. Market Revenue and Forecast, by Product (2020-2032)
10.1.4.2. Market Revenue and Forecast, by Application (2020-2032)
10.2. Europe
10.2.1. Market Revenue and Forecast, by Product (2020-2032)
10.2.2. Market Revenue and Forecast, by Application (2020-2032)
10.2.3. UK
10.2.3.1. Market Revenue and Forecast, by Product (2020-2032)
10.2.3.2. Market Revenue and Forecast, by Application (2020-2032)
10.2.4. Germany
10.2.4.1. Market Revenue and Forecast, by Product (2020-2032)
10.2.4.2. Market Revenue and Forecast, by Application (2020-2032)
10.2.5. France
10.2.5.1. Market Revenue and Forecast, by Product (2020-2032)
10.2.5.2. Market Revenue and Forecast, by Application (2020-2032)
10.2.6. Rest of Europe
10.2.6.1. Market Revenue and Forecast, by Product (2020-2032)
10.2.6.2. Market Revenue and Forecast, by Application (2020-2032)
10.3. APAC
10.3.1. Market Revenue and Forecast, by Product (2020-2032)
10.3.2. Market Revenue and Forecast, by Application (2020-2032)
10.3.3. India
10.3.3.1. Market Revenue and Forecast, by Product (2020-2032)
10.3.3.2. Market Revenue and Forecast, by Application (2020-2032)
10.3.4. China
10.3.4.1. Market Revenue and Forecast, by Product (2020-2032)
10.3.4.2. Market Revenue and Forecast, by Application (2020-2032)
10.3.5. Japan
10.3.5.1. Market Revenue and Forecast, by Product (2020-2032)
10.3.5.2. Market Revenue and Forecast, by Application (2020-2032)
10.3.6. Rest of APAC
10.3.6.1. Market Revenue and Forecast, by Product (2020-2032)
10.3.6.2. Market Revenue and Forecast, by Application (2020-2032)
10.4. MEA
10.4.1. Market Revenue and Forecast, by Product (2020-2032)
10.4.2. Market Revenue and Forecast, by Application (2020-2032)
10.4.3. GCC
10.4.3.1. Market Revenue and Forecast, by Product (2020-2032)
10.4.3.2. Market Revenue and Forecast, by Application (2020-2032)
10.4.4. North Africa
10.4.4.1. Market Revenue and Forecast, by Product (2020-2032)
10.4.4.2. Market Revenue and Forecast, by Application (2020-2032)
10.4.5. South Africa
10.4.5.1. Market Revenue and Forecast, by Product (2020-2032)
10.4.5.2. Market Revenue and Forecast, by Application (2020-2032)
10.4.6. Rest of MEA
10.4.6.1. Market Revenue and Forecast, by Product (2020-2032)
10.4.6.2. Market Revenue and Forecast, by Application (2020-2032)
10.5. Latin America
10.5.1. Market Revenue and Forecast, by Product (2020-2032)
10.5.2. Market Revenue and Forecast, by Application (2020-2032)
10.5.3. Brazil
10.5.3.1. Market Revenue and Forecast, by Product (2020-2032)
10.5.3.2. Market Revenue and Forecast, by Application (2020-2032)
10.5.4. Rest of LATAM
10.5.4.1. Market Revenue and Forecast, by Product (2020-2032)
10.5.4.2. Market Revenue and Forecast, by Application (2020-2032)
Chapter 11. Company Profiles
11.1. Strem Chemicals, Inc.
11.1.1. Company Overview
11.1.2. Product Offerings
11.1.3. Financial Performance
11.1.4. Recent Initiatives
11.2. American Elements
11.2.1. Company Overview
11.2.2. Product Offerings
11.2.3. Financial Performance
11.2.4. Recent Initiatives
11.3. US Research Nanomaterials, Inc.
11.3.1. Company Overview
11.3.2. Product Offerings
11.3.3. Financial Performance
11.3.4. Recent Initiatives
11.4. Nanocomposix, Inc.
11.4.1. Company Overview
11.4.2. Product Offerings
11.4.3. Financial Performance
11.4.4. LTE Scientific
11.5. Frontier Carbon Corporation
11.5.1. Company Overview
11.5.2. Product Offerings
11.5.3. Financial Performance
11.5.4. Recent Initiatives
11.6. Nanoshel LLC
11.6.1. Company Overview
11.6.2. Product Offerings
11.6.3. Financial Performance
11.6.4. Recent Initiatives
11.7. SkySpring Nanomaterials, Inc.
11.7.1. Company Overview
11.7.2. Product Offerings
11.7.3. Financial Performance
11.7.4. Recent Initiatives
11.8. Nanophase Technologies Corporation
11.8.1. Company Overview
11.8.2. Product Offerings
11.8.3. Financial Performance
11.8.4. Recent Initiatives
11.9. Cytodiagnostics, Inc.
11.9.1. Company Overview
11.9.2. Product Offerings
11.9.3. Financial Performance
11.9.4. Recent Initiatives
11.10. Quantum Materials Corp.
11.10.1. Company Overview
11.10.2. Product Offerings
11.10.3. Financial Performance
11.10.4. Recent Initiatives
Chapter 12. Research Methodology
12.1. Primary Research
12.2. Secondary Research
12.3. Assumptions
Chapter 13. Appendix
13.1. About Us
13.2. Glossary of Terms
 Cross-segment Market Size and Analysis for
Mentioned Segments
Additional Company Profiles (Upto 5 With No Cost)
Additional Countries (Apart From Mentioned Countries)
Country/Region-specific Report
Go To Market Strategy
Region Specific Market DynamicsRegion Level Market Share Import Export AnalysisProduction AnalysisOthers
Cross-segment Market Size and Analysis for
Mentioned Segments
Additional Company Profiles (Upto 5 With No Cost)
Additional Countries (Apart From Mentioned Countries)
Country/Region-specific Report
Go To Market Strategy
Region Specific Market DynamicsRegion Level Market Share Import Export AnalysisProduction AnalysisOthers