Nanotechnology Market Size, Growth, Trends | Report 2022-2032
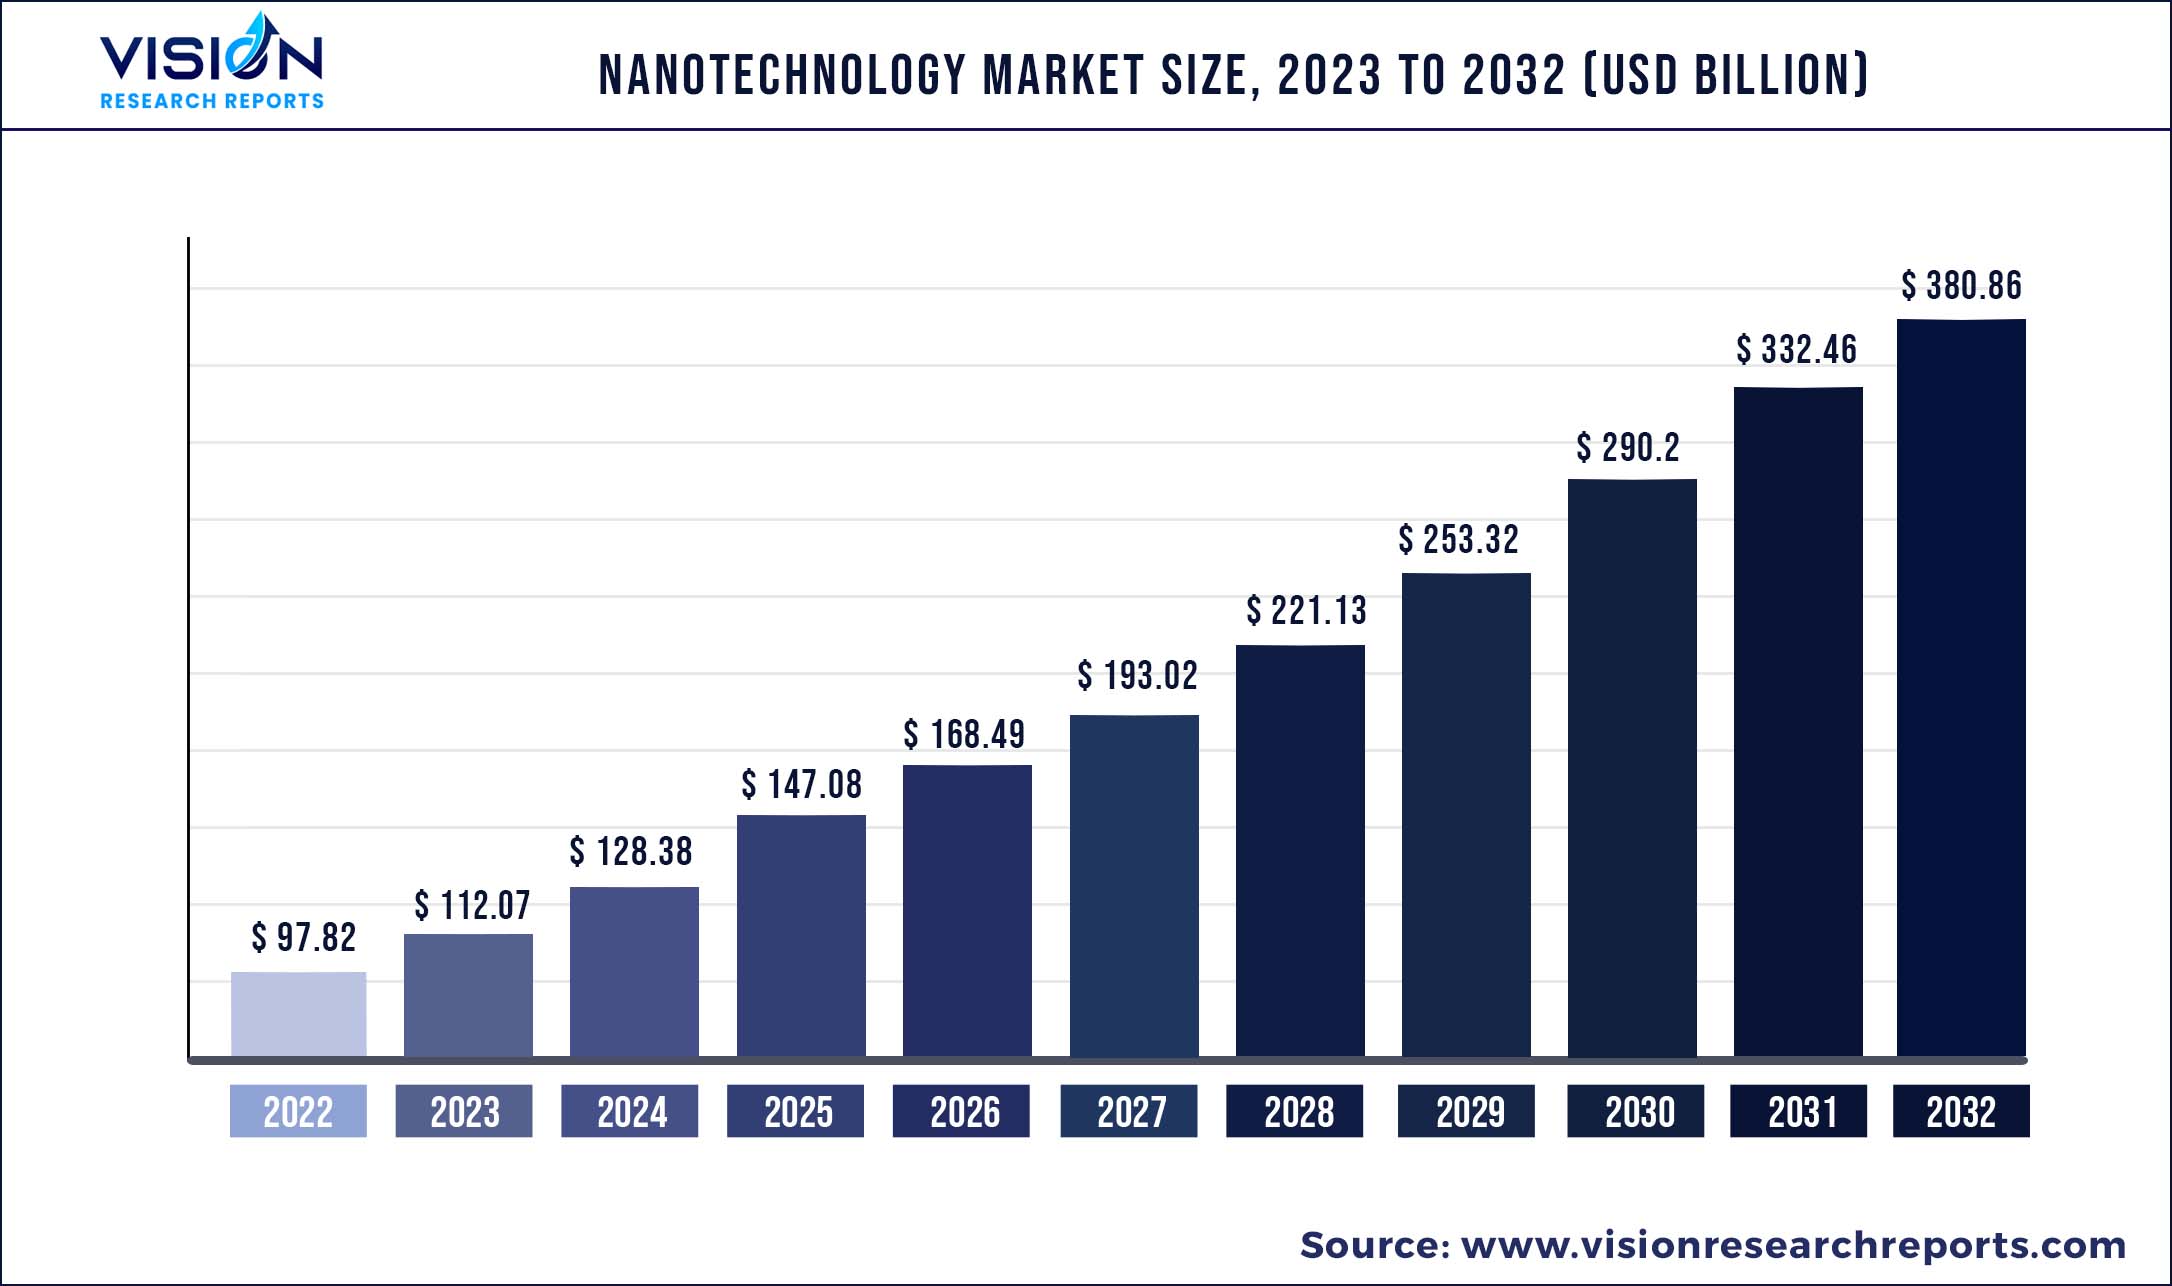
The global nanotechnology market was surpassed at USD 97.82 billion in 2022 and is expected to hit around USD 380.86 billion by 2032, growing at a CAGR of 14.56% from 2023 to 2032.
Key Pointers
Report Scope of the Nanotechnology Market
| Report Coverage | Details |
| Market Size in 2022 | USD 97.82 billion |
| Revenue Forecast by 2032 | USD 380.86 billion |
| Growth rate from 2023 to 2032 | CAGR of 14.56% |
| Base Year | 2022 |
| Forecast Period | 2023 to 2032 |
| Regions Covered | North America, Europe, Asia Pacific, Latin America, Middle East & Africa |
| Companies Covered | Showa Denko KK, BASF SE,Pen Inc., Nanosys Inc., QD vision, Arkema, 3rd Tech Inc., ApNano Materials, ELITechGroup, Bruker Nano GmbH, QuantumSphere Inc. |
Nanotechnology is the area of science and engineering concerned with designing, manufacturing, and deploying structures, devices, and systems by manipulating atoms and molecules at the nanoscale. Nanotechnology can provide significant advantages in terms of its application in emergency viral diseases, where phenomena that take place at dimensions in the nanometre scale are utilised in the design, characterisation, production and application of materials, structures, devices and systems.
The main types of nanotechnology services are research and development, information tracking, technology scouting, standardization, regulatory briefings, and others. R&D is a process that aims to create new or improved technology that can provide a competitive advantage at the business, industry, or national levels. The services are used by various industries, including pharmaceuticals, medical equipment, food and beverages, IT, and others. The different providers include large enterprises as well as small and medium-sized enterprises.
The nanotechnology services market research report is one of a series of new reports from The Business Research Company that provides nanotechnology services market statistics, including nanotechnology services industry global market size, regional shares, competitors with a nanotechnology services market share, detailed nanotechnology services market segments, market trends and opportunities, and any further data you may need to thrive in the nanotechnology services industry. This nanotechnology services market research report delivers a complete perspective of everything you need, with an in-depth analysis of the current and future state of the industry.
The rise in investments from governments and companies in the field of nanotechnology has contributed to the growth of the nanotechnology services market. For instance, the investments under the National Nanotechnology Initiative (NNI) in US, a President’s 2021 Budget requested over $1.7 billion for the National Nanotechnology Initiative. Similarly, in 2020, National Institutes of Health (NIH), invested around $445 million in nanomedicine. The portal, Invest In Nano, debuted with a 2020 programme that would kick off a mission to connect breakthrough nanotechnology companies with investors. The rise in investments from governments and companies in the field of nanotechnology drove the nanotechnology services market.
The high cost of nanomaterials is expected to limit the nanotechnology services market. Nanoparticles are tiny particles that are smaller than the width of a strand of hair, and they can be found in a wide range of products, from drug-delivery devices to high-definition televisions. For instance, one milligramme of gold nanoparticles costs about $80, and for a gramme of gold nanoparticles, it is around $80,000. Nanotechnology is an expensive area of research and only developed nations have the resources to invest in it. The high cost of nanomaterials negatively impacts the nanotechnology services market as it discourages end-users from seeking services.
The companies in the nanotechnology services market are focusing on its increasing application in the healthcare industry. Nanotechnology services can be used to innovate new generation of diagnostic and therapeutic modalities for important diseases. The Eyecirque range consists of the nanotechnology-based gel serum, under-eye skin brightening and anti-ageing tablets, lubricating eye drops and essential eye supplements.
Nanotechnology Market Segmentations:
| By Product | By Application |
|
Nanotubes Nanocomposites Nano Clays Nano Materials Nano Particles Nano Devices Nano Tools Others |
Automotive Medical Electronics Aerospace Energy & Power Paints and Coatings Others |
Chapter 1. Introduction
1.1. Research Objective
1.2. Scope of the Study
1.3. Definition
Chapter 2. Research Methodology
2.1. Research Approach
2.2. Data Sources
2.3. Assumptions & Limitations
Chapter 3. Executive Summary
3.1. Market Snapshot
Chapter 4. Market Variables and Scope
4.1. Introduction
4.2. Market Classification and Scope
4.3. Industry Value Chain Analysis
4.3.1. Raw Material Procurement Analysis
4.3.2. Sales and Distribution Channel Analysis
4.3.3. Downstream Buyer Analysis
Chapter 5. COVID 19 Impact on Nanotechnology Market
5.1. COVID-19 Landscape: Nanotechnology Industry Impact
5.2. COVID 19 - Impact Assessment for the Industry
5.3. COVID 19 Impact: Global Major Government Policy
5.4. Market Trends and Opportunities in the COVID-19 Landscape
Chapter 6. Market Dynamics Analysis and Trends
6.1. Market Dynamics
6.1.1. Market Drivers
6.1.2. Market Restraints
6.1.3. Market Opportunities
6.2. Porter’s Five Forces Analysis
6.2.1. Bargaining power of suppliers
6.2.2. Bargaining power of buyers
6.2.3. Threat of substitute
6.2.4. Threat of new entrants
6.2.5. Degree of competition
Chapter 7. Competitive Landscape
7.1.1. Company Market Share/Positioning Analysis
7.1.2. Key Strategies Adopted by Players
7.1.3. Vendor Landscape
7.1.3.1. List of Suppliers
7.1.3.2. List of Buyers
Chapter 8. Global Nanotechnology Market, By Product
8.1. Nanotechnology Market, by Product, 2023-2032
8.1.1. Nanotubes
8.1.1.1. Market Revenue and Forecast (2020-2032)
8.1.2. Nanocomposites
8.1.2.1. Market Revenue and Forecast (2020-2032)
8.1.3. Nano Clays
8.1.3.1. Market Revenue and Forecast (2020-2032)
8.1.4. Nano Materials
8.1.4.1. Market Revenue and Forecast (2020-2032)
8.1.5. Nano Particles
8.1.5.1. Market Revenue and Forecast (2020-2032)
8.1.6. Nano Devices
8.1.6.1. Market Revenue and Forecast (2020-2032)
8.1.7. Nano Tools
8.1.7.1. Market Revenue and Forecast (2020-2032)
8.1.8. Others
8.1.8.1. Market Revenue and Forecast (2020-2032)
Chapter 9. Global Nanotechnology Market, By Application
9.1. Nanotechnology Market, by Application, 2023-2032
9.1.1. Automotive
9.1.1.1. Market Revenue and Forecast (2020-2032)
9.1.2. Medical
9.1.2.1. Market Revenue and Forecast (2020-2032)
9.1.3. Electronics
9.1.3.1. Market Revenue and Forecast (2020-2032)
9.1.4. Aerospace
9.1.4.1. Market Revenue and Forecast (2020-2032)
9.1.5. Energy & Power
9.1.5.1. Market Revenue and Forecast (2020-2032)
9.1.6. Paints and Coatings
9.1.6.1. Market Revenue and Forecast (2020-2032)
9.1.7. Others
9.1.7.1. Market Revenue and Forecast (2020-2032)
Chapter 10. Global Nanotechnology Market, Regional Estimates and Trend Forecast
10.1. North America
10.1.1. Market Revenue and Forecast, by Product (2020-2032)
10.1.2. Market Revenue and Forecast, by Application (2020-2032)
10.1.3. U.S.
10.1.3.1. Market Revenue and Forecast, by Product (2020-2032)
10.1.3.2. Market Revenue and Forecast, by Application (2020-2032)
10.1.4. Rest of North America
10.1.4.1. Market Revenue and Forecast, by Product (2020-2032)
10.1.4.2. Market Revenue and Forecast, by Application (2020-2032)
10.2. Europe
10.2.1. Market Revenue and Forecast, by Product (2020-2032)
10.2.2. Market Revenue and Forecast, by Application (2020-2032)
10.2.3. UK
10.2.3.1. Market Revenue and Forecast, by Product (2020-2032)
10.2.3.2. Market Revenue and Forecast, by Application (2020-2032)
10.2.4. Germany
10.2.4.1. Market Revenue and Forecast, by Product (2020-2032)
10.2.4.2. Market Revenue and Forecast, by Application (2020-2032)
10.2.5. France
10.2.5.1. Market Revenue and Forecast, by Product (2020-2032)
10.2.5.2. Market Revenue and Forecast, by Application (2020-2032)
10.2.6. Rest of Europe
10.2.6.1. Market Revenue and Forecast, by Product (2020-2032)
10.2.6.2. Market Revenue and Forecast, by Application (2020-2032)
10.3. APAC
10.3.1. Market Revenue and Forecast, by Product (2020-2032)
10.3.2. Market Revenue and Forecast, by Application (2020-2032)
10.3.3. India
10.3.3.1. Market Revenue and Forecast, by Product (2020-2032)
10.3.3.2. Market Revenue and Forecast, by Application (2020-2032)
10.3.4. China
10.3.4.1. Market Revenue and Forecast, by Product (2020-2032)
10.3.4.2. Market Revenue and Forecast, by Application (2020-2032)
10.3.5. Japan
10.3.5.1. Market Revenue and Forecast, by Product (2020-2032)
10.3.5.2. Market Revenue and Forecast, by Application (2020-2032)
10.3.6. Rest of APAC
10.3.6.1. Market Revenue and Forecast, by Product (2020-2032)
10.3.6.2. Market Revenue and Forecast, by Application (2020-2032)
10.4. MEA
10.4.1. Market Revenue and Forecast, by Product (2020-2032)
10.4.2. Market Revenue and Forecast, by Application (2020-2032)
10.4.3. GCC
10.4.3.1. Market Revenue and Forecast, by Product (2020-2032)
10.4.3.2. Market Revenue and Forecast, by Application (2020-2032)
10.4.4. North Africa
10.4.4.1. Market Revenue and Forecast, by Product (2020-2032)
10.4.4.2. Market Revenue and Forecast, by Application (2020-2032)
10.4.5. South Africa
10.4.5.1. Market Revenue and Forecast, by Product (2020-2032)
10.4.5.2. Market Revenue and Forecast, by Application (2020-2032)
10.4.6. Rest of MEA
10.4.6.1. Market Revenue and Forecast, by Product (2020-2032)
10.4.6.2. Market Revenue and Forecast, by Application (2020-2032)
10.5. Latin America
10.5.1. Market Revenue and Forecast, by Product (2020-2032)
10.5.2. Market Revenue and Forecast, by Application (2020-2032)
10.5.3. Brazil
10.5.3.1. Market Revenue and Forecast, by Product (2020-2032)
10.5.3.2. Market Revenue and Forecast, by Application (2020-2032)
10.5.4. Rest of LATAM
10.5.4.1. Market Revenue and Forecast, by Product (2020-2032)
10.5.4.2. Market Revenue and Forecast, by Application (2020-2032)
Chapter 11. Company Profiles
11.1. Showa Denko KK
11.1.1. Company Overview
11.1.2. Product Offerings
11.1.3. Financial Performance
11.1.4. Recent Initiatives
11.2. BASF SE
11.2.1. Company Overview
11.2.2. Product Offerings
11.2.3. Financial Performance
11.2.4. Recent Initiatives
11.3. Pen Inc.
11.3.1. Company Overview
11.3.2. Product Offerings
11.3.3. Financial Performance
11.3.4. Recent Initiatives
11.4. Nanosys Inc.
11.4.1. Company Overview
11.4.2. Product Offerings
11.4.3. Financial Performance
11.4.4. LTE Scientific
11.5. QD vision
11.5.1. Company Overview
11.5.2. Product Offerings
11.5.3. Financial Performance
11.5.4. Recent Initiatives
11.6. Arkema
11.6.1. Company Overview
11.6.2. Product Offerings
11.6.3. Financial Performance
11.6.4. Recent Initiatives
11.7. 3rd Tech Inc.
11.7.1. Company Overview
11.7.2. Product Offerings
11.7.3. Financial Performance
11.7.4. Recent Initiatives
11.8. ApNano Materials
11.8.1. Company Overview
11.8.2. Product Offerings
11.8.3. Financial Performance
11.8.4. Recent Initiatives
11.9. ELITechGroup
11.9.1. Company Overview
11.9.2. Product Offerings
11.9.3. Financial Performance
11.9.4. Recent Initiatives
11.10. Bruker Nano GmbH
11.10.1. Company Overview
11.10.2. Product Offerings
11.10.3. Financial Performance
11.10.4. Recent Initiatives
Chapter 12. Research Methodology
12.1. Primary Research
12.2. Secondary Research
12.3. Assumptions
Chapter 13. Appendix
13.1. About Us
13.2. Glossary of Terms
 Cross-segment Market Size and Analysis for
Mentioned Segments
Additional Company Profiles (Upto 5 With No Cost)
Additional Countries (Apart From Mentioned Countries)
Country/Region-specific Report
Go To Market Strategy
Region Specific Market DynamicsRegion Level Market Share Import Export AnalysisProduction AnalysisOthers
Cross-segment Market Size and Analysis for
Mentioned Segments
Additional Company Profiles (Upto 5 With No Cost)
Additional Countries (Apart From Mentioned Countries)
Country/Region-specific Report
Go To Market Strategy
Region Specific Market DynamicsRegion Level Market Share Import Export AnalysisProduction AnalysisOthers