Natural Language Processing Market Size, Share, Growth, Trends | Report 2023-2032
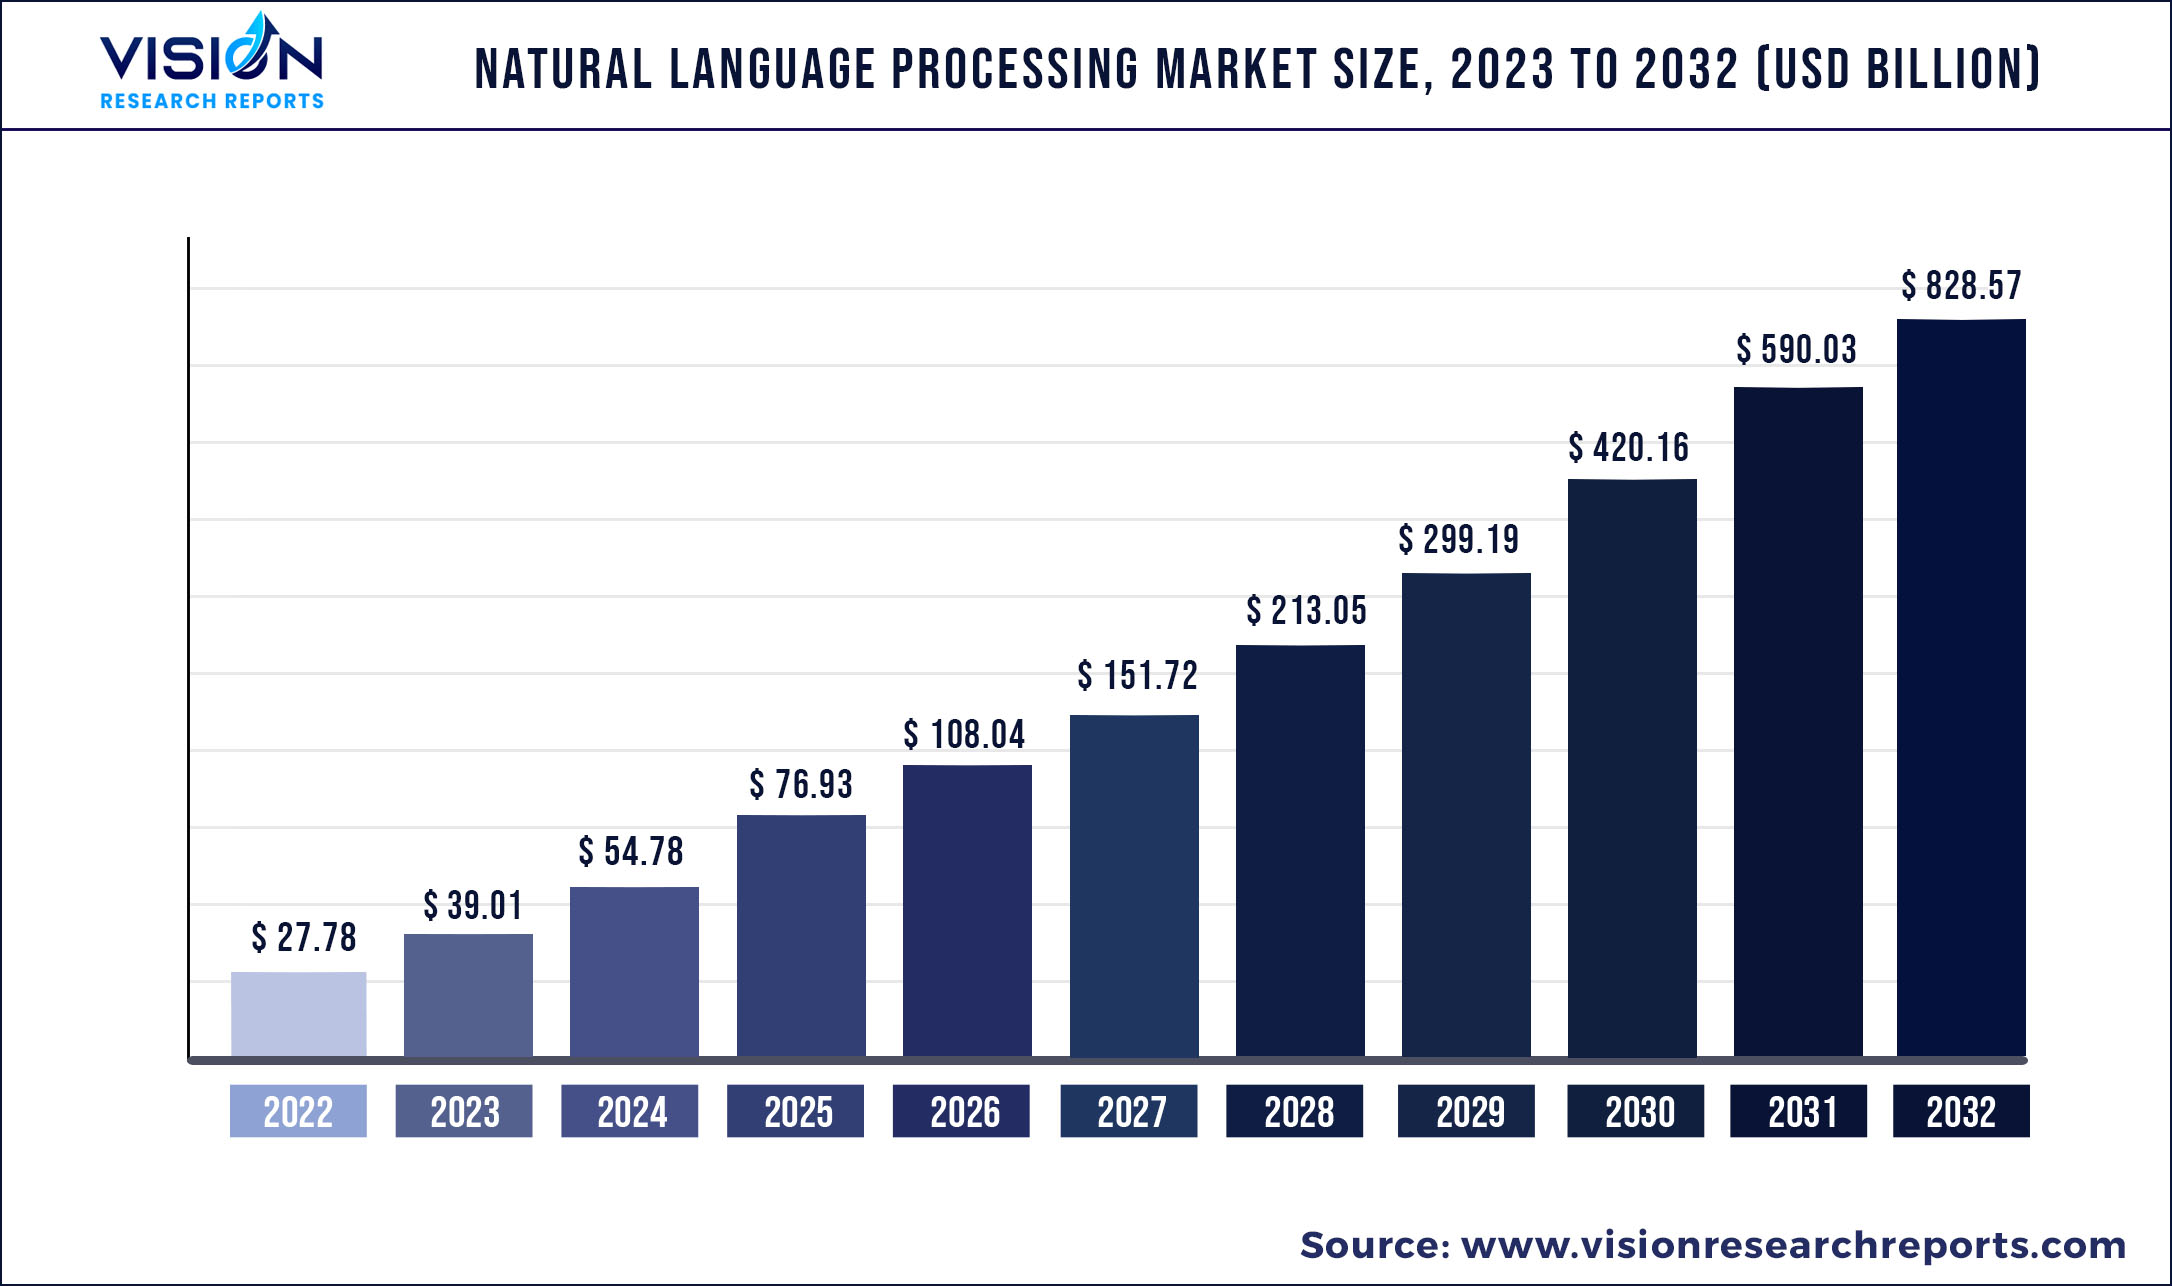
The global natural language processing market size was estimated at around USD 27.78 billion in 2022 and it is projected to hit around USD 828.57 billion by 2032, growing at a CAGR of 40.43% from 2023 to 2032.
Key Pointers
| Report Coverage | Details |
| Market Size in 2022 | USD 27.78 billion |
| Revenue Forecast by 2032 | USD 828.57 billion |
| Growth rate from 2023 to 2032 | CAGR of 40.43% |
| Base Year | 2022 |
| Forecast Period | 2023 to 2032 |
| Regions Covered | North America, Europe, Asia Pacific, Latin America, Middle East & Africa |
| Companies Covered | 3M; Apple; AWS; Baidu; Google LLC; IBM Corporation; Meta; Microsoft; Oracle Inc.; Inbenta; IQVIA |
Natural language processing (NLP) is a prominent component of artificial intelligence, it has applications in consumer chatbots and digital assistants and commercial applications like sentiment analysis, text analysis, voice sense (speech analysis), and change effect analysis. The NLP market is witnessing rapid growth owing to the rapid acceptance of novel technology advancements. Additionally, the growing requirement for data management and increased complexity in major businesses is also fostering the growth of the industry.
Increased customer demands for cloud-based technology and advancements in communication infrastructure are accelerating market growth. NLP is the interface between humans and machines, and it comprises executing computer programs and analyzing data. Low cost, high scalability, and high usage of smart devices across industries are expected to contribute to the industry’s expansion over the forecast period. Moreover, the expansion of the e-commerce industry and perception of online sales channels is projected to ascend the demand for NLP for enhancing consumer experience through personal attention and query handling.
Increasing demand for sentiment analytics and content management is augmenting the market expansion. Businesses can utilize sentiment analytics to offer their clients customized deals and discounts based on previous trends. Sentiment analytics is essential for examining consumer behavior and gauging the type of consumers. Moreover, Social media platforms are used by the retail and e-commerce industries because they are a major source of data for sentiment analytics, the anticipation of demand and supply, and enhancement in the consumer experience.
The global COVID-19 outbreak has significantly impacted businesses worldwide. However, the COVID-19 pandemic has positively influenced the adoption of NLP-based services due to the nationwide lockdowns imposed by governments in countries across the globe. Post-COVID-19, enterprises are focused on cutting-edge technology to undertake contactless operations, including artificial intelligence (AI), machine learning (ML), analytics, and computing technology, across industries like BFSI, healthcare, IT, & telecommunication. This contributes to the demand for Al-driven NLP technology, which propels the global natural language processing (NLP) market growth.
Regional Insights
North America is estimated to hold the largest revenue share of 30.77% in 2022. The region dominates AI and machine learning technologies, making it one of the key marketplaces for natural language processing technologies. Further, the prevalence of key market participants in the U.S. drives innovation in the region subsequently fueling the natural language processing market growth. Regional governments are also increasingly encouraging the use of AI, ML, and NLP technologies, which is allowing market participants to expand their presence in the region.
Asia Pacific is projected to expand at the highest CAGR of 42.71% during the forecast period. The growth is attributable to increasing smartphone usage, rapid technological advancements, the digitalization of economies, and government initiatives in developing countries from the region. Furthermore, this region holds leading positions in cutting-edge industries like robotics and has a strong IT infrastructure, software, and service offerings. These factors would create profitable growth prospects for the market.
Natural Language Processing Market Segmentations:
| By Component | By Deployment | By Enterprise Size |
|
Solution Services |
Cloud On-Premises |
Large Enterprises Small & Medium Enterprises |
| By Type | By Application | By End-use |
|
Statistical NLP Rule Based NLP Hybrid NLP |
Sentiment Analysis Data Extraction Risk And Threat Detection Automatic Summarization Content Management Language Scoring Others (Portfolio Monitoring, HR & Recruiting, And Branding & Advertising) |
BFSI IT & Telecommunication Healthcare Education Media & Entertainment Retail & E-commerce Others |
Chapter 1. Introduction
1.1. Research Objective
1.2. Scope of the Study
1.3. Definition
Chapter 2. Research Methodology
2.1. Research Approach
2.2. Data Sources
2.3. Assumptions & Limitations
Chapter 3. Executive Summary
3.1. Market Snapshot
Chapter 4. Market Variables and Scope
4.1. Introduction
4.2. Market Classification and Scope
4.3. Industry Value Chain Analysis
4.3.1. End-use Procurement Analysis
4.3.2. Sales and Distribution Analysis
4.3.3. Downstream Buyer Analysis
Chapter 5. COVID 19 Impact on Natural Language Processing Market
5.1. COVID-19 Landscape: Natural Language Processing Industry Impact
5.2. COVID 19 - Impact Assessment for the Industry
5.3. COVID 19 Impact: Global Major Government Policy
5.4. Market Trends and Opportunities in the COVID-19 Landscape
Chapter 6. Market Dynamics Analysis and Trends
6.1. Market Dynamics
6.1.1. Market Drivers
6.1.2. Market Restraints
6.1.3. Market Opportunities
6.2. Porter’s Five Forces Analysis
6.2.1. Bargaining power of suppliers
6.2.2. Bargaining power of buyers
6.2.3. Threat of substitute
6.2.4. Threat of new entrants
6.2.5. Degree of competition
Chapter 7. Competitive Landscape
7.1.1. Company Market Share/Positioning Analysis
7.1.2. Key Strategies Adopted by Players
7.1.3. Vendor Landscape
7.1.3.1. List of Suppliers
7.1.3.2. List of Buyers
Chapter 8. Global Natural Language Processing Market, By Component
8.1. Natural Language Processing Market, by Component, 2023-2032
8.1.1. Solution
8.1.1.1. Market Revenue and Forecast (2020-2032)
8.1.2. Services
8.1.2.1. Market Revenue and Forecast (2020-2032)
Chapter 9. Global Natural Language Processing Market, By Deployment
9.1. Natural Language Processing Market, by Deployment, 2023-2032
9.1.1. Cloud
9.1.1.1. Market Revenue and Forecast (2020-2032)
9.1.2. On-Premises
9.1.2.1. Market Revenue and Forecast (2020-2032)
Chapter 10. Global Natural Language Processing Market, By Enterprise Size
10.1. Natural Language Processing Market, by Enterprise Size, 2023-2032
10.1.1. Large Enterprises
10.1.1.1. Market Revenue and Forecast (2020-2032)
10.1.2. Small & Medium Enterprises
10.1.2.1. Market Revenue and Forecast (2020-2032)
Chapter 11. Global Natural Language Processing Market, By Type
11.1. Natural Language Processing Market, by Type, 2023-2032
11.1.1. Statistical NLP
11.1.1.1. Market Revenue and Forecast (2020-2032)
11.1.2. Rule Based NLP
11.1.2.1. Market Revenue and Forecast (2020-2032)
11.1.3. Hybrid NLP
11.1.3.1. Market Revenue and Forecast (2020-2032)
Chapter 12. Global Natural Language Processing Market, By Application
12.1. Natural Language Processing Market, by Application, 2023-2032
12.1.1. Sentiment Analysis
12.1.1.1. Market Revenue and Forecast (2020-2032)
12.1.2. Data Extraction
12.1.2.1. Market Revenue and Forecast (2020-2032)
12.1.3. Risk And Threat Detection
12.1.3.1. Market Revenue and Forecast (2020-2032)
12.1.4. Automatic Summarization
12.1.4.1. Market Revenue and Forecast (2020-2032)
12.1.5. Content Management
12.1.5.1. Market Revenue and Forecast (2020-2032)
12.1.6. Language Scoring
12.1.6.1. Market Revenue and Forecast (2020-2032)
12.1.7. Others (Portfolio Monitoring, HR & Recruiting, And Branding & Advertising)
12.1.7.1. Market Revenue and Forecast (2020-2032)
Chapter 13. Global Natural Language Processing Market, By End-use
13.1. Natural Language Processing Market, by End-use, 2023-2032
13.1.1. BFSI
13.1.1.1. Market Revenue and Forecast (2020-2032)
13.1.2. IT & Telecommunication
13.1.2.1. Market Revenue and Forecast (2020-2032)
13.1.3. Healthcare
13.1.3.1. Market Revenue and Forecast (2020-2032)
13.1.4. Education
13.1.4.1. Market Revenue and Forecast (2020-2032)
13.1.5. Media & Entertainment
13.1.5.1. Market Revenue and Forecast (2020-2032)
13.1.6. Retail & E-commerce
13.1.6.1. Market Revenue and Forecast (2020-2032)
13.1.7. Others
13.1.7.1. Market Revenue and Forecast (2020-2032)
Chapter 14. Global Natural Language Processing Market, Regional Estimates and Trend Forecast
14.1. North America
14.1.1. Market Revenue and Forecast, by Component (2020-2032)
14.1.2. Market Revenue and Forecast, by Deployment (2020-2032)
14.1.3. Market Revenue and Forecast, by Enterprise Size (2020-2032)
14.1.4. Market Revenue and Forecast, by Type (2020-2032)
14.1.5. Market Revenue and Forecast, by Application (2020-2032)
14.1.6. Market Revenue and Forecast, by End-use (2020-2032)
14.1.7. U.S.
14.1.7.1. Market Revenue and Forecast, by Component (2020-2032)
14.1.7.2. Market Revenue and Forecast, by Deployment (2020-2032)
14.1.7.3. Market Revenue and Forecast, by Enterprise Size (2020-2032)
14.1.7.4. Market Revenue and Forecast, by Type (2020-2032)
14.1.8. Market Revenue and Forecast, by Application (2020-2032)
14.1.8.1. Market Revenue and Forecast, by End-use (2020-2032)
14.1.9. Rest of North America
14.1.9.1. Market Revenue and Forecast, by Component (2020-2032)
14.1.9.2. Market Revenue and Forecast, by Deployment (2020-2032)
14.1.9.3. Market Revenue and Forecast, by Enterprise Size (2020-2032)
14.1.9.4. Market Revenue and Forecast, by Type (2020-2032)
14.1.10. Market Revenue and Forecast, by Application (2020-2032)
14.1.11. Market Revenue and Forecast, by End-use (2020-2032)
14.1.11.1.
14.2. Europe
14.2.1. Market Revenue and Forecast, by Component (2020-2032)
14.2.2. Market Revenue and Forecast, by Deployment (2020-2032)
14.2.3. Market Revenue and Forecast, by Enterprise Size (2020-2032)
14.2.4. Market Revenue and Forecast, by Type (2020-2032)
14.2.5. Market Revenue and Forecast, by Application (2020-2032)
14.2.6. Market Revenue and Forecast, by End-use (2020-2032)
14.2.7.
14.2.8. UK
14.2.8.1. Market Revenue and Forecast, by Component (2020-2032)
14.2.8.2. Market Revenue and Forecast, by Deployment (2020-2032)
14.2.8.3. Market Revenue and Forecast, by Enterprise Size (2020-2032)
14.2.9. Market Revenue and Forecast, by Type (2020-2032)
14.2.10. Market Revenue and Forecast, by Application (2020-2032)
14.2.10.1. Market Revenue and Forecast, by End-use (2020-2032)
14.2.11. Germany
14.2.11.1. Market Revenue and Forecast, by Component (2020-2032)
14.2.11.2. Market Revenue and Forecast, by Deployment (2020-2032)
14.2.11.3. Market Revenue and Forecast, by Enterprise Size (2020-2032)
14.2.12. Market Revenue and Forecast, by Type (2020-2032)
14.2.13. Market Revenue and Forecast, by Application (2020-2032)
14.2.14. Market Revenue and Forecast, by End-use (2020-2032)
14.2.14.1.
14.2.15. France
14.2.15.1. Market Revenue and Forecast, by Component (2020-2032)
14.2.15.2. Market Revenue and Forecast, by Deployment (2020-2032)
14.2.15.3. Market Revenue and Forecast, by Enterprise Size (2020-2032)
14.2.15.4. Market Revenue and Forecast, by Type (2020-2032)
14.2.16. Market Revenue and Forecast, by Application (2020-2032)
14.2.16.1. Market Revenue and Forecast, by End-use (2020-2032)
14.2.17. Rest of Europe
14.2.17.1. Market Revenue and Forecast, by Component (2020-2032)
14.2.17.2. Market Revenue and Forecast, by Deployment (2020-2032)
14.2.17.3. Market Revenue and Forecast, by Enterprise Size (2020-2032)
14.2.17.4. Market Revenue and Forecast, by Type (2020-2032)
14.2.18. Market Revenue and Forecast, by Application (2020-2032)
14.2.18.1. Market Revenue and Forecast, by End-use (2020-2032)
14.3. APAC
14.3.1. Market Revenue and Forecast, by Component (2020-2032)
14.3.2. Market Revenue and Forecast, by Deployment (2020-2032)
14.3.3. Market Revenue and Forecast, by Enterprise Size (2020-2032)
14.3.4. Market Revenue and Forecast, by Type (2020-2032)
14.3.5. Market Revenue and Forecast, by Application (2020-2032)
14.3.6. Market Revenue and Forecast, by End-use (2020-2032)
14.3.7. India
14.3.7.1. Market Revenue and Forecast, by Component (2020-2032)
14.3.7.2. Market Revenue and Forecast, by Deployment (2020-2032)
14.3.7.3. Market Revenue and Forecast, by Enterprise Size (2020-2032)
14.3.7.4. Market Revenue and Forecast, by Type (2020-2032)
14.3.8. Market Revenue and Forecast, by Application (2020-2032)
14.3.9. Market Revenue and Forecast, by End-use (2020-2032)
14.3.10. China
14.3.10.1. Market Revenue and Forecast, by Component (2020-2032)
14.3.10.2. Market Revenue and Forecast, by Deployment (2020-2032)
14.3.10.3. Market Revenue and Forecast, by Enterprise Size (2020-2032)
14.3.10.4. Market Revenue and Forecast, by Type (2020-2032)
14.3.11. Market Revenue and Forecast, by Application (2020-2032)
14.3.11.1. Market Revenue and Forecast, by End-use (2020-2032)
14.3.12. Japan
14.3.12.1. Market Revenue and Forecast, by Component (2020-2032)
14.3.12.2. Market Revenue and Forecast, by Deployment (2020-2032)
14.3.12.3. Market Revenue and Forecast, by Enterprise Size (2020-2032)
14.3.12.4. Market Revenue and Forecast, by Type (2020-2032)
14.3.12.5. Market Revenue and Forecast, by Application (2020-2032)
14.3.12.6. Market Revenue and Forecast, by End-use (2020-2032)
14.3.13. Rest of APAC
14.3.13.1. Market Revenue and Forecast, by Component (2020-2032)
14.3.13.2. Market Revenue and Forecast, by Deployment (2020-2032)
14.3.13.3. Market Revenue and Forecast, by Enterprise Size (2020-2032)
14.3.13.4. Market Revenue and Forecast, by Type (2020-2032)
14.3.13.5. Market Revenue and Forecast, by Application (2020-2032)
14.3.13.6. Market Revenue and Forecast, by End-use (2020-2032)
14.4. MEA
14.4.1. Market Revenue and Forecast, by Component (2020-2032)
14.4.2. Market Revenue and Forecast, by Deployment (2020-2032)
14.4.3. Market Revenue and Forecast, by Enterprise Size (2020-2032)
14.4.4. Market Revenue and Forecast, by Type (2020-2032)
14.4.5. Market Revenue and Forecast, by Application (2020-2032)
14.4.6. Market Revenue and Forecast, by End-use (2020-2032)
14.4.7. GCC
14.4.7.1. Market Revenue and Forecast, by Component (2020-2032)
14.4.7.2. Market Revenue and Forecast, by Deployment (2020-2032)
14.4.7.3. Market Revenue and Forecast, by Enterprise Size (2020-2032)
14.4.7.4. Market Revenue and Forecast, by Type (2020-2032)
14.4.8. Market Revenue and Forecast, by Application (2020-2032)
14.4.9. Market Revenue and Forecast, by End-use (2020-2032)
14.4.10. North Africa
14.4.10.1. Market Revenue and Forecast, by Component (2020-2032)
14.4.10.2. Market Revenue and Forecast, by Deployment (2020-2032)
14.4.10.3. Market Revenue and Forecast, by Enterprise Size (2020-2032)
14.4.10.4. Market Revenue and Forecast, by Type (2020-2032)
14.4.11. Market Revenue and Forecast, by Application (2020-2032)
14.4.12. Market Revenue and Forecast, by End-use (2020-2032)
14.4.13. South Africa
14.4.13.1. Market Revenue and Forecast, by Component (2020-2032)
14.4.13.2. Market Revenue and Forecast, by Deployment (2020-2032)
14.4.13.3. Market Revenue and Forecast, by Enterprise Size (2020-2032)
14.4.13.4. Market Revenue and Forecast, by Type (2020-2032)
14.4.13.5. Market Revenue and Forecast, by Application (2020-2032)
14.4.13.6. Market Revenue and Forecast, by End-use (2020-2032)
14.4.14. Rest of MEA
14.4.14.1. Market Revenue and Forecast, by Component (2020-2032)
14.4.14.2. Market Revenue and Forecast, by Deployment (2020-2032)
14.4.14.3. Market Revenue and Forecast, by Enterprise Size (2020-2032)
14.4.14.4. Market Revenue and Forecast, by Type (2020-2032)
14.4.14.5. Market Revenue and Forecast, by Application (2020-2032)
14.4.14.6. Market Revenue and Forecast, by End-use (2020-2032)
14.5. Latin America
14.5.1. Market Revenue and Forecast, by Component (2020-2032)
14.5.2. Market Revenue and Forecast, by Deployment (2020-2032)
14.5.3. Market Revenue and Forecast, by Enterprise Size (2020-2032)
14.5.4. Market Revenue and Forecast, by Type (2020-2032)
14.5.5. Market Revenue and Forecast, by Application (2020-2032)
14.5.6. Market Revenue and Forecast, by End-use (2020-2032)
14.5.7. Brazil
14.5.7.1. Market Revenue and Forecast, by Component (2020-2032)
14.5.7.2. Market Revenue and Forecast, by Deployment (2020-2032)
14.5.7.3. Market Revenue and Forecast, by Enterprise Size (2020-2032)
14.5.7.4. Market Revenue and Forecast, by Type (2020-2032)
14.5.8. Market Revenue and Forecast, by Application (2020-2032)
14.5.8.1. Market Revenue and Forecast, by End-use (2020-2032)
14.5.9. Rest of LATAM
14.5.9.1. Market Revenue and Forecast, by Component (2020-2032)
14.5.9.2. Market Revenue and Forecast, by Deployment (2020-2032)
14.5.9.3. Market Revenue and Forecast, by Enterprise Size (2020-2032)
14.5.9.4. Market Revenue and Forecast, by Type (2020-2032)
14.5.9.5. Market Revenue and Forecast, by Application (2020-2032)
14.5.9.6. Market Revenue and Forecast, by End-use (2020-2032)
Chapter 15. Company Profiles
15.1. 3M
15.1.1. Company Overview
15.1.2. Product Offerings
15.1.3. Financial Performance
15.1.4. Recent Initiatives
15.2. Apple
15.2.1. Company Overview
15.2.2. Product Offerings
15.2.3. Financial Performance
15.2.4. Recent Initiatives
15.3. AWS
15.3.1. Company Overview
15.3.2. Product Offerings
15.3.3. Financial Performance
15.3.4. Recent Initiatives
15.4. Baidu
15.4.1. Company Overview
15.4.2. Product Offerings
15.4.3. Financial Performance
15.4.4. Recent Initiatives
15.5. Google LLC
15.5.1. Company Overview
15.5.2. Product Offerings
15.5.3. Financial Performance
15.5.4. Recent Initiatives
15.6. IBM Corporation
15.6.1. Company Overview
15.6.2. Product Offerings
15.6.3. Financial Performance
15.6.4. Recent Initiatives
15.7. Meta
15.7.1. Company Overview
15.7.2. Product Offerings
15.7.3. Financial Performance
15.7.4. Recent Initiatives
15.8. Microsoft
15.8.1. Company Overview
15.8.2. Product Offerings
15.8.3. Financial Performance
15.8.4. Recent Initiatives
15.9. Oracle Inc.
15.9.1. Company Overview
15.9.2. Product Offerings
15.9.3. Financial Performance
15.9.4. Recent Initiatives
15.10. Inbenta
15.10.1. Company Overview
15.10.2. Product Offerings
15.10.3. Financial Performance
15.10.4. Recent Initiatives
Chapter 16. Research Methodology
16.1. Primary Research
16.2. Secondary Research
16.3. Assumptions
Chapter 17. Appendix
17.1. About Us
17.2. Glossary of Terms
 Cross-segment Market Size and Analysis for
Mentioned Segments
Additional Company Profiles (Upto 5 With No Cost)
Additional Countries (Apart From Mentioned Countries)
Country/Region-specific Report
Go To Market Strategy
Region Specific Market DynamicsRegion Level Market Share Import Export AnalysisProduction AnalysisOthers
Cross-segment Market Size and Analysis for
Mentioned Segments
Additional Company Profiles (Upto 5 With No Cost)
Additional Countries (Apart From Mentioned Countries)
Country/Region-specific Report
Go To Market Strategy
Region Specific Market DynamicsRegion Level Market Share Import Export AnalysisProduction AnalysisOthers