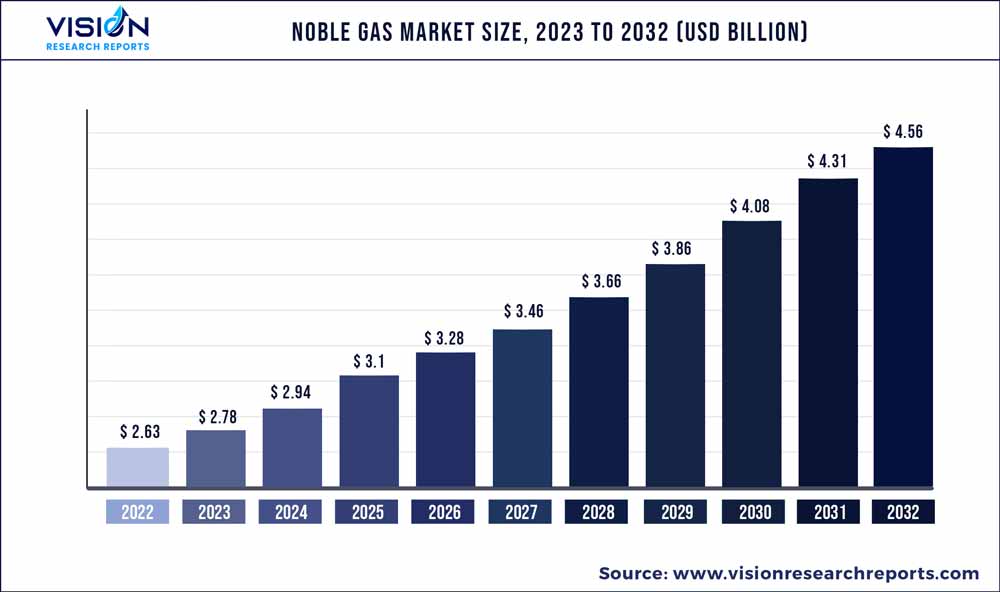
The global noble gas market size was estimated at around USD 2.63 billion in 2022 and it is projected to hit around USD 4.56 billion by 2032, growing at a CAGR of 5.65% from 2023 to 2032.
Key Pointers
Report Scope of the Noble Gas Market
| Report Coverage | Details |
| Market Size in 2022 | USD 2.63 billion |
| Revenue Forecast by 2032 | USD 4.56 billion |
| Growth rate from 2023 to 2032 | CAGR of 5.65% |
| Base Year | 2022 |
| Forecast Period | 2023 to 2032 |
| Market Analysis (Terms Used) | Value (US$ Million/Billion) or (Volume/Units) |
| Regions Covered | North America, Europe, Asia Pacific, Latin America, Middle East & Africa |
| Companies Covered | Air Liquide; Air Products Inc.; BASF SE; Linde plc; Messer; TAIYO NIPPON SANSO CORPORATION; Norco Inc.; Iwatani Corporation; SHOWA DENKO K.K.; MESA Specialty Gases & Equipment; Gulf Cryo |
Increasing application for noble gases in healthcare and industrial sectors and supportive government policies are expected to boost the market growth.
Noble gases are expected to gain preference in the manufacturing industry worldwide owing to their usage in metal melting applications due to their inertness at high temperatures. These gases are used for the distillation of highly pure oxygen by carrying out the cryogenic distillation of air. The flourishing display market worldwide plays a vital role in surging the consumption of noble gases in electronic applications. Improving economic conditions in China and India also contribute to the rising demand for electronic goods, thereby leading to increased consumption of noble gases in these countries.
Helium is required in healthcare due to its unique properties such as low reactivity with other elements and low molecular weight which is useful for various treatment applications in healthcare. Helium is given along with oxygen for respiratory ailments such as asthma exacerbation and bronchitis to make it easier for the patient to breathe. The use of noble gas in healthcare is expected to increase owing to the rising applications for noble gas in healthcare during the forecast period which is a major market opportunity.
Rapid growth in end-use industries such as healthcare, manufacturing, chemical, and electronics is expected to drive the growth of the noble gas industry. These gases have unique properties which benefit many end-use industries by improving yield, optimizing performance, and lowering cost.
The demand for noble gas has increased in the healthcare sector due to increased hospitalizations. The COVID-19 virus damaging a patient’s lungs has led to many serious patients needing respiratory support across the globe increasing the demand for noble gases in the sector. However, demand from industrial and commercial end-users saw a significant dip in 2020 owing to the lockdown imposed in the majority of countries around the globe.
Product Insights
Helium dominated the market with a revenue share of more than 47% in the year 2022, owing to the rising demand for use in healthcare, aerospace, automotive, deep-sea exploration, and manufacturing applications.
Unlike other noble gases, it is unfeasible to extract helium from the atmosphere owing to its low concentration in the atmosphere. It is generated as a byproduct during natural gas extraction. After the natural gas is extracted from the earth, the vent gas built up is stored in gas rejection units.
This gas is then treated to develop high-quality helium. Helium has extensive applications in the healthcare industry; for instance, liquid helium is used in MRI machines to cool superconductive magnets. It is used in helium-neon eye surgeries. Helium is also used as a breathing gas.
Application Insights
Construction dominated the market with a revenue share of more than 22.04% in 2022, on account of rising construction and infrastructure activities on a global scale and especially in the developing economies of the world such as India, Japan, Argentina, China, Brazil, Russia, Kuwait, Saudi Arabia, and many more.
The growth of the healthcare segment can be attributed to versatile properties offered by noble gases in the form of low chemical reactivity, fewer impurities, inertness, etc. that reduce the potential complications and make them safe for use by patients. Noble gases are also increasingly used in analytical applications in manufacturing, energy & power, aerospace, and construction industries in the Asia Pacific and North America.
The demand for noble gas is surging owing to increasing healthcare expenditure, ongoing technological advancements, and the rising consumption of substantial volumes of specialty gas in therapies. This, in turn, drives the growth of the healthcare application segment of the market from 2023 to 2032.
Distribution Insights
Cylinder dominated with the largest revenue share of more than 36% in the year 2022, as it provides a safe and efficient way to store and transport these valuable and useful elements. The cylinders used to store noble gases are typically made of high-strength materials such as steel or aluminum to withstand the high pressure required to store the gases. The cylinders are designed to safely contain the gas and prevent it from leaking out.
Noble gases can also be distributed in bulk in addition to being stored in cylinders. Bulk distribution is often used when large quantities of gas are required for industrial or commercial applications. The main advantage of bulk distribution is that it allows for a continuous supply of gas without the need for frequent cylinder replacements. This can be particularly important for applications that require a constant and uninterrupted supply of noble gas.
The other alternative method is through cryogenic distribution. This involves storing the noble gas at extremely low temperatures, typically below -150°C, which allows for a high storage density. Cryogenic distribution is often used for applications that require very large quantities of gas, such as in the production of semiconductors or in medical applications.
Regional Insights
Asia Pacific dominated the market with a revenue share of 32.86% in 2022, due to the initiatives are undertaken by governments of different countries of Asia Pacific to strengthen their manufacturing and electronics industries in the form of subsidies, trade promotion, and supportive policies, as well as increasing foreign investments, are expected to expand product demand over the forecast period.
North America is one of the significant markets for noble gas in the world owing to the large-scale production of these gas in the region. Massive investments for developing air separation techniques and production technologies in North America are anticipated to surge the demand for noble gas in the region in the coming years.
Increasing demand for noble gas in Europe is positively influencing the growth of the market in this region owing to the high rate of facility establishment, technological advancements, high disposable income, and improved standard of living of the masses. Supportive government investments for noble gas production in Europe are projected to fuel the growth of the market for noble gas in this region from 2023 to 2032.
Noble Gas Market Segmentations:
By Product
By Application
By Distribution
Chapter 1. Introduction
1.1. Research Objective
1.2. Scope of the Study
1.3. Definition
Chapter 2. Research Methodology
2.1. Research Approach
2.2. Data Sources
2.3. Assumptions & Limitations
Chapter 3. Executive Summary
3.1. Market Snapshot
Chapter 4. Market Variables and Scope
4.1. Introduction
4.2. Market Classification and Scope
4.3. Industry Value Chain Analysis
4.3.1. Raw Material Procurement Analysis
4.3.2. Sales and Distribution Product Analysis
4.3.3. Downstream Buyer Analysis
Chapter 5. COVID 19 Impact on Noble Gas Market
5.1. COVID-19 Landscape: Noble Gas Industry Impact
5.2. COVID 19 - Impact Assessment for the Industry
5.3. COVID 19 Impact: Global Major Government Policy
5.4. Market Trends and Opportunities in the COVID-19 Landscape
Chapter 6. Market Dynamics Analysis and Trends
6.1. Market Dynamics
6.1.1. Market Drivers
6.1.2. Market Restraints
6.1.3. Market Opportunities
6.2. Porter’s Five Forces Analysis
6.2.1. Bargaining power of suppliers
6.2.2. Bargaining power of buyers
6.2.3. Threat of substitute
6.2.4. Threat of new entrants
6.2.5. Degree of competition
Chapter 7. Competitive Landscape
7.1.1. Company Market Share/Positioning Analysis
7.1.2. Key Strategies Adopted by Players
7.1.3. Vendor Landscape
7.1.3.1. List of Suppliers
7.1.3.2. List of Buyers
Chapter 8. Global Noble Gas Market, By Product
8.1. Noble Gas Market, by Product, 2023-2032
8.1.1 Helium
8.1.1.1. Market Revenue and Forecast (2020-2032)
8.1.2. Neon
8.1.2.1. Market Revenue and Forecast (2020-2032)
8.1.3. Argon
8.1.3.1. Market Revenue and Forecast (2020-2032)
8.1.4. Krypton
8.1.4.1. Market Revenue and Forecast (2020-2032)
8.1.5. Xenon
8.1.5.1. Market Revenue and Forecast (2020-2032)
8.1.6. Others
8.1.6.1. Market Revenue and Forecast (2020-2032)
Chapter 9. Global Noble Gas Market, By Application
9.1. Noble Gas Market, by Application, 2023-2032
9.1.1. Healthcare
9.1.1.1. Market Revenue and Forecast (2020-2032)
9.1.2. Electronics
9.1.2.1. Market Revenue and Forecast (2020-2032)
9.1.3. Aerospace
9.1.3.1. Market Revenue and Forecast (2020-2032)
9.1.4. Construction
9.1.4.1. Market Revenue and Forecast (2020-2032)
9.1.5. Energy & Power
9.1.5.1. Market Revenue and Forecast (2020-2032)
9.1.6. Others
9.1.6.1. Market Revenue and Forecast (2020-2032)
Chapter 10. Global Noble Gas Market, By Distribution
10.1. Noble Gas Market, by Distribution, 2023-2032
10.1.1. Bulk
10.1.1.1. Market Revenue and Forecast (2020-2032)
10.1.2. Cylinder
10.1.2.1. Market Revenue and Forecast (2020-2032)
10.1.3. Others
10.1.3.1. Market Revenue and Forecast (2020-2032)
Chapter 11. Global Noble Gas Market, Regional Estimates and Trend Forecast
11.1. North America
11.1.1. Market Revenue and Forecast, by Product (2020-2032)
11.1.2. Market Revenue and Forecast, by Application (2020-2032)
11.1.3. Market Revenue and Forecast, by Distribution (2020-2032)
11.1.4. U.S.
11.1.4.1. Market Revenue and Forecast, by Product (2020-2032)
11.1.4.2. Market Revenue and Forecast, by Application (2020-2032)
11.1.4.3. Market Revenue and Forecast, by Distribution (2020-2032)
11.1.5. Rest of North America
11.1.5.1. Market Revenue and Forecast, by Product (2020-2032)
11.1.5.2. Market Revenue and Forecast, by Application (2020-2032)
11.1.5.3. Market Revenue and Forecast, by Distribution (2020-2032)
11.2. Europe
11.2.1. Market Revenue and Forecast, by Product (2020-2032)
11.2.2. Market Revenue and Forecast, by Application (2020-2032)
11.2.3. Market Revenue and Forecast, by Distribution (2020-2032)
11.2.4. UK
11.2.4.1. Market Revenue and Forecast, by Product (2020-2032)
11.2.4.2. Market Revenue and Forecast, by Application (2020-2032)
11.2.4.3. Market Revenue and Forecast, by Distribution (2020-2032)
11.2.5. Germany
11.2.5.1. Market Revenue and Forecast, by Product (2020-2032)
11.2.5.2. Market Revenue and Forecast, by Application (2020-2032)
11.2.5.3. Market Revenue and Forecast, by Distribution (2020-2032)
11.2.6. France
11.2.6.1. Market Revenue and Forecast, by Product (2020-2032)
11.2.6.2. Market Revenue and Forecast, by Application (2020-2032)
11.2.6.3. Market Revenue and Forecast, by Distribution (2020-2032)
11.2.7. Rest of Europe
11.2.7.1. Market Revenue and Forecast, by Product (2020-2032)
11.2.7.2. Market Revenue and Forecast, by Application (2020-2032)
11.2.7.3. Market Revenue and Forecast, by Distribution (2020-2032)
11.3. APAC
11.3.1. Market Revenue and Forecast, by Product (2020-2032)
11.3.2. Market Revenue and Forecast, by Application (2020-2032)
11.3.3. Market Revenue and Forecast, by Distribution (2020-2032)
11.3.4. India
11.3.4.1. Market Revenue and Forecast, by Product (2020-2032)
11.3.4.2. Market Revenue and Forecast, by Application (2020-2032)
11.3.4.3. Market Revenue and Forecast, by Distribution (2020-2032)
11.3.5. China
11.3.5.1. Market Revenue and Forecast, by Product (2020-2032)
11.3.5.2. Market Revenue and Forecast, by Application (2020-2032)
11.3.5.3. Market Revenue and Forecast, by Distribution (2020-2032)
11.3.6. Japan
11.3.6.1. Market Revenue and Forecast, by Product (2020-2032)
11.3.6.2. Market Revenue and Forecast, by Application (2020-2032)
11.3.6.3. Market Revenue and Forecast, by Distribution (2020-2032)
11.3.7. Rest of APAC
11.3.7.1. Market Revenue and Forecast, by Product (2020-2032)
11.3.7.2. Market Revenue and Forecast, by Application (2020-2032)
11.3.7.3. Market Revenue and Forecast, by Distribution (2020-2032)
11.4. MEA
11.4.1. Market Revenue and Forecast, by Product (2020-2032)
11.4.2. Market Revenue and Forecast, by Application (2020-2032)
11.4.3. Market Revenue and Forecast, by Distribution (2020-2032)
11.4.4. GCC
11.4.4.1. Market Revenue and Forecast, by Product (2020-2032)
11.4.4.2. Market Revenue and Forecast, by Application (2020-2032)
11.4.4.3. Market Revenue and Forecast, by Distribution (2020-2032)
11.4.5. North Africa
11.4.5.1. Market Revenue and Forecast, by Product (2020-2032)
11.4.5.2. Market Revenue and Forecast, by Application (2020-2032)
11.4.5.3. Market Revenue and Forecast, by Distribution (2020-2032)
11.4.6. South Africa
11.4.6.1. Market Revenue and Forecast, by Product (2020-2032)
11.4.6.2. Market Revenue and Forecast, by Application (2020-2032)
11.4.6.3. Market Revenue and Forecast, by Distribution (2020-2032)
11.4.7. Rest of MEA
11.4.7.1. Market Revenue and Forecast, by Product (2020-2032)
11.4.7.2. Market Revenue and Forecast, by Application (2020-2032)
11.4.7.3. Market Revenue and Forecast, by Distribution (2020-2032)
11.5. Latin America
11.5.1. Market Revenue and Forecast, by Product (2020-2032)
11.5.2. Market Revenue and Forecast, by Application (2020-2032)
11.5.3. Market Revenue and Forecast, by Distribution (2020-2032)
11.5.4. Brazil
11.5.4.1. Market Revenue and Forecast, by Product (2020-2032)
11.5.4.2. Market Revenue and Forecast, by Application (2020-2032)
11.5.4.3. Market Revenue and Forecast, by Distribution (2020-2032)
11.5.5. Rest of LATAM
11.5.5.1. Market Revenue and Forecast, by Product (2020-2032)
11.5.5.2. Market Revenue and Forecast, by Application (2020-2032)
11.5.5.3. Market Revenue and Forecast, by Distribution (2020-2032)
Chapter 12. Company Profiles
12.1. Air Liquide
12.1.1. Company Overview
12.1.2. Product Offerings
12.1.3. Financial Performance
12.1.4. Recent Initiatives
12.2. Air Products Inc.
12.2.1. Company Overview
12.2.2. Product Offerings
12.2.3. Financial Performance
12.2.4. Recent Initiatives
12.3. BASF SE
12.3.1. Company Overview
12.3.2. Product Offerings
12.3.3. Financial Performance
12.3.4. Recent Initiatives
12.4. Linde plc
12.4.1. Company Overview
12.4.2. Product Offerings
12.4.3. Financial Performance
12.4.4. Recent Initiatives
12.5. Messer
12.5.1. Company Overview
12.5.2. Product Offerings
12.5.3. Financial Performance
12.5.4. Recent Initiatives
12.6. TAIYO NIPPON SANSO CORPORATION
12.6.1. Company Overview
12.6.2. Product Offerings
12.6.3. Financial Performance
12.6.4. Recent Initiatives
12.7. Norco Inc.
12.7.1. Company Overview
12.7.2. Product Offerings
12.7.3. Financial Performance
12.7.4. Recent Initiatives
12.8. Iwatani Corporation
12.8.1. Company Overview
12.8.2. Product Offerings
12.8.3. Financial Performance
12.8.4. Recent Initiatives
12.9. SHOWA DENKO K.K.
12.9.1. Company Overview
12.9.2. Product Offerings
12.9.3. Financial Performance
12.9.4. Recent Initiatives
12.10. MESA Specialty Gases & Equipment
12.10.1. Company Overview
12.10.2. Product Offerings
12.10.3. Financial Performance
12.10.4. Recent Initiatives
Chapter 13. Research Methodology
13.1. Primary Research
13.2. Secondary Research
13.3. Assumptions
Chapter 14. Appendix
14.1. About Us
14.2. Glossary of Terms
 Cross-segment Market Size and Analysis for
Mentioned Segments
Additional Company Profiles (Upto 5 With No Cost)
Additional Countries (Apart From Mentioned Countries)
Country/Region-specific Report
Go To Market Strategy
Region Specific Market DynamicsRegion Level Market Share Import Export AnalysisProduction AnalysisOthers
Cross-segment Market Size and Analysis for
Mentioned Segments
Additional Company Profiles (Upto 5 With No Cost)
Additional Countries (Apart From Mentioned Countries)
Country/Region-specific Report
Go To Market Strategy
Region Specific Market DynamicsRegion Level Market Share Import Export AnalysisProduction AnalysisOthers