Omics Lab Services Market Size, Share | Report 2023-2032
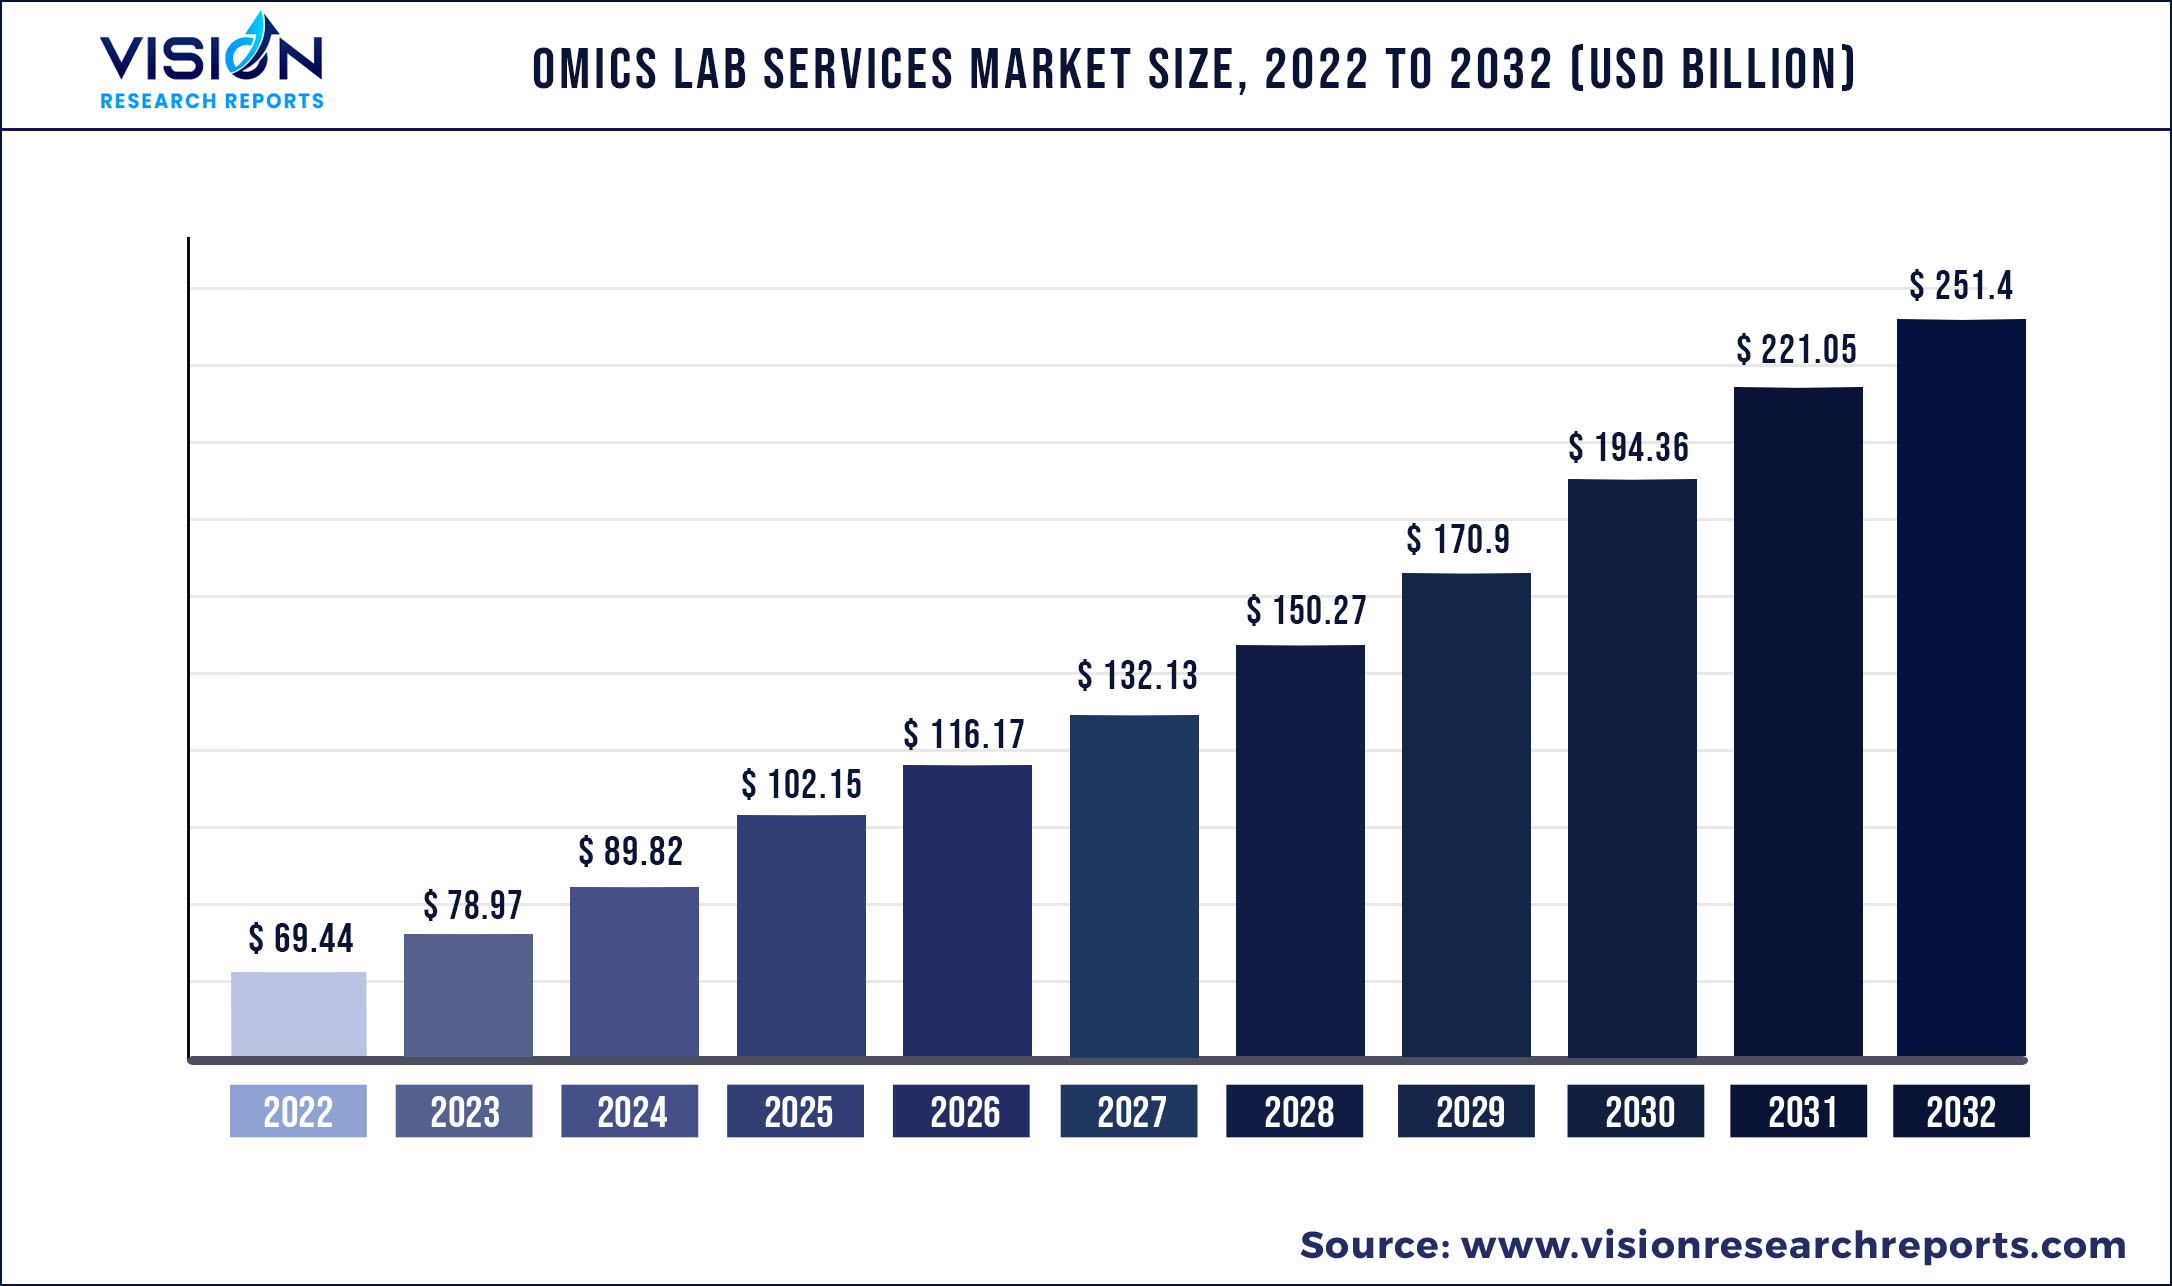
The global omics lab services market was valued at USD 69.44 billion in 2022 and it is predicted to surpass around USD 251.4 billion by 2032 with a CAGR of 13.73% from 2023 to 2032.
Key Pointers
The omics lab services market is witnessing growth due to the factors such as increasing demand/adoption for the services and increasing participation of the different companies. For instance, in October 2022, Illumina, Inc. entered into strategic partnership with AstraZeneca to accelerate drug target discovery using AI-based genomic analysis.
growth of the genomic data pool from research activities has enabled biologists, physicians, and patients to further investigate the genetic predisposition to certain diseases. Clinical application of this data pool is expected to transform the healthcare system with respect to the provision of more accurate, effective, and reliable disease management solutions. Although clinical use of genomic data is still in nascent stage, efforts are being made by the industrial and healthcare communities to successfully incorporate genetic data into clinical workflows.
The field of oncology has benefited most from the omics research, and one newly developed use of NGS clinical tests is for the quantification of circulating tumor DNA (ctDNA) from plasma. Numerous NGS technologies, such as Cancer Personalized Profiling by deep Sequencing, may be used. High-throughput RNA sequencing developments have brought light the importance of transcriptomics in biological and clinical research. RNA sequencing using NGS technologies or microarrays is two ways to perform transcriptomics.
Omics labs have emerged as an essential tool for the prognosis, diagnosis, and treatment of a wide range of disease; however, lack of skilled professionals who have the ability to handle samples, supply chain, and logistics play a significant role in the sample sent to omics labs. Omics databases contain tens of thousands to millions of measurements at the molecular level.
Investigators typically start by performing feature selection, which involves choosing a subset of the measurements that seem to be related to the characteristic or result or that are assumed physiologically relevant, based on the past knowledge. A fully specified computational model may be created to predict the clinical outcome based on the omics measurements, using only this subset of the measurements.
Omics Lab Services Market Segmentations:
| By Services | By End-Use | By Product | By Frequency of Service | By Business |
|
Genomics Proteomics Transcriptomic Metabolomics Epigenetics |
Hardware Equipment (Instrument, Kits, Chips) Testing / Lab (Services) Analytics / Interpretation (Personalization and Interpretation) |
One-off Repeat Continuous |
Hospitals Research Institutes Diagnostic Labs |
Cancer Pharmaco Reproductive Other Genetic Tests Forensics Population Studies Skincare Nutrition Vitamins and Supplements Genealogy Other Categories |
Omics Lab Services Market Key Players and Regions Segmentations:
| Key Players | Geography |
|
Agilent Technologies, Inc. Beijing Genomics Institute (BGI) Q2 Solutions Spectrus Flomics Biotech PhenoSwitch Bioscience QIAGEN Quest Diagnostics Incorporated Thermo Fisher Scientific, Inc. Illumina, Inc. |
North America Europe Asia Pacific Latin America Middle East and Africa |
Chapter 1. Introduction
1.1. Research Objective
1.2. Scope of the Study
1.3. Definition
Chapter 2. Research Methodology
2.1. Research Approach
2.2. Data Sources
2.3. Assumptions & Limitations
Chapter 3. Executive Summary
3.1. Market Snapshot
Chapter 4. Market Variables and Scope
4.1. Introduction
4.2. Market Classification and Scope
4.3. Industry Value Chain Analysis
4.3.1. Raw Material Procurement Analysis
4.3.2. Sales and Distribution Channel Analysis
4.3.3. Downstream Buyer Analysis
Chapter 5. COVID 19 Impact on Omics Lab Services Market
5.1. COVID-19 Landscape: Omics Lab Services Industry Impact
5.2. COVID 19 - Impact Assessment for the Industry
5.3. COVID 19 Impact: Global Major Government Policy
5.4. Market Trends and Opportunities in the COVID-19 Landscape
Chapter 6. Market Dynamics Analysis and Trends
6.1. Market Dynamics
6.1.1. Market Drivers
6.1.2. Market Restraints
6.1.3. Market Opportunities
6.2. Porter’s Five Forces Analysis
6.2.1. Bargaining power of suppliers
6.2.2. Bargaining power of buyers
6.2.3. Threat of substitute
6.2.4. Threat of new entrants
6.2.5. Degree of competition
Chapter 7. Competitive Landscape
7.1.1. Company Market Share/Positioning Analysis
7.1.2. Key Strategies Adopted by Players
7.1.3. Vendor Landscape
7.1.3.1. List of Suppliers
7.1.3.2. List of Buyers
Chapter 8. Global Omics Lab Services Market, By Services
8.1. Omics Lab Services Market, by Services, 2023-2032
8.1.1. Genomics
8.1.1.1. Market Revenue and Forecast (2019-2032)
8.1.2. Proteomics
8.1.2.1. Market Revenue and Forecast (2019-2032)
8.1.3. Transcriptomic
8.1.3.1. Market Revenue and Forecast (2019-2032)
8.1.4. Metabolomics
8.1.4.1. Market Revenue and Forecast (2019-2032)
8.1.5. Epigenetics
8.1.5.1. Market Revenue and Forecast (2019-2032)
Chapter 9. Global Omics Lab Services Market, By End-Use
9.1. Omics Lab Services Market, by End-Use, 2023-2032
9.1.1. Hardware Equipment (Instrument, Kits, Chips)
9.1.1.1. Market Revenue and Forecast (2019-2032)
9.1.2. Testing / Lab (Services)
9.1.2.1. Market Revenue and Forecast (2019-2032)
9.1.3. Analytics / Interpretation (Personalization and Interpretation)
9.1.3.1. Market Revenue and Forecast (2019-2032)
Chapter 10. Global Omics Lab Services Market, By Product
10.1. Omics Lab Services Market, by Product, 2023-2032
10.1.1. One-off
10.1.1.1. Market Revenue and Forecast (2019-2032)
10.1.2. Repeat
10.1.2.1. Market Revenue and Forecast (2019-2032)
10.1.3. Continuous
10.1.3.1. Market Revenue and Forecast (2019-2032)
Chapter 11. Global Omics Lab Services Market, By Frequency of Service
11.1. Omics Lab Services Market, by Frequency of Service, 2023-2032
11.1.1. Hospitals
11.1.1.1. Market Revenue and Forecast (2019-2032)
11.1.2. Research Institutes
11.1.2.1. Market Revenue and Forecast (2019-2032)
11.1.3. Diagnostic Labs
11.1.3.1. Market Revenue and Forecast (2019-2032)
Chapter 12. Global Omics Lab Services Market, By Business
12.1. Omics Lab Services Market, by Business, 2023-2032
12.1.1. Cancer
12.1.1.1. Market Revenue and Forecast (2019-2032)
12.1.2. Pharmaco
12.1.2.1. Market Revenue and Forecast (2019-2032)
12.1.3. Reproductive
12.1.3.1. Market Revenue and Forecast (2019-2032)
12.1.4. Other Genetic Tests
12.1.4.1. Market Revenue and Forecast (2019-2032)
12.1.5. Forensics
12.1.5.1. Market Revenue and Forecast (2019-2032)
12.1.6. Population Studies
12.1.6.1. Market Revenue and Forecast (2019-2032)
12.1.7. Skincare
12.1.7.1. Market Revenue and Forecast (2019-2032)
12.1.8. Nutrition
12.1.8.1. Market Revenue and Forecast (2019-2032)
12.1.9. Vitamins and Supplements
12.1.9.1. Market Revenue and Forecast (2019-2032)
12.1.10. Genealogy
12.1.10.1. Market Revenue and Forecast (2019-2032)
12.1.11. Other Categories
12.1.11.1. Market Revenue and Forecast (2019-2032)
Chapter 13. Global Omics Lab Services Market, Regional Estimates and Trend Forecast
13.1. North America
13.1.1. Market Revenue and Forecast, by Services (2019-2032)
13.1.2. Market Revenue and Forecast, by End-Use (2019-2032)
13.1.3. Market Revenue and Forecast, by Product (2019-2032)
13.1.4. Market Revenue and Forecast, by Frequency of Service (2019-2032)
13.1.5. Market Revenue and Forecast, by Business (2019-2032)
13.1.6. U.S.
13.1.6.1. Market Revenue and Forecast, by Services (2019-2032)
13.1.6.2. Market Revenue and Forecast, by End-Use (2019-2032)
13.1.6.3. Market Revenue and Forecast, by Product (2019-2032)
13.1.6.4. Market Revenue and Forecast, by Frequency of Service (2019-2032)
13.1.7. Market Revenue and Forecast, by Business (2019-2032)
13.1.8. Rest of North America
13.1.8.1. Market Revenue and Forecast, by Services (2019-2032)
13.1.8.2. Market Revenue and Forecast, by End-Use (2019-2032)
13.1.8.3. Market Revenue and Forecast, by Product (2019-2032)
13.1.8.4. Market Revenue and Forecast, by Frequency of Service (2019-2032)
13.1.8.5. Market Revenue and Forecast, by Business (2019-2032)
13.2. Europe
13.2.1. Market Revenue and Forecast, by Services (2019-2032)
13.2.2. Market Revenue and Forecast, by End-Use (2019-2032)
13.2.3. Market Revenue and Forecast, by Product (2019-2032)
13.2.4. Market Revenue and Forecast, by Frequency of Service (2019-2032)
13.2.5. Market Revenue and Forecast, by Business (2019-2032)
13.2.6. UK
13.2.6.1. Market Revenue and Forecast, by Services (2019-2032)
13.2.6.2. Market Revenue and Forecast, by End-Use (2019-2032)
13.2.6.3. Market Revenue and Forecast, by Product (2019-2032)
13.2.7. Market Revenue and Forecast, by Frequency of Service (2019-2032)
13.2.8. Market Revenue and Forecast, by Business (2019-2032)
13.2.9. Germany
13.2.9.1. Market Revenue and Forecast, by Services (2019-2032)
13.2.9.2. Market Revenue and Forecast, by End-Use (2019-2032)
13.2.9.3. Market Revenue and Forecast, by Product (2019-2032)
13.2.10. Market Revenue and Forecast, by Frequency of Service (2019-2032)
13.2.11. Market Revenue and Forecast, by Business (2019-2032)
13.2.12. France
13.2.12.1. Market Revenue and Forecast, by Services (2019-2032)
13.2.12.2. Market Revenue and Forecast, by End-Use (2019-2032)
13.2.12.3. Market Revenue and Forecast, by Product (2019-2032)
13.2.12.4. Market Revenue and Forecast, by Frequency of Service (2019-2032)
13.2.13. Market Revenue and Forecast, by Business (2019-2032)
13.2.14. Rest of Europe
13.2.14.1. Market Revenue and Forecast, by Services (2019-2032)
13.2.14.2. Market Revenue and Forecast, by End-Use (2019-2032)
13.2.14.3. Market Revenue and Forecast, by Product (2019-2032)
13.2.14.4. Market Revenue and Forecast, by Frequency of Service (2019-2032)
13.2.15. Market Revenue and Forecast, by Business (2019-2032)
13.3. APAC
13.3.1. Market Revenue and Forecast, by Services (2019-2032)
13.3.2. Market Revenue and Forecast, by End-Use (2019-2032)
13.3.3. Market Revenue and Forecast, by Product (2019-2032)
13.3.4. Market Revenue and Forecast, by Frequency of Service (2019-2032)
13.3.5. Market Revenue and Forecast, by Business (2019-2032)
13.3.6. India
13.3.6.1. Market Revenue and Forecast, by Services (2019-2032)
13.3.6.2. Market Revenue and Forecast, by End-Use (2019-2032)
13.3.6.3. Market Revenue and Forecast, by Product (2019-2032)
13.3.6.4. Market Revenue and Forecast, by Frequency of Service (2019-2032)
13.3.7. Market Revenue and Forecast, by Business (2019-2032)
13.3.8. China
13.3.8.1. Market Revenue and Forecast, by Services (2019-2032)
13.3.8.2. Market Revenue and Forecast, by End-Use (2019-2032)
13.3.8.3. Market Revenue and Forecast, by Product (2019-2032)
13.3.8.4. Market Revenue and Forecast, by Frequency of Service (2019-2032)
13.3.9. Market Revenue and Forecast, by Business (2019-2032)
13.3.10. Japan
13.3.10.1. Market Revenue and Forecast, by Services (2019-2032)
13.3.10.2. Market Revenue and Forecast, by End-Use (2019-2032)
13.3.10.3. Market Revenue and Forecast, by Product (2019-2032)
13.3.10.4. Market Revenue and Forecast, by Frequency of Service (2019-2032)
13.3.10.5. Market Revenue and Forecast, by Business (2019-2032)
13.3.11. Rest of APAC
13.3.11.1. Market Revenue and Forecast, by Services (2019-2032)
13.3.11.2. Market Revenue and Forecast, by End-Use (2019-2032)
13.3.11.3. Market Revenue and Forecast, by Product (2019-2032)
13.3.11.4. Market Revenue and Forecast, by Frequency of Service (2019-2032)
13.3.11.5. Market Revenue and Forecast, by Business (2019-2032)
13.4. MEA
13.4.1. Market Revenue and Forecast, by Services (2019-2032)
13.4.2. Market Revenue and Forecast, by End-Use (2019-2032)
13.4.3. Market Revenue and Forecast, by Product (2019-2032)
13.4.4. Market Revenue and Forecast, by Frequency of Service (2019-2032)
13.4.5. Market Revenue and Forecast, by Business (2019-2032)
13.4.6. GCC
13.4.6.1. Market Revenue and Forecast, by Services (2019-2032)
13.4.6.2. Market Revenue and Forecast, by End-Use (2019-2032)
13.4.6.3. Market Revenue and Forecast, by Product (2019-2032)
13.4.6.4. Market Revenue and Forecast, by Frequency of Service (2019-2032)
13.4.7. Market Revenue and Forecast, by Business (2019-2032)
13.4.8. North Africa
13.4.8.1. Market Revenue and Forecast, by Services (2019-2032)
13.4.8.2. Market Revenue and Forecast, by End-Use (2019-2032)
13.4.8.3. Market Revenue and Forecast, by Product (2019-2032)
13.4.8.4. Market Revenue and Forecast, by Frequency of Service (2019-2032)
13.4.9. Market Revenue and Forecast, by Business (2019-2032)
13.4.10. South Africa
13.4.10.1. Market Revenue and Forecast, by Services (2019-2032)
13.4.10.2. Market Revenue and Forecast, by End-Use (2019-2032)
13.4.10.3. Market Revenue and Forecast, by Product (2019-2032)
13.4.10.4. Market Revenue and Forecast, by Frequency of Service (2019-2032)
13.4.10.5. Market Revenue and Forecast, by Business (2019-2032)
13.4.11. Rest of MEA
13.4.11.1. Market Revenue and Forecast, by Services (2019-2032)
13.4.11.2. Market Revenue and Forecast, by End-Use (2019-2032)
13.4.11.3. Market Revenue and Forecast, by Product (2019-2032)
13.4.11.4. Market Revenue and Forecast, by Frequency of Service (2019-2032)
13.4.11.5. Market Revenue and Forecast, by Business (2019-2032)
13.5. Latin America
13.5.1. Market Revenue and Forecast, by Services (2019-2032)
13.5.2. Market Revenue and Forecast, by End-Use (2019-2032)
13.5.3. Market Revenue and Forecast, by Product (2019-2032)
13.5.4. Market Revenue and Forecast, by Frequency of Service (2019-2032)
13.5.5. Market Revenue and Forecast, by Business (2019-2032)
13.5.6. Brazil
13.5.6.1. Market Revenue and Forecast, by Services (2019-2032)
13.5.6.2. Market Revenue and Forecast, by End-Use (2019-2032)
13.5.6.3. Market Revenue and Forecast, by Product (2019-2032)
13.5.6.4. Market Revenue and Forecast, by Frequency of Service (2019-2032)
13.5.7. Market Revenue and Forecast, by Business (2019-2032)
13.5.8. Rest of LATAM
13.5.8.1. Market Revenue and Forecast, by Services (2019-2032)
13.5.8.2. Market Revenue and Forecast, by End-Use (2019-2032)
13.5.8.3. Market Revenue and Forecast, by Product (2019-2032)
13.5.8.4. Market Revenue and Forecast, by Frequency of Service (2019-2032)
13.5.8.5. Market Revenue and Forecast, by Business (2019-2032)
Chapter 14. Company Profiles
14.1. Agilent Technologies, Inc.
14.1.1. Company Overview
14.1.2. Product Offerings
14.1.3. Financial Performance
14.1.4. Recent Initiatives
14.2. Beijing Genomics Institute (BGI)
14.2.1. Company Overview
14.2.2. Product Offerings
14.2.3. Financial Performance
14.2.4. Recent Initiatives
14.3. Q2 Solutions
14.3.1. Company Overview
14.3.2. Product Offerings
14.3.3. Financial Performance
14.3.4. Recent Initiatives
14.4. Spectrus
14.4.1. Company Overview
14.4.2. Product Offerings
14.4.3. Financial Performance
14.4.4. Recent Initiatives
14.5. Flomics Biotech
14.5.1. Company Overview
14.5.2. Product Offerings
14.5.3. Financial Performance
14.5.4. Recent Initiatives
14.6. PhenoSwitch Bioscience
14.6.1. Company Overview
14.6.2. Product Offerings
14.6.3. Financial Performance
14.6.4. Recent Initiatives
14.7. QIAGEN
14.7.1. Company Overview
14.7.2. Product Offerings
14.7.3. Financial Performance
14.7.4. Recent Initiatives
14.8. Quest Diagnostics Incorporated
14.8.1. Company Overview
14.8.2. Product Offerings
14.8.3. Financial Performance
14.8.4. Recent Initiatives
14.9. Thermo Fisher Scientific, Inc.
14.9.1. Company Overview
14.9.2. Product Offerings
14.9.3. Financial Performance
14.9.4. Recent Initiatives
14.10. Illumina, Inc.
14.10.1. Company Overview
14.10.2. Product Offerings
14.10.3. Financial Performance
14.10.4. Recent Initiatives
Chapter 15. Research Methodology
15.1. Primary Research
15.2. Secondary Research
15.3. Assumptions
Chapter 16. Appendix
16.1. About Us
16.2. Glossary of Terms
 Cross-segment Market Size and Analysis for
Mentioned Segments
Additional Company Profiles (Upto 5 With No Cost)
Additional Countries (Apart From Mentioned Countries)
Country/Region-specific Report
Go To Market Strategy
Region Specific Market DynamicsRegion Level Market Share Import Export AnalysisProduction AnalysisOthers
Cross-segment Market Size and Analysis for
Mentioned Segments
Additional Company Profiles (Upto 5 With No Cost)
Additional Countries (Apart From Mentioned Countries)
Country/Region-specific Report
Go To Market Strategy
Region Specific Market DynamicsRegion Level Market Share Import Export AnalysisProduction AnalysisOthers