Open Source Services Market Size, Share | Report 2023-2032
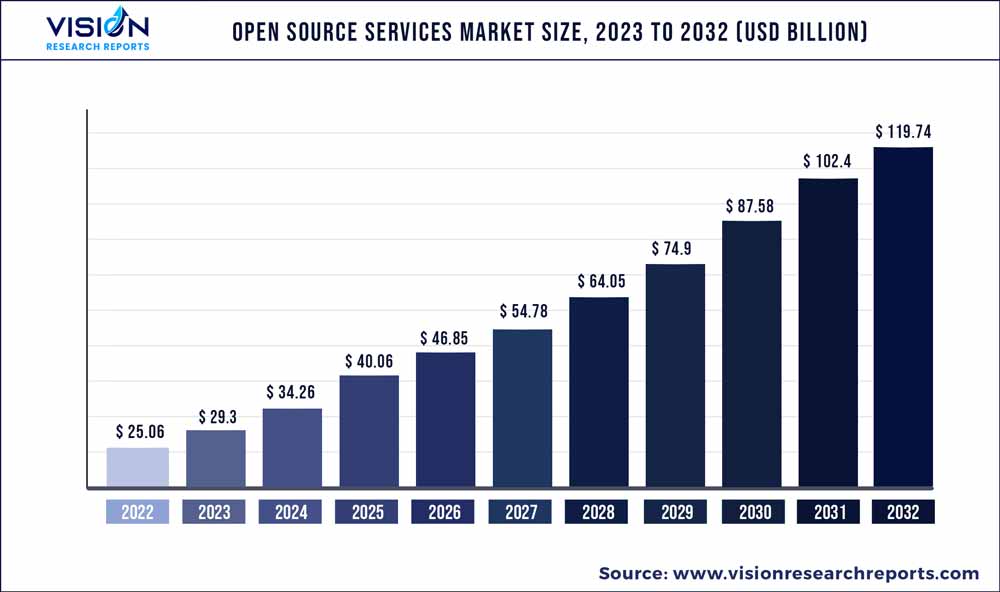
The global open source services market was estimated at USD 25.06 billion in 2022 and it is expected to surpass around USD 119.74 billion by 2032, poised to grow at a CAGR of 16.93% from 2023 to 2032.
Key Pointers
Report Scope of the Open Source Services Market
| Report Coverage | Details |
| Market Size in 2022 | USD 25.06 billion |
| Revenue Forecast by 2032 | USD 119.74 billion |
| Growth rate from 2023 to 2032 | CAGR of 16.93% |
| Base Year | 2022 |
| Forecast Period | 2023 to 2032 |
| Market Analysis (Terms Used) | Value (US$ Million/Billion) or (Volume/Units) |
| Regions Covered | North America, Europe, Asia Pacific, Latin America, Middle East & Africa |
| Companies Covered | Red Hat, Inc. (IBM),; MuleSoft (Salesforce, Inc.); Amazon Web Services, Inc. (Amazon); Databricks; HashiCorp; Alphabet, Inc. (Google); Cisco; Microsoft; Oracle; SAP SE |
The trend of DevOps, which emphasizes collaboration, automation, and continuous delivery of software, is driving growth. DevOps teams often use open source tools and platforms to streamline development workflows and improve efficiency, leading to increased demand for open source services. In addition, the growth of the Internet of Things (IoT) has created new opportunities for open source providers, as IoT devices and applications rely heavily on open source software for connectivity and interoperability.
There has been a noticeable trend of adopting permissive open-source licenses in contrast to copyleft licenses, particularly those in the General Public License (GPL) family, which have decreased in usage. Permissive licenses impose minimal restrictions on software users, allowing them to incorporate the software into proprietary applications without disclosing the source code. This has contributed to the growth of the open source services industry, as the software can be distributed and reused more easily, thereby reducing both cost and time. As a result, permissive licenses are becoming increasingly popular, highlighting the importance of flexibility and adaptability in the software industry.
As technology continues to advance, more and more businesses are turning to open source systems for a range of purposes, including application development, IT infrastructure modernization, integration, and digital transformation. For instance, In May 2022, the fourth annual report, The State of Enterprise Open Source, by Red Hat, revealed that 95% of the 1,296 IT leaders surveyed from 14 countries believe that enterprise open source is crucial for their organization's overall infrastructure. The study also indicates that the increasing adoption of hybrid cloud and edge computing will lead to a further rise in this percentage, making open source even more significant.
The COVID-19 pandemic has led to an increased focus on innovation and digital transformation across all industries. This has created new opportunities for open source providers as businesses seek solutions that can help them navigate the evolving technological landscape. With the pandemic accelerating the adoption of digital technologies, commercial open source services applications, and services have become an increasingly attractive option for companies looking to modernize their IT infrastructure and improve their digital capabilities.
Services Insights
The integration & deployment segment dominated the market in 2022 and accounted for a revenue share of above 31.03%. Organizations are increasingly adopting open source software solutions for their business needs, which has led to a surge in demand for experts who can help integrate and deploy these solutions. Moreover, open source technologies are highly modular and can be customized to suit specific business needs.
This requires expertise in integration and deployment as organizations seek to integrate these solutions into their existing IT infrastructure seamlessly. Furthermore, the integration and deployment of open source solutions can be complex, and organizations are seeking to work with experts who can guide them through the process and ensure the successful implementation of these solutions.
The managed services segment is anticipated to register significant growth over the forecast period. As more organizations adopt open source technologies, they require specialized skills and expertise to manage and maintain these solutions. Managed services providers (MSPs) offer a range of services, including monitoring, maintenance, and troubleshooting, which can help organizations reduce their IT costs and increase their operational efficiency.
The managed services segment is also growing due to the increasing complexity of IT environments, which has led to a shortage of skilled IT professionals. By partnering with MSPs, organizations can access a team of experienced professionals who can manage their IT infrastructure effectively and efficiently, allowing them to focus on their core business activities.
Deployment Insights
The hybrid segment dominated the market in 2022 and accounted for a revenue share of more than 39.07%. Many organizations have unique IT requirements and operate in complex environments that require a combination of on-premises and cloud-based solutions.
The hybrid deployment model offers the flexibility to leverage the benefits of both environments while minimizing the potential drawbacks. Moreover, open source solutions are highly modular and can be customized to fit specific business needs. The hybrid deployment model allows organizations to leverage these benefits while maintaining the ability to scale and add new capabilities as needed.
The cloud segment is anticipated to register significant growth over the forecast period. Cloud deployment provides numerous benefits, such as scalability, agility, and reduced IT infrastructure costs, making it an attractive option for organizations of all sizes. Open source solutions are well-suited for cloud deployment, as they are highly modular and can be easily integrated into cloud environments.
Moreover, open source technologies are often developed with the cloud in mind, providing organizations with access to a wide range of cloud-native tools and services. Cloud deployment also allows organizations to leverage advanced analytics and machine learning capabilities, which are increasingly becoming critical components of modern business operations.
Application Insights
The IT & ITeS segment dominated the market in 2022 and accounted for a revenue share of more than 25.02%. The IT & ITeS industry is a key driver of innovation and is at the forefront of digital transformation. Open source technologies are flexible and customizable, making them an ideal fit for IT & ITeS applications. Moreover, open source solutions are often developed by communities, making them highly collaborative and transparent. This allows organizations to leverage the expertise of a vast network of developers and users to develop innovative solutions and address complex business challenges.
The BFSI segment is anticipated to register significant growth over the forecast period. The BFSI industry is highly regulated and requires robust, secure, and scalable technology solutions to manage large volumes of sensitive data. Open source solutions offer a transparent and collaborative approach to security, which allows organizations to identify and remediate vulnerabilities quickly. Moreover, open source solutions can be easily integrated with existing IT infrastructure, enabling BFSI organizations to modernize their technology stack without disrupting their operations.
End-user Insights
The large enterprises segment dominated the market in 2022 and accounted for a revenue share of more than 69.04%. Large enterprises have dominated the end-user segment owing to their ability to invest heavily in research and development, which allows them to leverage cutting-edge open source technologies and drive innovation within the market.
Large enterprises also have the resources to build and maintain internal teams of open source experts, which enables them to optimize their use of open source solutions and contribute to the community. In addition, large enterprises often have global operations and require solutions that can be easily scaled and localized to meet the needs of different regions and markets. Open source solutions provide the flexibility and customization required to address these challenges, making them an attractive option for large enterprises.
The Small & Medium Enterprises (SMEs) segment is anticipated to register the fastest growth over the forecast period. Open source solutions offer cost savings and reduce vendor lock-in, which is critical for SMEs with limited IT budgets and resources. Open source solutions often have lower upfront costs and provide greater flexibility to SMEs to optimize their IT spending. SMEs can leverage open source solutions to develop and implement innovative solutions quickly without being limited by the constraints of proprietary software.
Regional Insights
North America dominated the open source services industry in 2022 and accounted for a revenue share of more than 26.07%. The region has a strong culture of collaboration and innovation, which has helped to foster the growth of open source communities and networks of expertise.
Moreover, the region has a highly skilled and educated workforce, which has helped to drive the development and adoption of open source solutions across a wide range of industries. Furthermore, the region has well-established regulations and standards for data privacy and security, making it an attractive market for companies looking for secure and transparent open source solutions.
The Asia Pacific regional market is expected to emerge as the fastest-growing market over the forecast period. The region has a large and rapidly expanding technology market, with many companies and organizations looking for cost-effective and customizable solutions to meet their IT needs.
Open source solutions offer an attractive option for these companies, as they provide flexibility and scalability, as well as cost savings compared to proprietary software. The region has a large and growing pool of startups and entrepreneurs who are increasingly turning to open source solutions to drive innovation and growth.
Open Source Services Market Segmentations:
By Services
By Deployment
By Application
By End-user
By Regional
Chapter 1. Introduction
1.1. Research Objective
1.2. Scope of the Study
1.3. Definition
Chapter 2. Research Methodology
2.1. Research Approach
2.2. Data Sources
2.3. Assumptions & Limitations
Chapter 3. Executive Summary
3.1. Market Snapshot
Chapter 4. Market Variables and Scope
4.1. Introduction
4.2. Market Classification and Scope
4.3. Industry Value Chain Analysis
4.3.1. Raw Material Procurement Analysis
4.3.2. Sales and Distribution Channel Analysis
4.3.3. Downstream Buyer Analysis
Chapter 5. COVID 19 Impact on Open Source Services Market
5.1. COVID-19 Landscape: Open Source Services Industry Impact
5.2. COVID 19 - Impact Assessment for the Industry
5.3. COVID 19 Impact: Global Major Government Policy
5.4. Market Trends and Opportunities in the COVID-19 Landscape
Chapter 6. Market Dynamics Analysis and Trends
6.1. Market Dynamics
6.1.1. Market Drivers
6.1.2. Market Restraints
6.1.3. Market Opportunities
6.2. Porter’s Five Forces Analysis
6.2.1. Bargaining power of suppliers
6.2.2. Bargaining power of buyers
6.2.3. Threat of substitute
6.2.4. Threat of new entrants
6.2.5. Degree of competition
Chapter 7. Competitive Landscape
7.1.1. Company Market Share/Positioning Analysis
7.1.2. Key Strategies Adopted by Players
7.1.3. Vendor Landscape
7.1.3.1. List of Suppliers
7.1.3.2. List of Buyers
Chapter 8. Global Open Source Services Market, By Services
8.1. Open Source Services Market, by Services, 2023-2032
8.1.1. Integration & Deployment
8.1.1.1. Market Revenue and Forecast (2020-2032)
8.1.2. Training & Consulting
8.1.2.1. Market Revenue and Forecast (2020-2032)
8.1.3. Managed Services
8.1.3.1. Market Revenue and Forecast (2020-2032)
8.1.4. Support & Maintenance
8.1.4.1. Market Revenue and Forecast (2020-2032)
Chapter 9. Global Open Source Services Market, By Deployment
9.1. Open Source Services Market, by Deployment, 2023-2032
9.1.1. Cloud
9.1.1.1. Market Revenue and Forecast (2020-2032)
9.1.2. Hybrid
9.1.2.1. Market Revenue and Forecast (2020-2032)
9.1.3. On-premise
9.1.3.1. Market Revenue and Forecast (2020-2032)
Chapter 10. Global Open Source Services Market, By Application
10.1. Open Source Services Market, by Application, 2023-2032
10.1.1. BFSI
10.1.1.1. Market Revenue and Forecast (2020-2032)
10.1.2. Telecommunication & Media
10.1.2.1. Market Revenue and Forecast (2020-2032)
10.1.3. Industrial
10.1.3.1. Market Revenue and Forecast (2020-2032)
10.1.4. Retail & E-commerce
10.1.4.1. Market Revenue and Forecast (2020-2032)
10.1.5. Others
10.1.5.1. Market Revenue and Forecast (2020-2032)
Chapter 11. Global Open Source Services Market, By End-user
11.1. Open Source Services Market, by End-user, 2023-2032
11.1.1. Large Enterprises
11.1.1.1. Market Revenue and Forecast (2020-2032)
11.1.2. Small & Medium Enterprises
11.1.2.1. Market Revenue and Forecast (2020-2032)
Chapter 12. Global Open Source Services Market, Regional Estimates and Trend Forecast
12.1. North America
12.1.1. Market Revenue and Forecast, by Services (2020-2032)
12.1.2. Market Revenue and Forecast, by Deployment (2020-2032)
12.1.3. Market Revenue and Forecast, by Application (2020-2032)
12.1.4. Market Revenue and Forecast, by End-user (2020-2032)
12.1.5. U.S.
12.1.5.1. Market Revenue and Forecast, by Services (2020-2032)
12.1.5.2. Market Revenue and Forecast, by Deployment (2020-2032)
12.1.5.3. Market Revenue and Forecast, by Application (2020-2032)
12.1.5.4. Market Revenue and Forecast, by End-user (2020-2032)
12.1.6. Rest of North America
12.1.6.1. Market Revenue and Forecast, by Services (2020-2032)
12.1.6.2. Market Revenue and Forecast, by Deployment (2020-2032)
12.1.6.3. Market Revenue and Forecast, by Application (2020-2032)
12.1.6.4. Market Revenue and Forecast, by End-user (2020-2032)
12.2. Europe
12.2.1. Market Revenue and Forecast, by Services (2020-2032)
12.2.2. Market Revenue and Forecast, by Deployment (2020-2032)
12.2.3. Market Revenue and Forecast, by Application (2020-2032)
12.2.4. Market Revenue and Forecast, by End-user (2020-2032)
12.2.5. UK
12.2.5.1. Market Revenue and Forecast, by Services (2020-2032)
12.2.5.2. Market Revenue and Forecast, by Deployment (2020-2032)
12.2.5.3. Market Revenue and Forecast, by Application (2020-2032)
12.2.5.4. Market Revenue and Forecast, by End-user (2020-2032)
12.2.6. Germany
12.2.6.1. Market Revenue and Forecast, by Services (2020-2032)
12.2.6.2. Market Revenue and Forecast, by Deployment (2020-2032)
12.2.6.3. Market Revenue and Forecast, by Application (2020-2032)
12.2.6.4. Market Revenue and Forecast, by End-user (2020-2032)
12.2.7. France
12.2.7.1. Market Revenue and Forecast, by Services (2020-2032)
12.2.7.2. Market Revenue and Forecast, by Deployment (2020-2032)
12.2.7.3. Market Revenue and Forecast, by Application (2020-2032)
12.2.7.4. Market Revenue and Forecast, by End-user (2020-2032)
12.2.8. Rest of Europe
12.2.8.1. Market Revenue and Forecast, by Services (2020-2032)
12.2.8.2. Market Revenue and Forecast, by Deployment (2020-2032)
12.2.8.3. Market Revenue and Forecast, by Application (2020-2032)
12.2.8.4. Market Revenue and Forecast, by End-user (2020-2032)
12.3. APAC
12.3.1. Market Revenue and Forecast, by Services (2020-2032)
12.3.2. Market Revenue and Forecast, by Deployment (2020-2032)
12.3.3. Market Revenue and Forecast, by Application (2020-2032)
12.3.4. Market Revenue and Forecast, by End-user (2020-2032)
12.3.5. India
12.3.5.1. Market Revenue and Forecast, by Services (2020-2032)
12.3.5.2. Market Revenue and Forecast, by Deployment (2020-2032)
12.3.5.3. Market Revenue and Forecast, by Application (2020-2032)
12.3.5.4. Market Revenue and Forecast, by End-user (2020-2032)
12.3.6. China
12.3.6.1. Market Revenue and Forecast, by Services (2020-2032)
12.3.6.2. Market Revenue and Forecast, by Deployment (2020-2032)
12.3.6.3. Market Revenue and Forecast, by Application (2020-2032)
12.3.6.4. Market Revenue and Forecast, by End-user (2020-2032)
12.3.7. Japan
12.3.7.1. Market Revenue and Forecast, by Services (2020-2032)
12.3.7.2. Market Revenue and Forecast, by Deployment (2020-2032)
12.3.7.3. Market Revenue and Forecast, by Application (2020-2032)
12.3.7.4. Market Revenue and Forecast, by End-user (2020-2032)
12.3.8. Rest of APAC
12.3.8.1. Market Revenue and Forecast, by Services (2020-2032)
12.3.8.2. Market Revenue and Forecast, by Deployment (2020-2032)
12.3.8.3. Market Revenue and Forecast, by Application (2020-2032)
12.3.8.4. Market Revenue and Forecast, by End-user (2020-2032)
12.4. MEA
12.4.1. Market Revenue and Forecast, by Services (2020-2032)
12.4.2. Market Revenue and Forecast, by Deployment (2020-2032)
12.4.3. Market Revenue and Forecast, by Application (2020-2032)
12.4.4. Market Revenue and Forecast, by End-user (2020-2032)
12.4.5. GCC
12.4.5.1. Market Revenue and Forecast, by Services (2020-2032)
12.4.5.2. Market Revenue and Forecast, by Deployment (2020-2032)
12.4.5.3. Market Revenue and Forecast, by Application (2020-2032)
12.4.5.4. Market Revenue and Forecast, by End-user (2020-2032)
12.4.6. North Africa
12.4.6.1. Market Revenue and Forecast, by Services (2020-2032)
12.4.6.2. Market Revenue and Forecast, by Deployment (2020-2032)
12.4.6.3. Market Revenue and Forecast, by Application (2020-2032)
12.4.6.4. Market Revenue and Forecast, by End-user (2020-2032)
12.4.7. South Africa
12.4.7.1. Market Revenue and Forecast, by Services (2020-2032)
12.4.7.2. Market Revenue and Forecast, by Deployment (2020-2032)
12.4.7.3. Market Revenue and Forecast, by Application (2020-2032)
12.4.7.4. Market Revenue and Forecast, by End-user (2020-2032)
12.4.8. Rest of MEA
12.4.8.1. Market Revenue and Forecast, by Services (2020-2032)
12.4.8.2. Market Revenue and Forecast, by Deployment (2020-2032)
12.4.8.3. Market Revenue and Forecast, by Application (2020-2032)
12.4.8.4. Market Revenue and Forecast, by End-user (2020-2032)
12.5. Latin America
12.5.1. Market Revenue and Forecast, by Services (2020-2032)
12.5.2. Market Revenue and Forecast, by Deployment (2020-2032)
12.5.3. Market Revenue and Forecast, by Application (2020-2032)
12.5.4. Market Revenue and Forecast, by End-user (2020-2032)
12.5.5. Brazil
12.5.5.1. Market Revenue and Forecast, by Services (2020-2032)
12.5.5.2. Market Revenue and Forecast, by Deployment (2020-2032)
12.5.5.3. Market Revenue and Forecast, by Application (2020-2032)
12.5.5.4. Market Revenue and Forecast, by End-user (2020-2032)
12.5.6. Rest of LATAM
12.5.6.1. Market Revenue and Forecast, by Services (2020-2032)
12.5.6.2. Market Revenue and Forecast, by Deployment (2020-2032)
12.5.6.3. Market Revenue and Forecast, by Application (2020-2032)
12.5.6.4. Market Revenue and Forecast, by End-user (2020-2032)
Chapter 13. Company Profiles
13.1. Red Hat, Inc. (IBM)
13.1.1. Company Overview
13.1.2. Product Offerings
13.1.3. Financial Performance
13.1.4. Recent Initiatives
13.2. MuleSoft (Salesforce, Inc.)
13.2.1. Company Overview
13.2.2. Product Offerings
13.2.3. Financial Performance
13.2.4. Recent Initiatives
13.3. Amazon Web Services, Inc. (Amazon)
13.3.1. Company Overview
13.3.2. Product Offerings
13.3.3. Financial Performance
13.3.4. Recent Initiatives
13.4. Databricks
13.4.1. Company Overview
13.4.2. Product Offerings
13.4.3. Financial Performance
13.4.4. Recent Initiatives
13.5. HashiCorp
13.5.1. Company Overview
13.5.2. Product Offerings
13.5.3. Financial Performance
13.5.4. Recent Initiatives
13.6. Alphabet, Inc. (Google)
13.6.1. Company Overview
13.6.2. Product Offerings
13.6.3. Financial Performance
13.6.4. Recent Initiatives
13.7. Cisco
13.7.1. Company Overview
13.7.2. Product Offerings
13.7.3. Financial Performance
13.7.4. Recent Initiatives
13.8. Microsoft
13.8.1. Company Overview
13.8.2. Product Offerings
13.8.3. Financial Performance
13.8.4. Recent Initiatives
13.9. Oracle
13.9.1. Company Overview
13.9.2. Product Offerings
13.9.3. Financial Performance
13.9.4. Recent Initiatives
13.10. SAP SE
13.10.1. Company Overview
13.10.2. Product Offerings
13.10.3. Financial Performance
13.10.4. Recent Initiatives
Chapter 14. Research Methodology
14.1. Primary Research
14.2. Secondary Research
14.3. Assumptions
Chapter 15. Appendix
15.1. About Us
15.2. Glossary of Terms
 Cross-segment Market Size and Analysis for
Mentioned Segments
Additional Company Profiles (Upto 5 With No Cost)
Additional Countries (Apart From Mentioned Countries)
Country/Region-specific Report
Go To Market Strategy
Region Specific Market DynamicsRegion Level Market Share Import Export AnalysisProduction AnalysisOthers
Cross-segment Market Size and Analysis for
Mentioned Segments
Additional Company Profiles (Upto 5 With No Cost)
Additional Countries (Apart From Mentioned Countries)
Country/Region-specific Report
Go To Market Strategy
Region Specific Market DynamicsRegion Level Market Share Import Export AnalysisProduction AnalysisOthers