PaaS Market Size, Share, Growth, Trends | Report 2023-2032
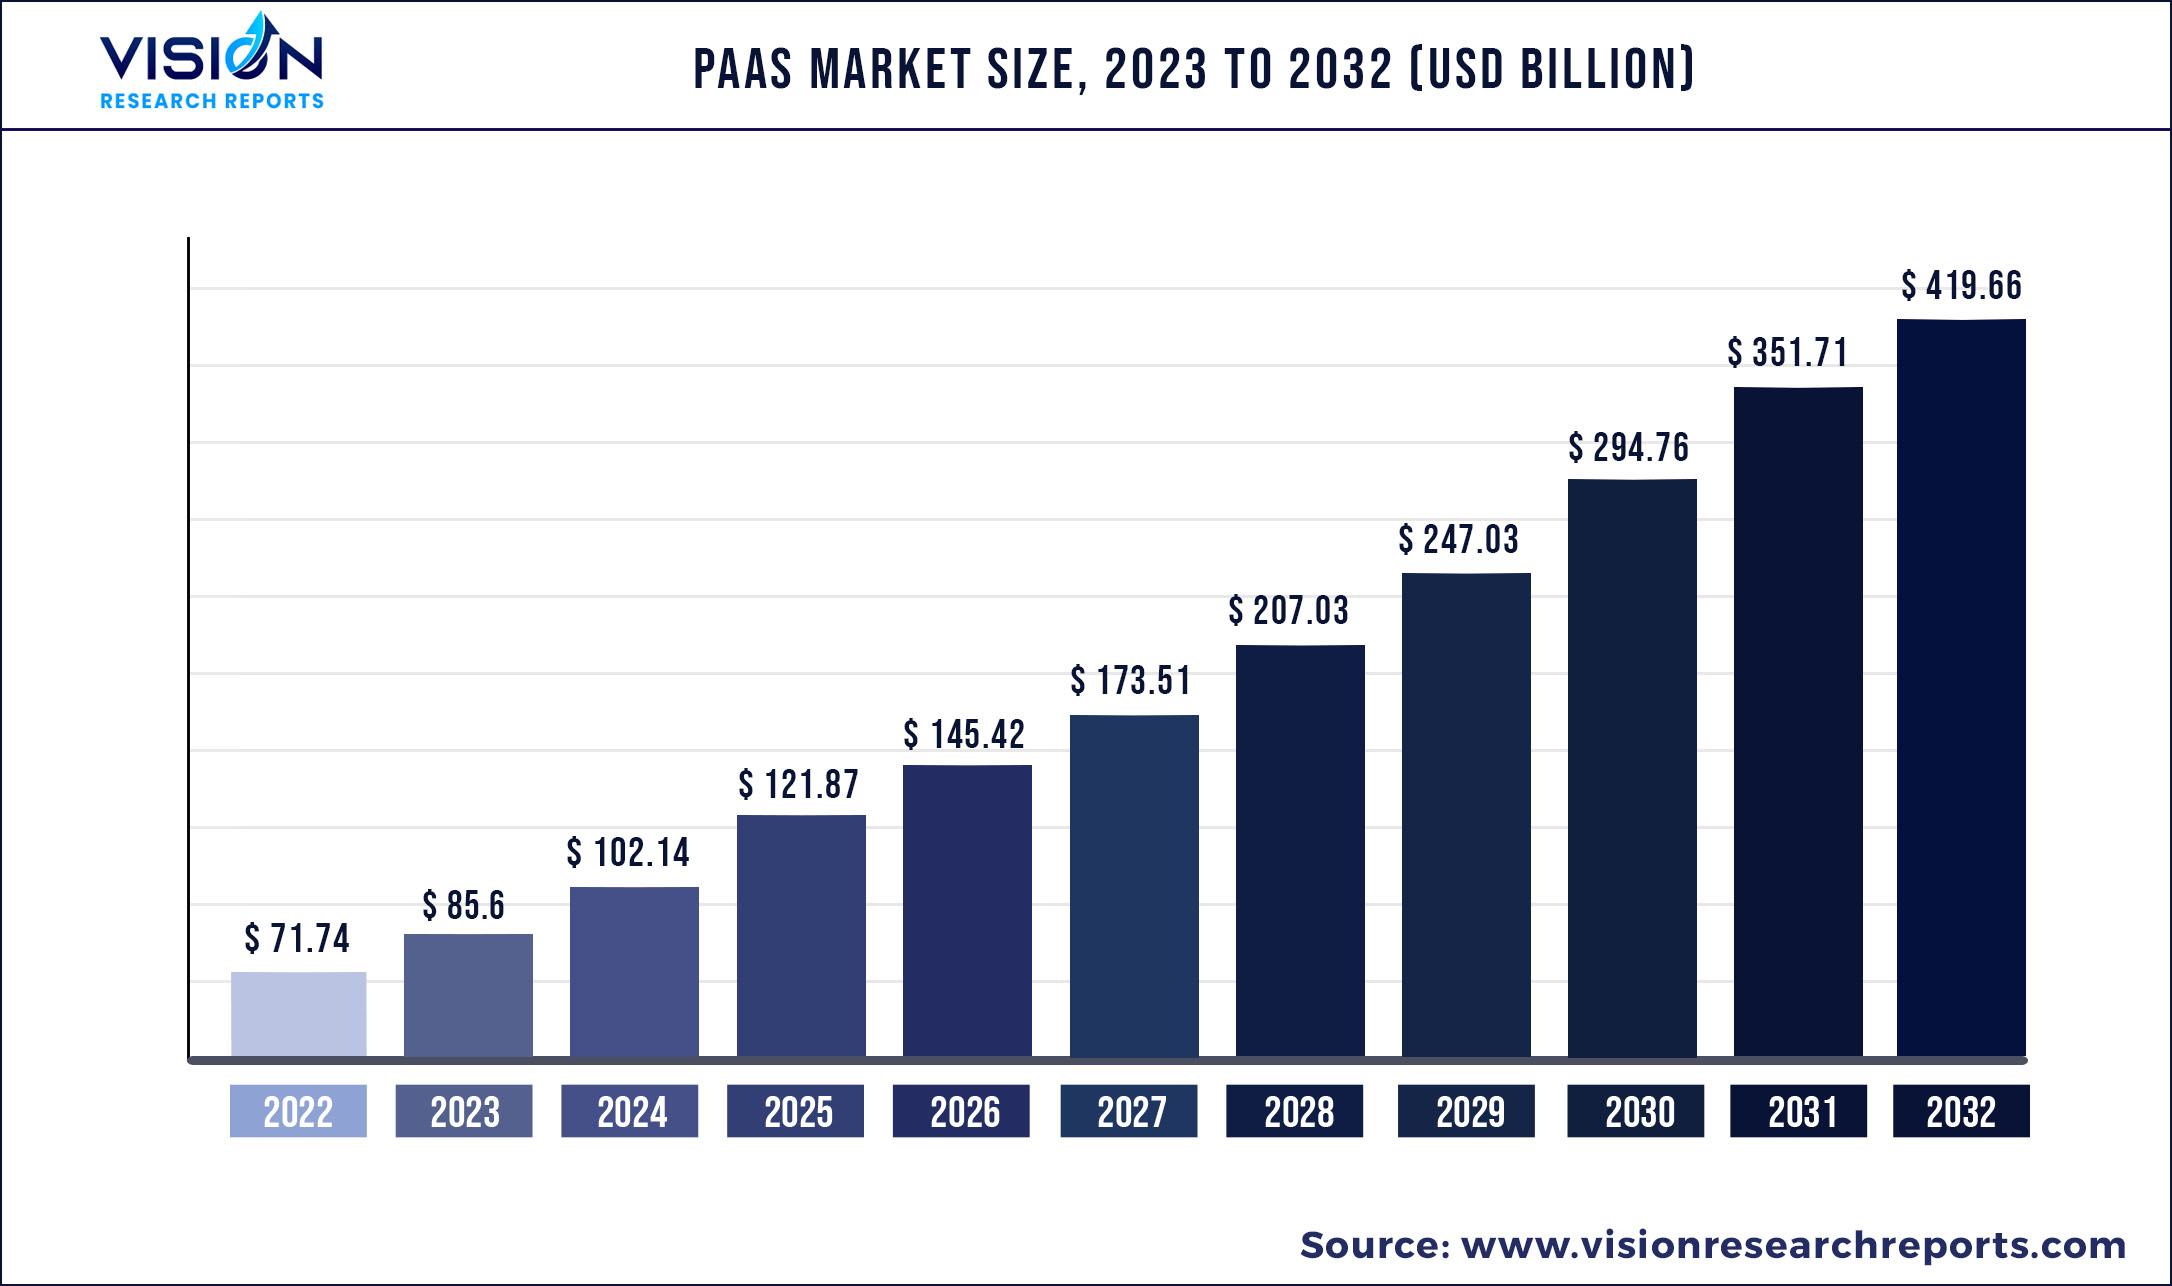
The global PaaS market was estimated at USD 71.74 billion in 2022 and it is expected to surpass around USD 419.66 billion by 2032, poised to grow at a CAGR of 19.32% from 2023 to 2032.
Key Pointers
Report Scope of the PaaS Market
| Report Coverage | Details |
| Market Size in 2022 | USD 71.74 billion |
| Revenue Forecast by 2032 | USD 419.66 billion |
| Growth rate from 2023 to 2032 | CAGR of 19.32% |
| Base Year | 2022 |
| Forecast Period | 2023 to 2032 |
| Market Analysis (Terms Used) | Value (US$ Million/Billion) or (Volume/Units) |
PaaS is a cloud service that provides a virtual environment to the developers for software development. The rising need to reduce the cost and time to market (TTM) of application development across the enterprises is one of the major factors that boost the market growth during the forecast period. Along with this, the rising adoption of cloud services among enterprises across the globe and the growing number of enterprises is fueling the growth of the market. However, the rising number of data breaches increases the privacy and security concerns that are projected to hinder market growth.
The speedy digitization across the globe results in increasing adoption of the Platform As a Service (PaaS) market, hence contributing to the market growth. Increasing usage of PaaS by enterprises as they are easily operational and cost-efficient and provide development tools and templates are fueling the market growth during the forecast period. The growing number of digital enterprises, combined with increased capital investment in the development of enterprise, web, and mobile applications, is expected to create lucrative opportunities for market growth. Moreover, the advancement of technology, such as AI capabilities and their integration, is further expected to present key opportunities for market expansion.
The significant increase in the adoption of cloud-based services for application development among enterprises is further projected to contribute to the growth of the market. It is effectively adopted by IT companies for faster development of applications and further deployment. Additionally, cloud services, such as PaaS, reduce the time and cost of developing software, thereby further encouraging their demand among large enterprises. Moreover, various advantages, such as ease of operation of PaaS, further raise the adoption among developers. For instance, in the PaaS system, the cloud service provider takes responsibility for the installation, configuration, and operation of the application infrastructure.
The COVID-19 pandemic positively impacted the PaaS market as many people opted to work from home during the lockdown. The lockdown imposed by the government has led to substantial growth in the adoption of virtual development platform services such as PaaS across various enterprises. The increased use of public cloud services during work from home has reinforced cloud adoption for the virtual development of software and applications. Therefore, the significant increase in the number of users of PaaS across the globe during the pandemic further augmented the market growth.
Key Companies & Market Share Insights
The PaaS industry is always changing and updating. To stay head-on in the market, key players tend to launch new strategies more frequently. Market players are focusing on increasing investments in the advancement of cloud services to increase the customer base. Moreover, major players are targeting new regions and demography to increase the revenue from the industry, by either entering the new market solely or by collaborating with local companies across the globe. Some of the prominent players in the global PaaS market include:
PaaS Market Segmentations:
| By Offering | Regions Segmentations |
|
Application Development Debugging Processes Testing Deployment Tools |
North America Europe Asia Pacific Central & South America Middle East & Africa |
Chapter 1. Introduction
1.1.Research Objective
1.2.Scope of the Study
1.3.Definition
Chapter 2. Research Methodology
2.1.Research Approach
2.2.Data Sources
2.3.Assumptions & Limitations
Chapter 3. Executive Summary
3.1.Market Snapshot
Chapter 4. Market Variables and Scope
4.1.Introduction
4.2.Market Classification and Scope
4.3.Industry Value Chain Analysis
4.3.1. Raw Material Procurement Analysis
4.3.2. Sales and Distribution Channel Analysis
4.3.3. Downstream Buyer Analysis
Chapter 5.COVID 19 Impact on PaaS Market
5.1. COVID-19 Landscape: PaaS Industry Impact
5.2. COVID 19 - Impact Assessment for the Industry
5.3. COVID 19 Impact: Global Major Government Policy
5.4.Market Trends and Opportunities in the COVID-19 Landscape
Chapter 6. Market Dynamics Analysis and Trends
6.1.Market Dynamics
6.1.1. Market Drivers
6.1.2. Market Restraints
6.1.3. Market Opportunities
6.2.Porter’s Five Forces Analysis
6.2.1. Bargaining power of suppliers
6.2.2. Bargaining power of buyers
6.2.3. Threat of substitute
6.2.4. Threat of new entrants
6.2.5. Degree of competition
Chapter 7. Competitive Landscape
7.1.1. Company Market Share/Positioning Analysis
7.1.2. Key Strategies Adopted by Players
7.1.3. Vendor Landscape
7.1.3.1.List of Suppliers
7.1.3.2.List of Buyers
Chapter 8. Global PaaS Market, By Offering
8.1.PaaS Market, by Offering Type, 2023-2032
8.1.1. Application Development
8.1.1.1.Market Revenue and Forecast (2020-2032)
8.1.2. Debugging Processes
8.1.2.1.Market Revenue and Forecast (2020-2032)
8.1.3. Testing
8.1.3.1.Market Revenue and Forecast (2020-2032)
8.1.4. Deployment Tools
8.1.4.1.Market Revenue and Forecast (2020-2032)
Chapter 9. Global PaaS Market, Regional Estimates and Trend Forecast
9.1. North America
9.1.1. Market Revenue and Forecast, by Offering (2020-2032)
9.1.2. U.S.
9.1.2.1. Market Revenue and Forecast, by Offering (2020-2032)
9.1.3. Rest of North America
9.1.3.1. Market Revenue and Forecast, by Offering (2020-2032)
9.2. Europe
9.2.1. Market Revenue and Forecast, by Offering (2020-2032)
9.2.2. UK
9.2.2.1. Market Revenue and Forecast, by Offering (2020-2032)
9.2.3. Germany
9.2.3.1. Market Revenue and Forecast, by Offering (2020-2032)
9.2.4. France
9.2.4.1. Market Revenue and Forecast, by Offering (2020-2032)
9.2.5. Rest of Europe
9.2.5.1. Market Revenue and Forecast, by Offering (2020-2032)
9.3. APAC
9.3.1. Market Revenue and Forecast, by Offering (2020-2032)
9.3.2. India
9.3.2.1. Market Revenue and Forecast, by Offering (2020-2032)
9.3.3. China
9.3.3.1. Market Revenue and Forecast, by Offering (2020-2032)
9.3.4. Japan
9.3.4.1. Market Revenue and Forecast, by Offering (2020-2032)
9.3.5. Rest of APAC
9.3.5.1. Market Revenue and Forecast, by Offering (2020-2032)
9.4. MEA
9.4.1. Market Revenue and Forecast, by Offering (2020-2032)
9.4.2. GCC
9.4.2.1. Market Revenue and Forecast, by Offering (2020-2032)
9.4.3. North Africa
9.4.3.1. Market Revenue and Forecast, by Offering (2020-2032)
9.4.4. South Africa
9.4.4.1. Market Revenue and Forecast, by Offering (2020-2032)
9.4.5. Rest of MEA
9.4.5.1. Market Revenue and Forecast, by Offering (2020-2032)
9.5. Latin America
9.5.1. Market Revenue and Forecast, by Offering (2020-2032)
9.5.2. Brazil
9.5.2.1. Market Revenue and Forecast, by Offering (2020-2032)
9.5.3. Rest of LATAM
9.5.3.1. Market Revenue and Forecast, by Offering (2020-2032)
Chapter 10.Company Profiles
10.1. Amazon Web Services Inc.
10.1.1.Company Overview
10.1.2.Product Offerings
10.1.3.Financial Performance
10.1.4.Recent Initiatives
10.2. Microsoft Corp.
10.2.1.Company Overview
10.2.2.Product Offerings
10.2.3.Financial Performance
10.2.4.Recent Initiatives
10.3. Alibaba Cloud
10.3.1.Company Overview
10.3.2.Product Offerings
10.3.3.Financial Performance
10.3.4.Recent Initiatives
10.4. IBM Corp.
10.4.1.Company Overview
10.4.2.Product Offerings
10.4.3.Financial Performance
10.4.4.Recent Initiatives
10.5. Google LLC
10.5.1.Company Overview
10.5.2.Product Offerings
10.5.3.Financial Performance
10.5.4.Recent Initiatives
10.6. Salesforce
10.6.1.Company Overview
10.6.2.Product Offerings
10.6.3.Financial Performance
10.6.4.Recent Initiatives
10.7. Oracle Corp.
10.7.1.Company Overview
10.7.2.Product Offerings
10.7.3.Financial Performance
10.7.4.Recent Initiatives
10.8. SAP SE
10.8.1.Company Overview
10.8.2.Product Offerings
10.8.3.Financial Performance
10.8.4.Recent Initiatives
10.9. Zoho Corp.
10.9.1.Company Overview
10.9.2.Product Offerings
10.9.3.Financial Performance
10.9.4.Recent Initiatives
10.10. Vmware Inc.
10.10.1. Company Overview
10.10.2. Product Offerings
10.10.3. Financial Performance
10.10.4. Recent Initiatives
Chapter 11.Research Methodology
11.1.Primary Research
11.2.Secondary Research
11.3.Assumptions
Chapter 12.Appendix
12.1. About Us
12.2. Glossary of Terms
 Cross-segment Market Size and Analysis for
Mentioned Segments
Additional Company Profiles (Upto 5 With No Cost)
Additional Countries (Apart From Mentioned Countries)
Country/Region-specific Report
Go To Market Strategy
Region Specific Market DynamicsRegion Level Market Share Import Export AnalysisProduction AnalysisOthers
Cross-segment Market Size and Analysis for
Mentioned Segments
Additional Company Profiles (Upto 5 With No Cost)
Additional Countries (Apart From Mentioned Countries)
Country/Region-specific Report
Go To Market Strategy
Region Specific Market DynamicsRegion Level Market Share Import Export AnalysisProduction AnalysisOthers