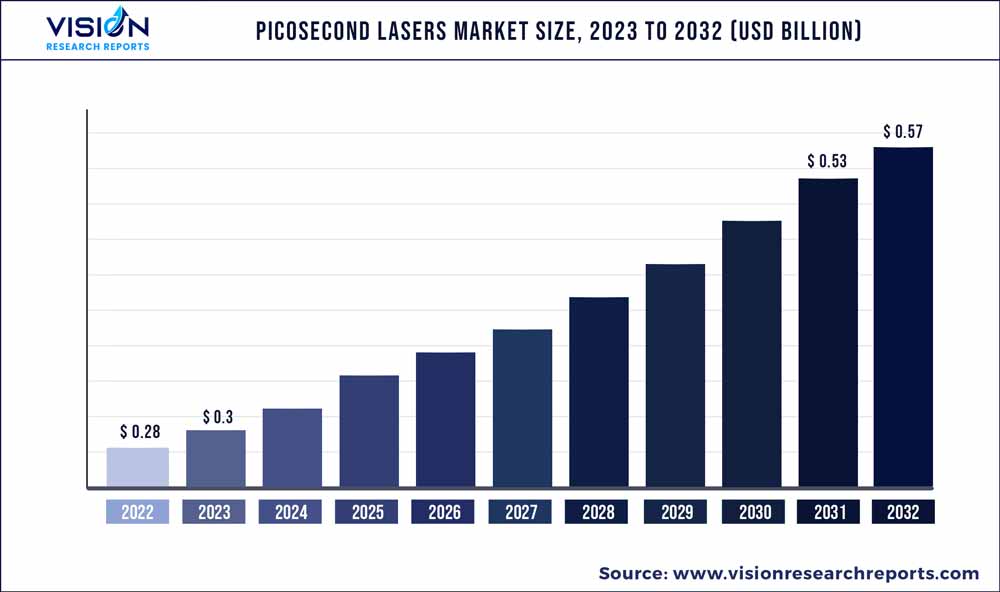
The global picosecond lasers market was estimated at USD 0.28 billion in 2022 and it is expected to surpass around USD 0.57 billion by 2032, poised to grow at a CAGR of 7.45% from 2023 to 2032. The picosecond lasers market in the United States was accounted for USD 88.1 million in 2022.

Key Pointers
Report Scope of the Picosecond Lasers Market
| Report Coverage | Details |
| Revenue Share of North America in 2022 | 48% |
| CAGR of Asia Pacific from 2023 to 2032 | 8.44% |
| Revenue Forecast by 2032 | USD 0.57 billion |
| Growth Rate from 2023 to 2032 | CAGR of 7.45% |
| Base Year | 2022 |
| Forecast Period | 2023 to 2032 |
| Market Analysis (Terms Used) | Value (US$ Million/Billion) or (Volume/Units) |
| Companies Covered | Cynosure, LLC.; Cutera; Candela Corporation; Rohrer Aesthetics, Inc.; Beijing ADSS Development Co., Ltd; Fotona; Lutronic; El.En. S.p.A. Cod.; Alma Laser (Sisram Medical) |
Picosecond laser belongs to the category of ultrafast lasers, which emit optical pulses between 1 picosecond to some tens of picoseconds. The market is expected to witness growth due to several factors such as an increase in procedures for tattoo removal, recognition of picosecond lasers as a treatment for various dermatological ailments such as melasma & solar lentigines, and growing awareness and adoption of non-invasive aesthetic treatment. In addition, compared to traditional lasers, picosecond lasers offer shorter pulse durations, which minimize heat buildup in the skin and reduce the risk of adverse effects. It allows patients to undergo treatments with less downtime and discomfort.
The pandemic hurt the picosecond lasers industry. Various voluntary patient procedures were halted, which negatively impacted the growth. Elective surgical cosmetic procedures were halted for 8.1 weeks in 2020 within the U.S., resulting in lower patient turnout. For instance, as per the American Society of Plastic Surgeons, laser tattoo removal procedures performed in the U.S. decreased by 7% in 2020 than in 2019. However, the market recovered from the pandemic losses due to changing customer perception levels. As per the American Society of Plastic Surgeons survey in 2020, 11% of respondents indicated higher adoption of cosmetic surgeries in 2021 and in the coming years.
The growing number of tattoo removal procedures is expected to drive market growth. The prevalence of “tattoo regret” in millennials propels the need for picosecond lasers. For instance, in August 2019, Dermatology & Laser Surgery Center stated that an estimated 30% of U.S. adults have one or more tattoos. However, 25% of them indicated to remove those tattoos. In addition, the growing medical literature approves using these lasers for this dermatological condition with significant effectivity and safety recorded in patient trials.
The increasing recognition of picosecond lasers to treat various dermatological conditions and the integration of different laser types in a single product aids the market growth of picosecond lasers. For instance, a trial conducted by the American Society of Laser Medicine and Surgery, Inc. between April 2021 and January 2023 stated a mean improvement of 26% to 50% in patients suffering from café-au-lait macules when treated with PicoWay 730nm. Moreover, market leaders are upgrading their established products to increase their efficiency and treat various dermatological conditions.
Technology Insights
The ND:YAG segment dominated the picosecond laser industry with a revenue share of 64% in 2022. ND:YAG or neodymium-doped yttrium aluminum garnet crystal emits 532 nm and 1064nm lasers along with a combination of unique wavelengths to treat different dermatological conditions and procedures. For example, ND:YAG picosecond lasers working at 1064-532 nm effectively remove tattoos with minimal or no scarring across skin types and tattoo colors. In addition, these lasers assure fewer sessions with significant visual improvements than that of other laser systems in the market.
The alexandrite segment is estimated to witness the fastest CAGR of 7.84% during the forecast period. The growth of the segment can be attributed to the increasing medical literature supporting the use of alexandrite lasers to treat post-inflammatory hyperpigmentation (PIH). For instance, in July 2021, Dove Press Ltd published a study concluding that a 755-nm alexandrite picosecond laser in conjunction with a diffractive lens offers significant improvement in PIH treatment. Similarly, the laser proved efficacious in the treatment of melasma in Asian patients.
Application Insights
Based on application, the market for picosecond lasers is segmented into tattoo removal, pigmented lesions, skin rejuvenation, melasma, and others. Tattoo removal dominated the market with a revenue share of 42% in 2022 and is estimated to grow at the fastest CAGR of 8.33% during the forecast period. Picosecond lasers are distinguished as a “gold-standard” laser for removing tattoos of different colors and skin types. The shorter pulse duration offered by picosecond lasers improves its efficacy during the process. Furthermore, tattoo removal was conferred as “1a” according to the level of evidence, thereby confirming their use in the marketplace.
Moreover, pigmented lesions application is expected to offer significant growth opportunities during the forecast period. According to the article published in the Korean Society for Laser Medicine and Surgery, a 250-picosecond laser was deemed effective in treating pigmented lesions. Furthermore, the study indicated that using a low wavelength picosecond laser to treat pigmented lesions offers better results; thereby, manufacturers are anticipated to target their product launch in this wavelength to improve clinical outcomes from a picosecond laser.
End-use Insights
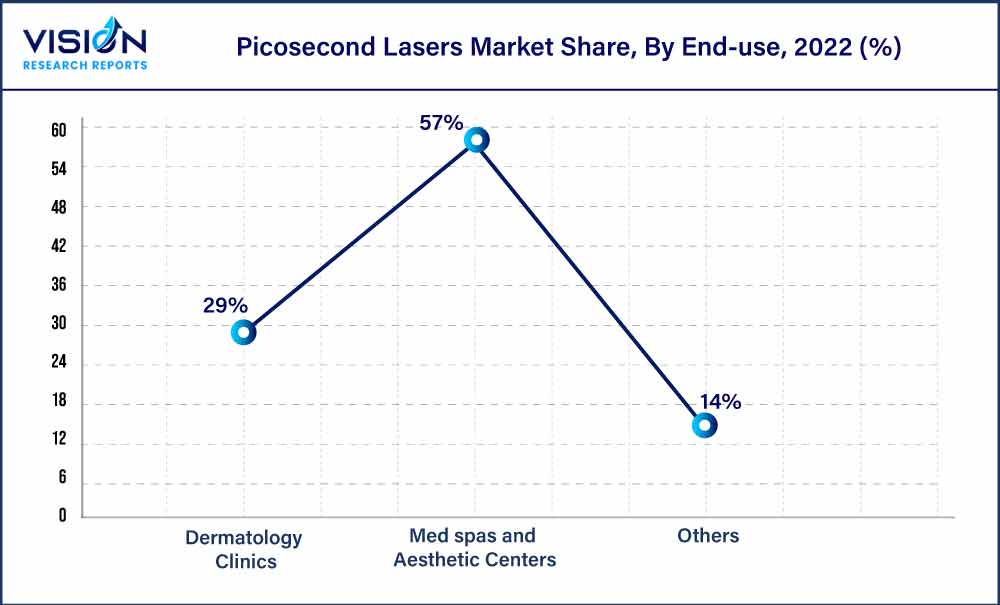
Based on end-use, the picosecond laser market is segmented into dermatology clinics, med spas & aesthetic centers, and others. Med spas & aesthetic centers dominated the market with the largest revenue share of 57% in 2022. The segment is estimated to grow at the fastest CAGR of 8.0% during the forecast period. Medical spas offer various benefits for cosmetic procedures such as skin rejuvenation, acne treatment, and others.

Moreover, according to American Med Spa Association (AMSA), a significant increase in demand has been noticed for minimally invasive treatments such as tattoo removal and skin enhancement. Furthermore, the growing single-ownership trend in the med spas aids the segment growth. For instance, as per the ASMA report in 2022, an estimated 66% of medical spas in the country were deemed under a single owner, with a majority of ownership under non-MD/surgeons.
Regional Insights
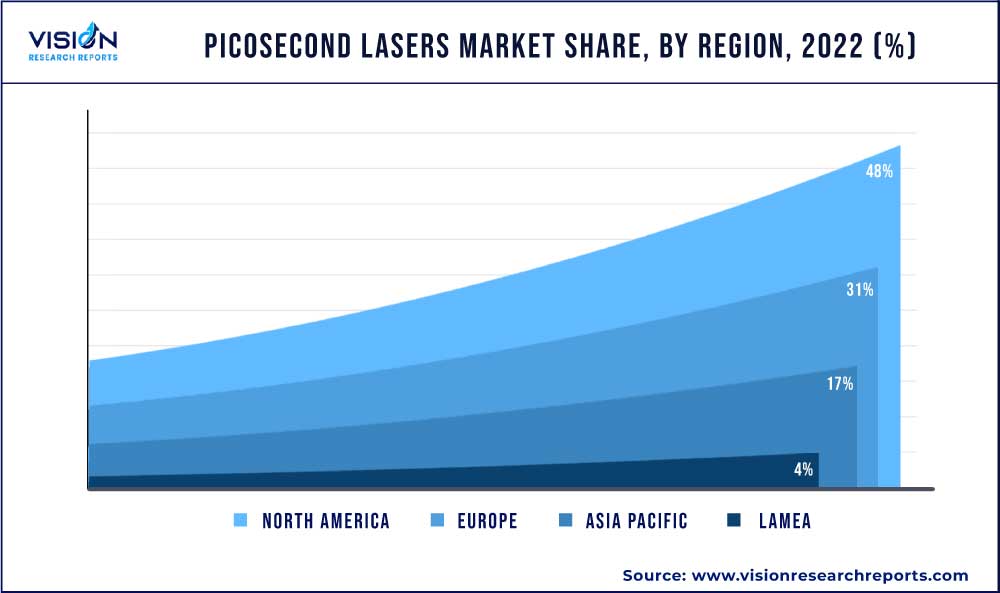
North America dominated the global picosecond laser Industry with a revenue share of 48% in 2022. This share is attributed to the high acceptance rate for cosmetic surgeries amongst the population, technological advancements in both surgical and non-surgical techniques, and accessibility and availability of skilled professionals for different dermatological conditions. For instance, according to the American Society of Plastic Surgeons, an estimated 215,898 laser tattoo removal procedures were performed in the U.S. in 2019. In addition, an estimated 997,245 laser skin resurfacing procedures were performed in 2020 in the U.S.

The Asia Pacific region is expected to witness the fastest CAGR of 8.44% over the forecast period. The growth of the regional market can be attributed to the increasing importance of physical appearance, increasing penetration of social media in lifestyle, and technological advancements. For instance, as per Japan Today’s article in 2022, a significant increase in tattoo removal was noticed among the Vietnamese post-Japan’s removal of COVID-19 restrictions.
Picosecond Lasers Market Segmentations:
By Technology
By Application
By End-use
By Regional
Chapter 1. Introduction
1.1. Research Objective
1.2. Scope of the Study
1.3. Definition
Chapter 2. Research Methodology
2.1. Research Approach
2.2. Data Sources
2.3. Assumptions & Limitations
Chapter 3. Executive Summary
3.1. Market Snapshot
Chapter 4. Market Variables and Scope
4.1. Introduction
4.2. Market Classification and Scope
4.3. Industry Value Chain Analysis
4.3.1. Raw Material Procurement Analysis
4.3.2. Sales and Distribution Technology Analysis
4.3.3. Downstream Buyer Analysis
Chapter 5. COVID 19 Impact on Picosecond Lasers Market
5.1. COVID-19 Landscape: Picosecond Lasers Industry Impact
5.2. COVID 19 - Impact Assessment for the Industry
5.3. COVID 19 Impact: Global Major Government Policy
5.4. Market Trends and Opportunities in the COVID-19 Landscape
Chapter 6. Market Dynamics Analysis and Trends
6.1. Market Dynamics
6.1.1. Market Drivers
6.1.2. Market Restraints
6.1.3. Market Opportunities
6.2. Porter’s Five Forces Analysis
6.2.1. Bargaining power of suppliers
6.2.2. Bargaining power of buyers
6.2.3. Threat of substitute
6.2.4. Threat of new entrants
6.2.5. Degree of competition
Chapter 7. Competitive Landscape
7.1.1. Company Market Share/Positioning Analysis
7.1.2. Key Strategies Adopted by Players
7.1.3. Vendor Landscape
7.1.3.1. List of Suppliers
7.1.3.2. List of Buyers
Chapter 8. Global Picosecond Lasers Market, By Technology
8.1. Picosecond Lasers Market, by Technology, 2023-2032
8.1.1 ND:YAG
8.1.1.1. Market Revenue and Forecast (2020-2032)
8.1.2. Alexandrite
8.1.2.1. Market Revenue and Forecast (2020-2032)
Chapter 9. Global Picosecond Lasers Market, By Application
9.1. Picosecond Lasers Market, by Application, 2023-2032
9.1.1. Tattoo Removal
9.1.1.1. Market Revenue and Forecast (2020-2032)
9.1.2. Pigmented Lesions
9.1.2.1. Market Revenue and Forecast (2020-2032)
9.1.3. Skin Rejuvenation
9.1.3.1. Market Revenue and Forecast (2020-2032)
9.1.4. Melasma
9.1.4.1. Market Revenue and Forecast (2020-2032)
9.1.5. Others
9.1.5.1. Market Revenue and Forecast (2020-2032)
Chapter 10. Global Picosecond Lasers Market, By End-use
10.1. Picosecond Lasers Market, by End-use, 2023-2032
10.1.1. Dermatology Clinics
10.1.1.1. Market Revenue and Forecast (2020-2032)
10.1.2. Med spas and Aesthetic Centers
10.1.2.1. Market Revenue and Forecast (2020-2032)
10.1.3. Others
10.1.3.1. Market Revenue and Forecast (2020-2032)
Chapter 11. Global Picosecond Lasers Market, Regional Estimates and Trend Forecast
11.1. North America
11.1.1. Market Revenue and Forecast, by Technology (2020-2032)
11.1.2. Market Revenue and Forecast, by Application (2020-2032)
11.1.3. Market Revenue and Forecast, by End-use (2020-2032)
11.1.4. U.S.
11.1.4.1. Market Revenue and Forecast, by Technology (2020-2032)
11.1.4.2. Market Revenue and Forecast, by Application (2020-2032)
11.1.4.3. Market Revenue and Forecast, by End-use (2020-2032)
11.1.5. Rest of North America
11.1.5.1. Market Revenue and Forecast, by Technology (2020-2032)
11.1.5.2. Market Revenue and Forecast, by Application (2020-2032)
11.1.5.3. Market Revenue and Forecast, by End-use (2020-2032)
11.2. Europe
11.2.1. Market Revenue and Forecast, by Technology (2020-2032)
11.2.2. Market Revenue and Forecast, by Application (2020-2032)
11.2.3. Market Revenue and Forecast, by End-use (2020-2032)
11.2.4. UK
11.2.4.1. Market Revenue and Forecast, by Technology (2020-2032)
11.2.4.2. Market Revenue and Forecast, by Application (2020-2032)
11.2.4.3. Market Revenue and Forecast, by End-use (2020-2032)
11.2.5. Germany
11.2.5.1. Market Revenue and Forecast, by Technology (2020-2032)
11.2.5.2. Market Revenue and Forecast, by Application (2020-2032)
11.2.5.3. Market Revenue and Forecast, by End-use (2020-2032)
11.2.6. France
11.2.6.1. Market Revenue and Forecast, by Technology (2020-2032)
11.2.6.2. Market Revenue and Forecast, by Application (2020-2032)
11.2.6.3. Market Revenue and Forecast, by End-use (2020-2032)
11.2.7. Rest of Europe
11.2.7.1. Market Revenue and Forecast, by Technology (2020-2032)
11.2.7.2. Market Revenue and Forecast, by Application (2020-2032)
11.2.7.3. Market Revenue and Forecast, by End-use (2020-2032)
11.3. APAC
11.3.1. Market Revenue and Forecast, by Technology (2020-2032)
11.3.2. Market Revenue and Forecast, by Application (2020-2032)
11.3.3. Market Revenue and Forecast, by End-use (2020-2032)
11.3.4. India
11.3.4.1. Market Revenue and Forecast, by Technology (2020-2032)
11.3.4.2. Market Revenue and Forecast, by Application (2020-2032)
11.3.4.3. Market Revenue and Forecast, by End-use (2020-2032)
11.3.5. China
11.3.5.1. Market Revenue and Forecast, by Technology (2020-2032)
11.3.5.2. Market Revenue and Forecast, by Application (2020-2032)
11.3.5.3. Market Revenue and Forecast, by End-use (2020-2032)
11.3.6. Japan
11.3.6.1. Market Revenue and Forecast, by Technology (2020-2032)
11.3.6.2. Market Revenue and Forecast, by Application (2020-2032)
11.3.6.3. Market Revenue and Forecast, by End-use (2020-2032)
11.3.7. Rest of APAC
11.3.7.1. Market Revenue and Forecast, by Technology (2020-2032)
11.3.7.2. Market Revenue and Forecast, by Application (2020-2032)
11.3.7.3. Market Revenue and Forecast, by End-use (2020-2032)
11.4. MEA
11.4.1. Market Revenue and Forecast, by Technology (2020-2032)
11.4.2. Market Revenue and Forecast, by Application (2020-2032)
11.4.3. Market Revenue and Forecast, by End-use (2020-2032)
11.4.4. GCC
11.4.4.1. Market Revenue and Forecast, by Technology (2020-2032)
11.4.4.2. Market Revenue and Forecast, by Application (2020-2032)
11.4.4.3. Market Revenue and Forecast, by End-use (2020-2032)
11.4.5. North Africa
11.4.5.1. Market Revenue and Forecast, by Technology (2020-2032)
11.4.5.2. Market Revenue and Forecast, by Application (2020-2032)
11.4.5.3. Market Revenue and Forecast, by End-use (2020-2032)
11.4.6. South Africa
11.4.6.1. Market Revenue and Forecast, by Technology (2020-2032)
11.4.6.2. Market Revenue and Forecast, by Application (2020-2032)
11.4.6.3. Market Revenue and Forecast, by End-use (2020-2032)
11.4.7. Rest of MEA
11.4.7.1. Market Revenue and Forecast, by Technology (2020-2032)
11.4.7.2. Market Revenue and Forecast, by Application (2020-2032)
11.4.7.3. Market Revenue and Forecast, by End-use (2020-2032)
11.5. Latin America
11.5.1. Market Revenue and Forecast, by Technology (2020-2032)
11.5.2. Market Revenue and Forecast, by Application (2020-2032)
11.5.3. Market Revenue and Forecast, by End-use (2020-2032)
11.5.4. Brazil
11.5.4.1. Market Revenue and Forecast, by Technology (2020-2032)
11.5.4.2. Market Revenue and Forecast, by Application (2020-2032)
11.5.4.3. Market Revenue and Forecast, by End-use (2020-2032)
11.5.5. Rest of LATAM
11.5.5.1. Market Revenue and Forecast, by Technology (2020-2032)
11.5.5.2. Market Revenue and Forecast, by Application (2020-2032)
11.5.5.3. Market Revenue and Forecast, by End-use (2020-2032)
Chapter 12. Company Profiles
12.1. Cynosure, LLC.
12.1.1. Company Overview
12.1.2. Product Offerings
12.1.3. Financial Performance
12.1.4. Recent Initiatives
12.2. Cutera
12.2.1. Company Overview
12.2.2. Product Offerings
12.2.3. Financial Performance
12.2.4. Recent Initiatives
12.3. Candela Corporation
12.3.1. Company Overview
12.3.2. Product Offerings
12.3.3. Financial Performance
12.3.4. Recent Initiatives
12.4. Rohrer Aesthetics, Inc.
12.4.1. Company Overview
12.4.2. Product Offerings
12.4.3. Financial Performance
12.4.4. Recent Initiatives
12.5. Beijing ADSS Development Co., Ltd
12.5.1. Company Overview
12.5.2. Product Offerings
12.5.3. Financial Performance
12.5.4. Recent Initiatives
12.6. Fotona
12.6.1. Company Overview
12.6.2. Product Offerings
12.6.3. Financial Performance
12.6.4. Recent Initiatives
12.7. Lutronic
12.7.1. Company Overview
12.7.2. Product Offerings
12.7.3. Financial Performance
12.7.4. Recent Initiatives
12.8. El.En. S.p.A. Cod.
12.8.1. Company Overview
12.8.2. Product Offerings
12.8.3. Financial Performance
12.8.4. Recent Initiatives
12.9. Alma Laser (Sisram Medical)
12.9.1. Company Overview
12.9.2. Product Offerings
12.9.3. Financial Performance
12.9.4. Recent Initiatives
Chapter 13. Research Methodology
13.1. Primary Research
13.2. Secondary Research
13.3. Assumptions
Chapter 14. Appendix
14.1. About Us
14.2. Glossary of Terms
 Cross-segment Market Size and Analysis for
Mentioned Segments
 Additional Company Profiles (Upto 5 With No Cost)
 Additional Countries (Apart From Mentioned Countries)
 Country/Region-specific Report
 Go To Market Strategy
 Region Specific Market Dynamics
 Region Level Market Share
 Import Export Analysis
 Production Analysis
 Others