Postpartum Products Market Size, Share | Report 2023-2032
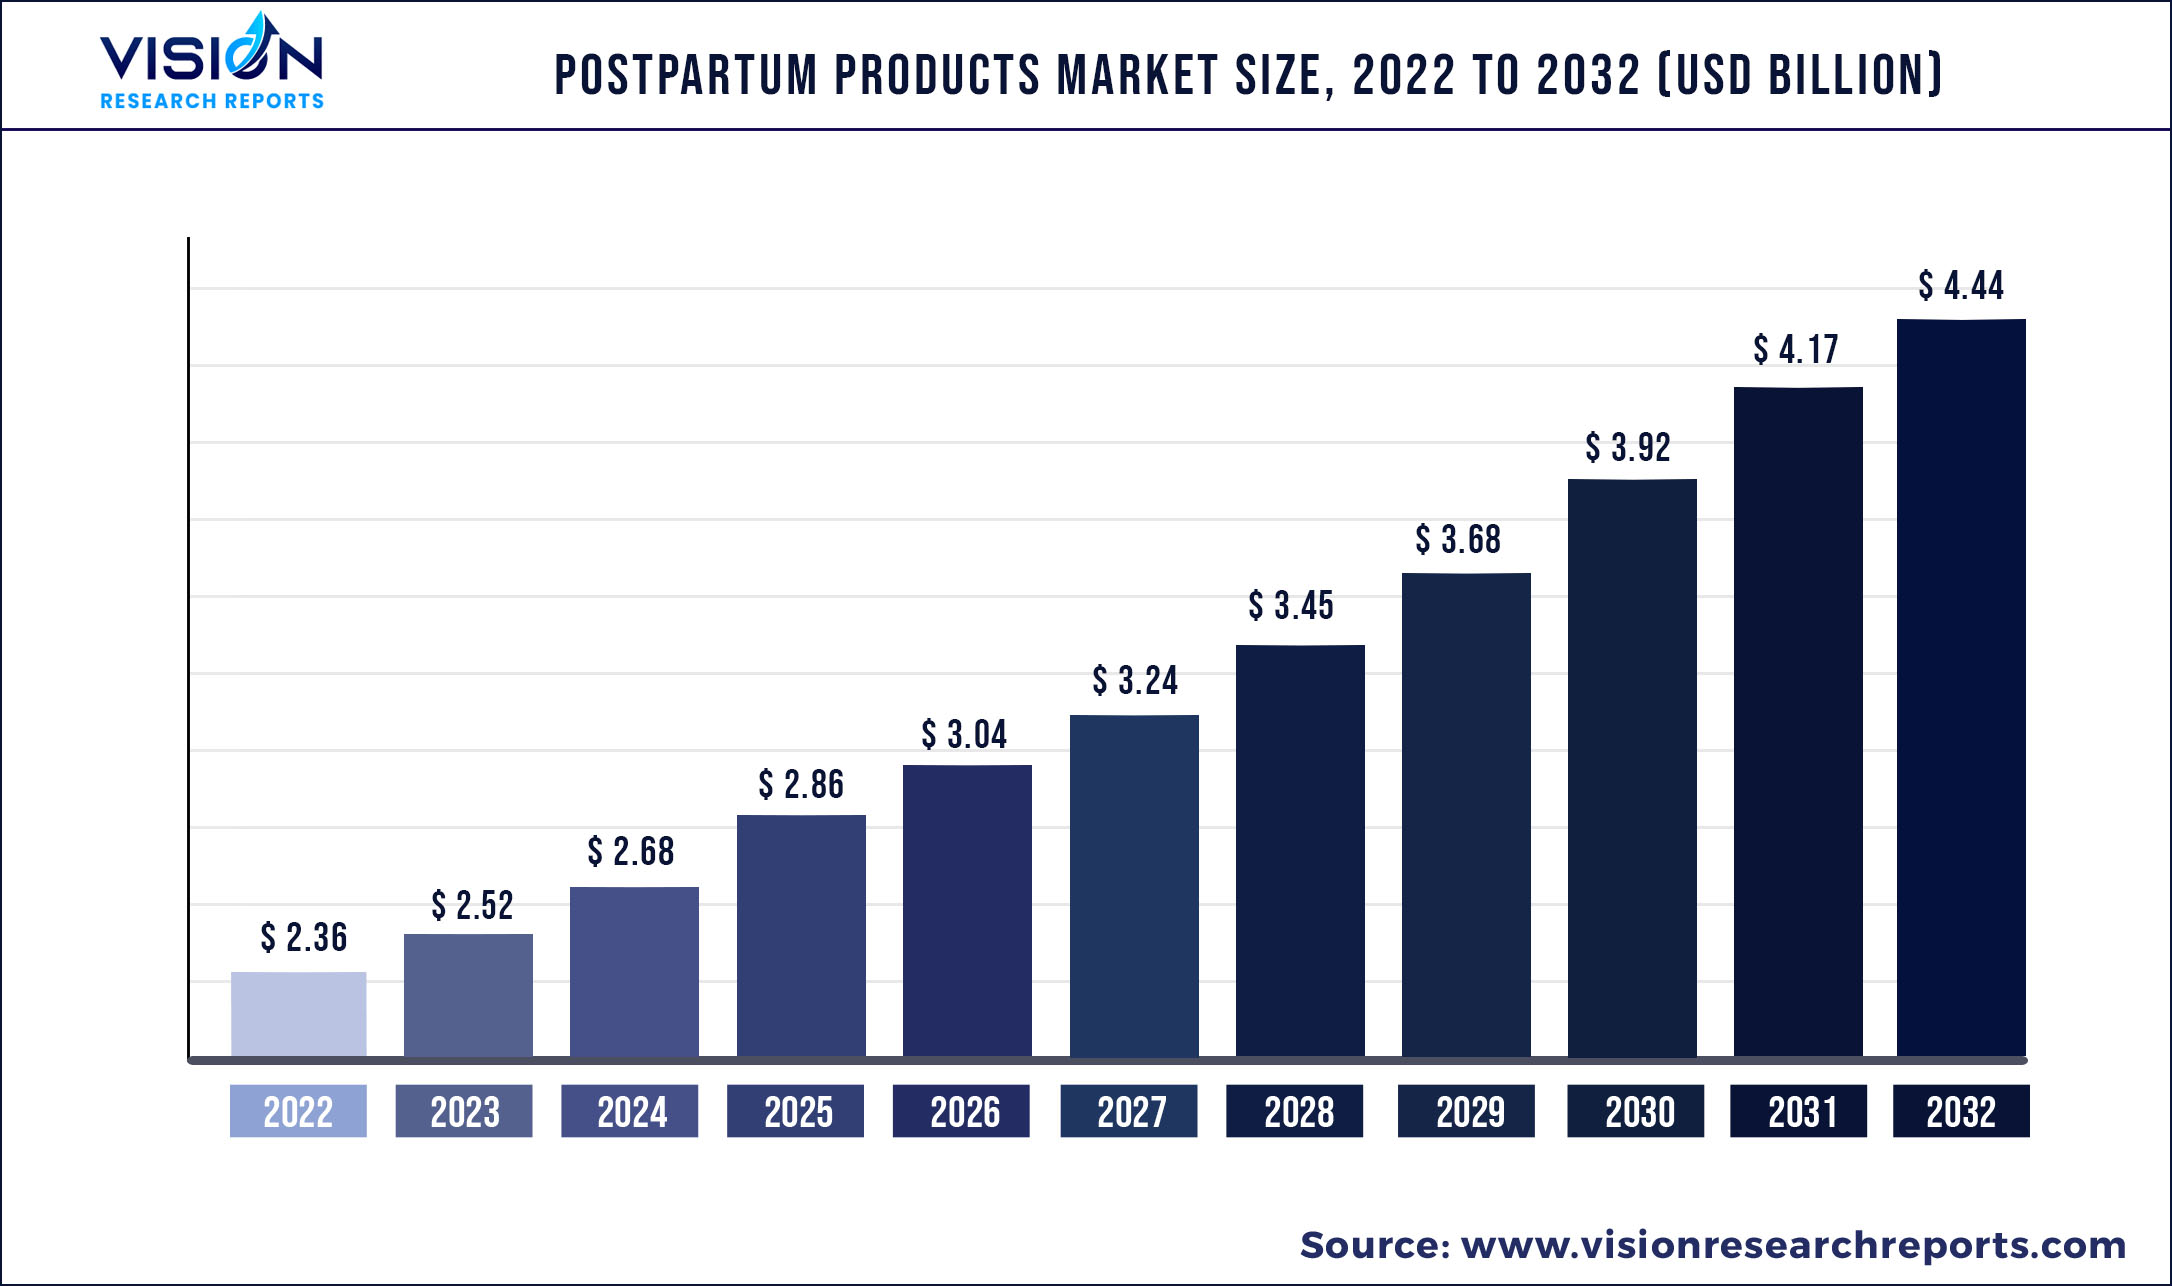
The global postpartum products market size was estimated at around USD 2.36 billion in 2022 and it is projected to hit around USD 4.44 billion by 2032, growing at a CAGR of 6.52% from 2023 to 2032.
Key Pointers
| Report Coverage | Details |
| Market Size in 2022 | USD 2.36 billion |
| Revenue Forecast by 2032 | USD 4.44 billion |
| Growth rate from 2023 to 2032 | CAGR of 6.52% |
| Base Year | 2022 |
| Forecast Period | 2023 to 2032 |
| Regions Covered | North America, Europe, Asia Pacific, Latin America, Middle East & Africa |
| Companies Covered | Koninklijke Philips N.V., Medela LLC, Newell Brands, AMEDA, NUBY, May born Group Limited, Edge well Personal Care, Handi-Craft Company (Dr. Brown’s), Artsana S.P.A, Medline. |
The worldwide surge in women’s employment rate and growing consumer awareness about postpartum products coupled with development in healthcare infrastructure in emerging economies is expected to positively impact the postpartum products market growth during the forecast period. However, owing to the current outbreak of COVID-19, the market is expected to witness slow growth for a short period. Demand for these products has decreased as many companies are facing short-term operational issues owing to supply chain constraints (restrictions at international borders).
An increase in women’s employment rate is expected to be a high-impact rendering driver of the postpartum products market. Increased involvement of women in the workforce is making them more self-sustainable and financially strong, leading to the adoption of quality healthcare products for them and their babies, which, in turn, is fueling the postpartum products market growth. As per the International Labor Office (ILO), there has been visual progress in terms of employment opportunities and gender equality over the past 20 years.
ILO initiated the 2030 UN agenda, which aims to empower all women and girls, for achieving productive employment, and likely to have equal pay without discrimination to achieve gender equality. Thus, increasing global women employment rates and government initiatives in support of employed mothers are expected to drive demand for postpartum products during the forecast period.
In addition, lactating mothers also focus on their skincare and physical appearance post-pregnancy, which is encouraging adoption of the postpartum care products. Various other issues associated with post-pregnancy include skin pigmentation, stretch marks, varicose veins, or adult acnes. As a result, the demand for postpartum products such as stressed leg creams, nipple protection creams, lotions & gels, and body restructuring products is also increasing, thus, contributing to the postpartum products market growth in the forecast period.
Moreover, growing consumer awareness to get body shape and functions back to normal and supportive initiatives being undertaken by governments and companies for breastfeeding across the world are the factors anticipated to propel the demand for postpartum products throughout the forecast period.
Postpartum Products Market Segmentations:
By Product
By Sales Channel
Chapter 1. Introduction
1.1. Research Objective
1.2. Scope of the Study
1.3. Definition
Chapter 2. Research Methodology
2.1. Research Approach
2.2. Data Sources
2.3. Assumptions & Limitations
Chapter 3. Executive Summary
3.1. Market Snapshot
Chapter 4. Market Variables and Scope
4.1. Introduction
4.2. Market Classification and Scope
4.3. Industry Value Chain Analysis
4.3.1. Raw Material Procurement Analysis
4.3.2. Sales and Distribution Channel Analysis
4.3.3. Downstream Buyer Analysis
Chapter 5. COVID 19 Impact on Postpartum Products Market
5.1. COVID-19 Landscape: Postpartum Products Industry Impact
5.2. COVID 19 - Impact Assessment for the Industry
5.3. COVID 19 Impact: Global Major Government Policy
5.4. Market Trends and Opportunities in the COVID-19 Landscape
Chapter 6. Market Dynamics Analysis and Trends
6.1. Market Dynamics
6.1.1. Market Drivers
6.1.2. Market Restraints
6.1.3. Market Opportunities
6.2. Porter’s Five Forces Analysis
6.2.1. Bargaining power of suppliers
6.2.2. Bargaining power of buyers
6.2.3. Threat of substitute
6.2.4. Threat of new entrants
6.2.5. Degree of competition
Chapter 7. Competitive Landscape
7.1.1. Company Market Share/Positioning Analysis
7.1.2. Key Strategies Adopted by Players
7.1.3. Vendor Landscape
7.1.3.1. List of Suppliers
7.1.3.2. List of Buyers
Chapter 8. Global Postpartum Products Market, By Product
8.1. Postpartum Products Market, by Product, 2023-2032
8.1.1. Breastfeeding Accessories
8.1.1.1. Market Revenue and Forecast (2019-2032)
8.1.2. Perineal Cooling Pads
8.1.2.1. Market Revenue and Forecast (2019-2032)
8.1.3. Others
8.1.3.1. Market Revenue and Forecast (2019-2032)
Chapter 9. Global Postpartum Products Market, By Sales Channel
9.1. Postpartum Products Market, by Sales Channel, 2023-2032
9.1.1. Hospital Pharmacy (Inpatient)
9.1.1.1. Market Revenue and Forecast (2019-2032)
9.1.2. Retail Store
9.1.2.1. Market Revenue and Forecast (2019-2032)
9.1.3. E-Commerce
9.1.3.1. Market Revenue and Forecast (2019-2032)
9.1.4. Wholesaler/Distributor
9.1.4.1. Market Revenue and Forecast (2019-2032)
9.1.5. Direct Purchase
9.1.5.1. Market Revenue and Forecast (2019-2032)
Chapter 10. Global Postpartum Products Market, Regional Estimates and Trend Forecast
10.1. North America
10.1.1. Market Revenue and Forecast, by Product (2019-2032)
10.1.2. Market Revenue and Forecast, by Sales Channel (2019-2032)
10.1.3. U.S.
10.1.3.1. Market Revenue and Forecast, by Product (2019-2032)
10.1.3.2. Market Revenue and Forecast, by Sales Channel (2019-2032)
10.1.4. Rest of North America
10.1.4.1. Market Revenue and Forecast, by Product (2019-2032)
10.1.4.2. Market Revenue and Forecast, by Sales Channel (2019-2032)
10.2. Europe
10.2.1. Market Revenue and Forecast, by Product (2019-2032)
10.2.2. Market Revenue and Forecast, by Sales Channel (2019-2032)
10.2.3. UK
10.2.3.1. Market Revenue and Forecast, by Product (2019-2032)
10.2.3.2. Market Revenue and Forecast, by Sales Channel (2019-2032)
10.2.4. Germany
10.2.4.1. Market Revenue and Forecast, by Product (2019-2032)
10.2.4.2. Market Revenue and Forecast, by Sales Channel (2019-2032)
10.2.5. France
10.2.5.1. Market Revenue and Forecast, by Product (2019-2032)
10.2.5.2. Market Revenue and Forecast, by Sales Channel (2019-2032)
10.2.6. Rest of Europe
10.2.6.1. Market Revenue and Forecast, by Product (2019-2032)
10.2.6.2. Market Revenue and Forecast, by Sales Channel (2019-2032)
10.3. APAC
10.3.1. Market Revenue and Forecast, by Product (2019-2032)
10.3.2. Market Revenue and Forecast, by Sales Channel (2019-2032)
10.3.3. India
10.3.3.1. Market Revenue and Forecast, by Product (2019-2032)
10.3.3.2. Market Revenue and Forecast, by Sales Channel (2019-2032)
10.3.4. China
10.3.4.1. Market Revenue and Forecast, by Product (2019-2032)
10.3.4.2. Market Revenue and Forecast, by Sales Channel (2019-2032)
10.3.5. Japan
10.3.5.1. Market Revenue and Forecast, by Product (2019-2032)
10.3.5.2. Market Revenue and Forecast, by Sales Channel (2019-2032)
10.3.6. Rest of APAC
10.3.6.1. Market Revenue and Forecast, by Product (2019-2032)
10.3.6.2. Market Revenue and Forecast, by Sales Channel (2019-2032)
10.4. MEA
10.4.1. Market Revenue and Forecast, by Product (2019-2032)
10.4.2. Market Revenue and Forecast, by Sales Channel (2019-2032)
10.4.3. GCC
10.4.3.1. Market Revenue and Forecast, by Product (2019-2032)
10.4.3.2. Market Revenue and Forecast, by Sales Channel (2019-2032)
10.4.4. North Africa
10.4.4.1. Market Revenue and Forecast, by Product (2019-2032)
10.4.4.2. Market Revenue and Forecast, by Sales Channel (2019-2032)
10.4.5. South Africa
10.4.5.1. Market Revenue and Forecast, by Product (2019-2032)
10.4.5.2. Market Revenue and Forecast, by Sales Channel (2019-2032)
10.4.6. Rest of MEA
10.4.6.1. Market Revenue and Forecast, by Product (2019-2032)
10.4.6.2. Market Revenue and Forecast, by Sales Channel (2019-2032)
10.5. Latin America
10.5.1. Market Revenue and Forecast, by Product (2019-2032)
10.5.2. Market Revenue and Forecast, by Sales Channel (2019-2032)
10.5.3. Brazil
10.5.3.1. Market Revenue and Forecast, by Product (2019-2032)
10.5.3.2. Market Revenue and Forecast, by Sales Channel (2019-2032)
10.5.4. Rest of LATAM
10.5.4.1. Market Revenue and Forecast, by Product (2019-2032)
10.5.4.2. Market Revenue and Forecast, by Sales Channel (2019-2032)
Chapter 11. Company Profiles
11.1. Koninklijke Philips N.V.
11.1.1. Company Overview
11.1.2. Product Offerings
11.1.3. Financial Performance
11.1.4. Recent Initiatives
11.2. Medela LLC
11.2.1. Company Overview
11.2.2. Product Offerings
11.2.3. Financial Performance
11.2.4. Recent Initiatives
11.3. Newell Brands
11.3.1. Company Overview
11.3.2. Product Offerings
11.3.3. Financial Performance
11.3.4. Recent Initiatives
11.4. AMEDA
11.4.1. Company Overview
11.4.2. Product Offerings
11.4.3. Financial Performance
11.4.4. LTE Scientific
11.5. NUBY
11.5.1. Company Overview
11.5.2. Product Offerings
11.5.3. Financial Performance
11.5.4. Recent Initiatives
11.6. May born Group Limited
11.6.1. Company Overview
11.6.2. Product Offerings
11.6.3. Financial Performance
11.6.4. Recent Initiatives
11.7. Edge well Personal Care
11.7.1. Company Overview
11.7.2. Product Offerings
11.7.3. Financial Performance
11.7.4. Recent Initiatives
11.8. Handi-Craft Company (Dr. Brown’s)
11.8.1. Company Overview
11.8.2. Product Offerings
11.8.3. Financial Performance
11.8.4. Recent Initiatives
11.9. Artsana S.P.A
11.9.1. Company Overview
11.9.2. Product Offerings
11.9.3. Financial Performance
11.9.4. Recent Initiatives
11.10. Medline.
11.10.1. Company Overview
11.10.2. Product Offerings
11.10.3. Financial Performance
11.10.4. Recent Initiatives
Chapter 12. Research Methodology
12.1. Primary Research
12.2. Secondary Research
12.3. Assumptions
Chapter 13. Appendix
13.1. About Us
13.2. Glossary of Terms
 Cross-segment Market Size and Analysis for
Mentioned Segments
Additional Company Profiles (Upto 5 With No Cost)
Additional Countries (Apart From Mentioned Countries)
Country/Region-specific Report
Go To Market Strategy
Region Specific Market DynamicsRegion Level Market Share Import Export AnalysisProduction AnalysisOthers
Cross-segment Market Size and Analysis for
Mentioned Segments
Additional Company Profiles (Upto 5 With No Cost)
Additional Countries (Apart From Mentioned Countries)
Country/Region-specific Report
Go To Market Strategy
Region Specific Market DynamicsRegion Level Market Share Import Export AnalysisProduction AnalysisOthers