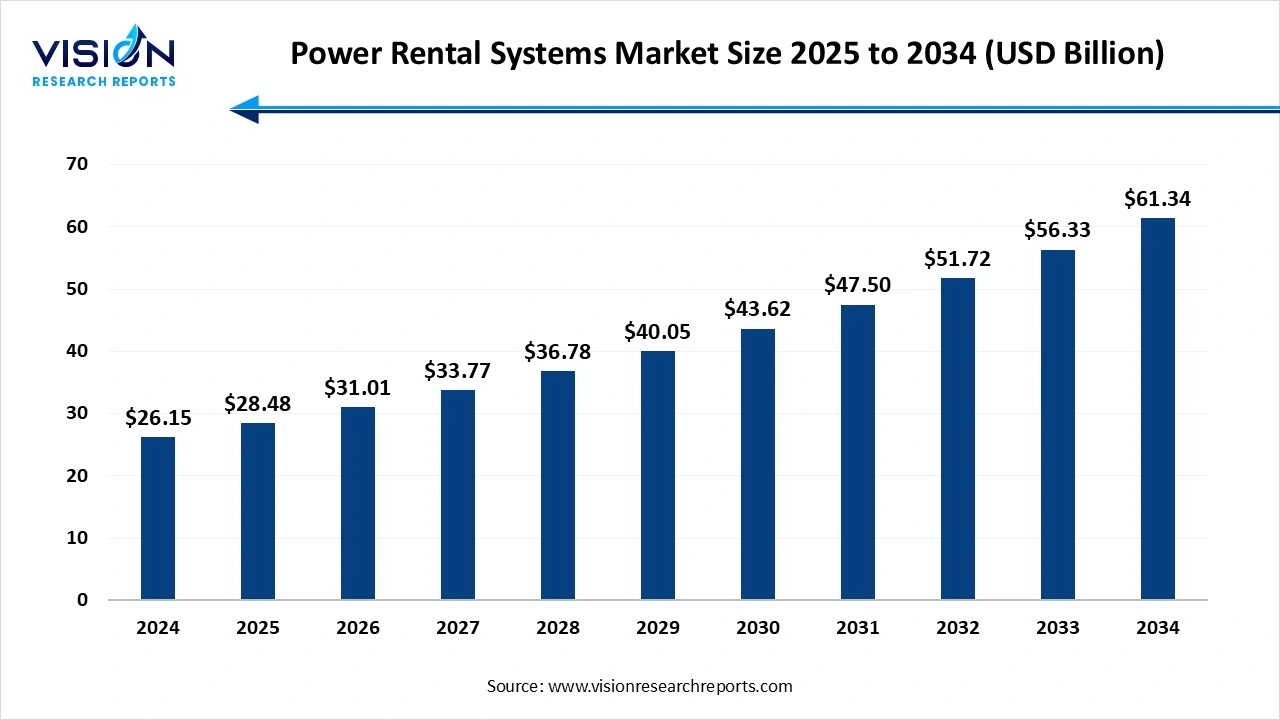
The global power rental systems market size was evaluated at around USD 26.15 billion in 2024 and it is projected to hit around USD 61.34 billion by 2034, growing at a CAGR of 8.90% from 2025 to 2034. Market is growth driven by the rising demand for continuous and reliable power supply across construction, mining, and oil & gas sectors, the power rental systems market is experiencing significant growth.

The global power rental systems market is experiencing steady growth, driven by the rising demand for reliable and uninterrupted power supply across various sectors such as construction, oil & gas, mining, manufacturing, and events. These systems offer temporary power solutions during grid failures, peak shaving, and equipment maintenance, making them essential in both developed and emerging economies. The growing frequency of power outages, especially in regions with inadequate infrastructure, further boosts the need for rental power solutions. Technological advancements in generator efficiency, hybrid systems, and emission control are also contributing to the expansion of the market.
The growth of the power rental systems market is primarily fueled by the increasing need for uninterrupted power supply in industries where downtime can lead to significant financial losses. Sectors such as construction, oil & gas, mining, and manufacturing often operate in remote or underdeveloped areas with limited access to grid power, making rental power systems a crucial solution. Additionally, frequent power outages due to aging grid infrastructure, natural disasters, and rising energy demands in developing economies have accelerated the adoption of rental generators and associated equipment.
Another key driver is the growing preference for operational flexibility and cost-efficiency. Renting power equipment eliminates the need for heavy capital investments and ongoing maintenance costs, which appeals to businesses looking to optimize resources. Moreover, technological advancements in hybrid power systems and emission-compliant generators have made rental solutions more efficient and environmentally sustainable.
One of the primary challenges faced by the power rental systems market is the stringent environmental regulations related to emissions and noise pollution. Diesel generators, which form a significant portion of rental systems, are under scrutiny for their environmental impact, especially in urban and sensitive areas. Compliance with varying regional standards, such as EPA Tier 4 in the U.S. or Euro Stage V in Europe, increases the cost of equipment and limits market flexibility. Additionally, the rising global emphasis on carbon neutrality and clean energy is pressuring rental providers to transition toward eco-friendly alternatives, which require significant capital investment and technological upgrades.
Another major challenge is the high operational and logistical costs associated with transportation, installation, and maintenance of rental systems, particularly in remote or difficult-to-access locations. These costs can be prohibitive for small and medium-scale enterprises that seek short-term power solutions.
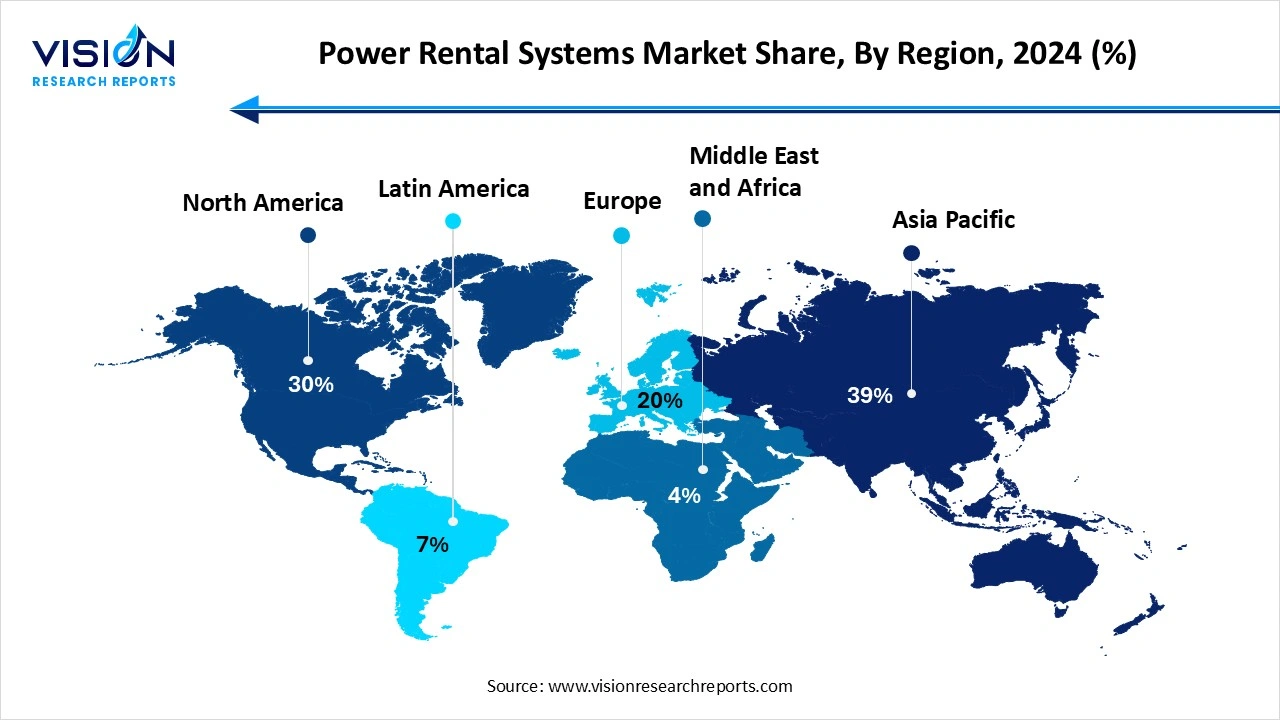
The Asia Pacific power rental systems market held the largest share of the global market, accounting for 39% in 2024. Emerging economies like India, China, and Southeast Asian countries are investing heavily in construction and energy sectors, where rental power systems play a vital role in bridging gaps in electricity supply. Frequent power outages and grid instability in some rural and semi-urban areas further enhance market demand.
 The power rental systems market in North America is projected to experience significant growth throughout the forecast period. The region also experiences frequent natural disasters like hurricanes and wildfires, which increase the need for emergency power solutions. Moreover, the U.S. and Canada have a well-established rental service ecosystem, supported by advanced technologies and strong regulatory frameworks that ensure the widespread use of environmentally compliant rental equipment.
The continuous power applications led the market, contributing the highest revenue share of 46% in 2024. These include sectors such as manufacturing, healthcare, data centers, oil & gas, and utilities, where even minor disruptions can lead to critical losses or safety hazards. Continuous power rental systems serve as reliable primary power sources in regions with unstable grids or in remote areas without grid access. They are widely used to support infrastructure development, remote site operations, and emergency services, ensuring seamless operations under all conditions.
The peak shaving applications are projected to expand at a CAGR of 9.4% during the forecast period. Peak shaving refers to the temporary use of additional power rental units during periods of high electricity demand to avoid excessive utility charges or to prevent overloading of permanent systems. This application is particularly useful for commercial and industrial customers who aim to manage energy costs effectively without expanding permanent capacity.
The government and utilities segment dominated the market, capturing the highest revenue share of 26% in 2024. Governments often rely on rental power systems for infrastructure development projects, military operations, emergency relief efforts, and disaster response scenarios where immediate and reliable electricity is vital. Additionally, public utilities use rental systems during planned maintenance, grid upgrades, or unexpected power outages to ensure uninterrupted power supply to communities. These solutions help prevent service disruptions and maintain public safety, particularly during critical events or natural calamities.
The event management segment is anticipated to grow at a CAGR of 9.2% between 2025 and 2034. The event management segment also represents a significant share of the power rental systems market, fueled by the increasing number of large-scale events such as concerts, sports tournaments, festivals, exhibitions, and corporate gatherings. These events often take place in temporary or outdoor venues that lack access to grid power, making rental systems a necessary solution for lighting, sound systems, broadcasting, and other electrical needs. Organizers prefer power rental services due to their reliability, ease of installation, and ability to cater to varying power loads based on event size and duration.
By Application
By End-use
By Regional
Chapter 1. Introduction
1.1. Research Objective
1.2. Scope of the Study
1.3. Definition
Chapter 2. Research Methodology
2.1. Research Approach
2.2. Data Sources
2.3. Assumptions & Limitations
Chapter 3. Executive Summary
3.1. Market Snapshot
Chapter 4. Market Variables and Scope
4.1. Introduction
4.2. Market Classification and Scope
4.3. Industry Value Chain Analysis
4.3.1. Raw Material Procurement Analysis
4.3.2. Sales and Distribution Channel Analysis
4.3.3. Downstream Buyer Analysis
Chapter 5. COVID 19 Impact on Power Rental Systems Market
5.1. COVID-19 Landscape: Power Rental Systems r Industry Impact
5.2. COVID 19 - Impact Assessment for the Industry
5.3. COVID 19 Impact: Major Government Policy
5.4. Market Trends and Opportunities in the COVID-19 Landscape
Chapter 6. Market Dynamics Analysis and Trends
6.1. Market Dynamics
6.1.1. Market Drivers
6.1.2. Market Restraints
6.1.3. Market Opportunities
6.2. Porter’s Five Forces Analysis
6.2.1. Bargaining power of suppliers
6.2.2. Bargaining power of buyers
6.2.3. Threat of substitute
6.2.4. Threat of new entrants
6.2.5. Degree of competition
Chapter 7. Competitive Landscape
7.1.1. Company Market Share/Positioning Analysis
7.1.2. Key Strategies Adopted by Players
7.1.3. Vendor Landscape
7.1.3.1. List of Suppliers
7.1.3.2. List of Buyers
Chapter 8. Power Rental Systems Market, By Application
8.1. Power Rental Systems Market, by Application, 2024-2033
8.1.1. Peak Shaving
8.1.1.1. Market Revenue and Forecast (2021-2033)
8.1.2. Continuous Power
8.1.2.1. Market Revenue and Forecast (2021-2033)
8.1.3. Standby
8.1.3.1. Market Revenue and Forecast (2021-2033)
Chapter 9. Power Rental Systems Market, By End-use
9.1. Power Rental Systems Market, by End-use, 2024-2033
9.1.1. Government and Utilities
9.1.1.1. Market Revenue and Forecast (2021-2033)
9.1.2. Oil & Gas
9.1.2.1. Market Revenue and Forecast (2021-2033)
9.1.3. Construction
9.1.3.1. Market Revenue and Forecast (2021-2033)
9.1.4. Industrial
9.1.4.1. Market Revenue and Forecast (2021-2033)
9.1.5. Event Management
9.1.5.1. Market Revenue and Forecast (2021-2033)
9.1.6. Others
9.1.6.1. Market Revenue and Forecast (2021-2033)
Chapter 10. U.S. Pharmaceutical Water Market, Regional Estimates and Trend Forecast
10.1. U.S.
10.1.1. Market Revenue and Forecast, by Application (2021-2033)
10.1.2. Market Revenue and Forecast, by End-use (2021-2033)
Chapter 11. Company Profiles
11.1 Caterpillar Inc.
11.1.1. Company Overview
11.1.2. Product Offerings
11.1.3. Financial Performance
11.1.4. Recent Initiatives
11.2. United Rentals, Inc.
11.2.1. Company Overview
11.2.2. Product Offerings
11.2.3. Financial Performance
11.2.4. Recent Initiatives
11.3. Ashtead Group plc (Sunbelt Rentals
11.3.1. Company Overview
11.3.2. Product Offerings
11.3.3. Financial Performance
11.3.4. Recent Initiatives
11.4. Herc Rentals Inc
11.4.1. Company Overview
11.4.2. Product Offerings
11.4.3. Financial Performance
11.4.4. LTE Scientific
11.5. Atlas Copco AB
11.5.1. Company Overview
11.5.2. Product Offerings
11.5.3. Financial Performance
11.5.4. Recent Initiatives
11.6. APR Energy
11.6.1. Company Overview
11.6.2. Product Offerings
11.6.3. Financial Performance
11.6.4. Recent Initiatives
11.7. Generac Power Systems, Inc.
11.7.1. Company Overview
11.7.2. Product Offerings
11.7.3. Financial Performance
11.7.4. Recent Initiatives
11.8. Kohler Co.
11.8.1. Company Overview
11.8.2. Product Offerings
11.8.3. Financial Performance
11.8.4. Recent Initiatives
Chapter 12. Research Methodology
12.1. Primary Research
12.2. Secondary Research
12.3. Assumptions
Chapter 13. Appendix
13.1. About Us
13.2. Glossary of Terms
 Cross-segment Market Size and Analysis for
Mentioned Segments
 Additional Company Profiles (Upto 5 With No Cost)
 Additional Countries (Apart From Mentioned Countries)
 Country/Region-specific Report
 Go To Market Strategy
 Region Specific Market Dynamics
 Region Level Market Share
 Import Export Analysis
 Production Analysis
 Others