Precipitated Calcium Carbonate Market Size, Share | Report 2023-2032
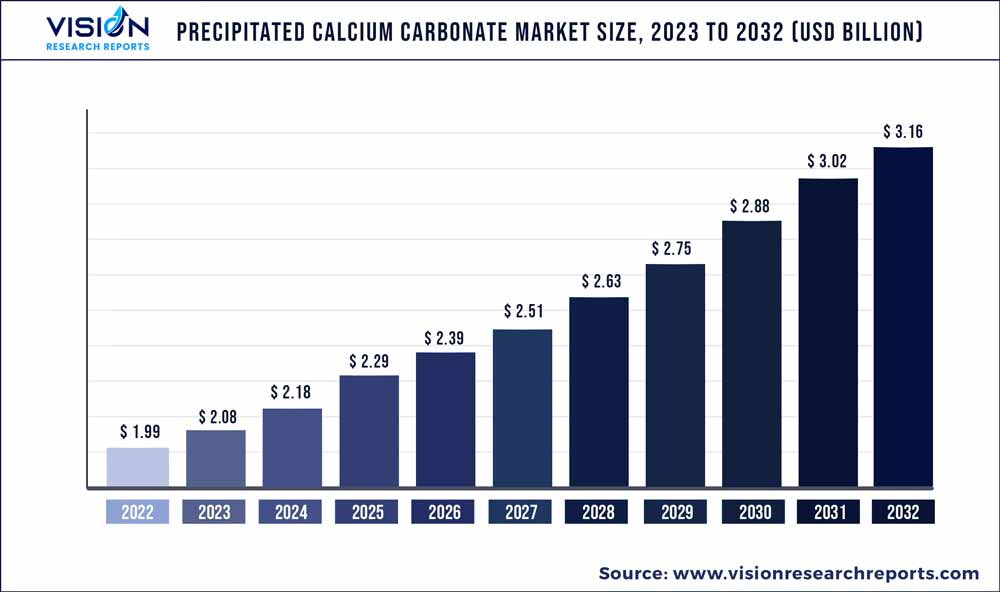
The global precipitated calcium carbonate market was valued at USD 1.99 billion in 2022 and it is predicted to surpass around USD 3.16 billion by 2032 with a CAGR of 4.74% from 2023 to 2032.
Key Pointers
Report Scope of the Precipitated Calcium Carbonate Market
| Report Coverage | Details |
| Market Size in 2022 | USD 1.99 billion |
| Revenue Forecast by 2032 | USD 3.16 billion |
| Growth rate from 2023 to 2032 | CAGR of 4.74% |
| Base Year | 2022 |
| Forecast Period | 2023 to 2032 |
| Market Analysis (Terms Used) | Value (US$ Million/Billion) or (Volume/Units) |
| Regions Covered | North America, Europe, Asia Pacific, Latin America, Middle East & Africa |
| Companies Covered | Fujian Sanmu Nano Calcium Carbonate Co., Ltd.; Guangdong Qiangda New Materials Technology Co.; Minerals Technologies Inc.; NanoMaterials Technology; EZ Chemicals Inc.; Nanoshel LLC; GCCP Resources Ltd.; Gulshan Polyols Ltd. |
The industry growth is majorly driven by the rising demand for precipitated calcium carbonate (PCC) in the personal care & cosmetics and pharmaceutical industries due to its small particle size and usage as a filler. The global pharmaceutical industry is greatly affecting the PCC market owing to its increasing usage in medicines and nutraceuticals. The increasing demand for nutraceuticals in the regions like North America, Asia Pacific, and Europe is driving the demand for PCC (1-5um). The nutraceutical market is growing rapidly in developing countries like India.
This is due to the increasing health awareness and disposable income levels in the region. Moreover, according to the Indian Ministry of Food Processing Industries, developed economies like the U.S., Japan, and Europe have captured around 90% of the nutraceutical market, thus, driving the demand for the product market. Moreover, PCC is used as a filler in the production of the majority of cosmetic products. In cosmetics products, it acts as a good absorbent and is used as an excessive oil remover from the skin. Colored cosmetics, such as foundation, blushers, and eye shadows, contain PCC as an active ingredient. As per the L’Oréal Annual Report 2021, the cosmetic industry grew from 4.20% to 8.0% from 2010-2021. The growing product demand in the cosmetics industry is estimated to drive the market.
Grade Insights
The pharmaceuticals segment dominated the market in 2022 with a revenue share of 46.82% of the overall revenue. This growth is attributed to the fact that calcium plays a vital role in the human body as it is an essential micronutrient. The global healthcare and pharmaceutical industries have been growing rapidly over the last few years, owing to the increasing population and rising awareness among the masses about healthy living. Although COVID-19 severely impacted different industries worldwide, it boosted the growth of the global healthcare and pharmaceutical industries. The pandemic further made people highly conscious and aware of the benefits of a healthy diet and proper intake of micronutrients and macronutrients, such as calcium.
This, in turn, led to a rise in demand for precipitated calcium carbonate, thereby fueling the growth of the market. The food segment is estimated to witness the fastest CAGR over the forecast period due to the fact that food-grade precipitated calcium carbonate is used as a calcium supplement and food additive in the food industry. Food products, such as noodles, biscuits, bread, and chewing gums, contain PCC as an active ingredient. It is added to the food consumed for the growth of bones and the body. The increasing global population and demand for healthy food products worldwide are driving the growth of the market for food-grade PCC.
Regional Insights
Asia Pacific emerged as the dominant region with a revenue share of 46.95% in 2022. This growth is attributed to the fact that Asia Pacific is among the largest markets for pharmaceuticals and personal care & cosmetics. According to the National Investment Promotion & Facilitation Agency, the beauty & personal care market in India is the 8th largest in the world, accounting for USD 15 billion, which is further expected to expand at a CAGR of 12-16% over the coming years. In addition, according to the Hong Kong Trade Development Council, China is the second-largest consumer of cosmetics & personal care items, accounting for around 17.3% of global consumption.
Thus, the growing personal care & cosmetics industry is anticipated to drive the demand for PCC, which is used as a filler in several cosmetics products. Europe will also witness strong growth over the forecast period. According to the European Industrial Pharmacists Group, pharmaceuticals production in Europe has witnessed an increase from USD 135.3 billion in 2000 to USD 318.4 billion in 2021, registering a growth of 11.7%, 6.7%, and 11.8% in France, Germany, and Italy, respectively. Thus, the increasing usage of PCC as a calcium supplement, and in pills, medicines, and ointments in the pharmaceutical industry is driving the demand in the regional market.
Precipitated Calcium Carbonate Market Segmentations:
By Grade
By Regional
Chapter 1. Introduction
1.1.Research Objective
1.2.Scope of the Study
1.3.Definition
Chapter 2. Research Methodology
2.1.Research Approach
2.2.Data Sources
2.3.Assumptions & Limitations
Chapter 3. Executive Summary
3.1.Market Snapshot
Chapter 4. Market Variables and Scope
4.1.Introduction
4.2.Market Classification and Scope
4.3.Industry Value Chain Analysis
4.3.1. Raw Material Procurement Analysis
4.3.2. Sales and Distribution Channel Analysis
4.3.3. Downstream Buyer Analysis
Chapter 5.COVID 19 Impact on Precipitated Calcium Carbonate Market
5.1. COVID-19 Landscape: Precipitated Calcium Carbonate Industry Impact
5.2. COVID 19 - Impact Assessment for the Industry
5.3. COVID 19 Impact: Global Major Government Policy
5.4.Market Trends and Opportunities in the COVID-19 Landscape
Chapter 6. Market Dynamics Analysis and Trends
6.1.Market Dynamics
6.1.1. Market Drivers
6.1.2. Market Restraints
6.1.3. Market Opportunities
6.2.Porter’s Five Forces Analysis
6.2.1. Bargaining power of suppliers
6.2.2. Bargaining power of buyers
6.2.3. Threat of substitute
6.2.4. Threat of new entrants
6.2.5. Degree of competition
Chapter 7. Competitive Landscape
7.1.1. Company Market Share/Positioning Analysis
7.1.2. Key Strategies Adopted by Players
7.1.3. Vendor Landscape
7.1.3.1.List of Suppliers
7.1.3.2.List of Buyers
Chapter 8. Global Precipitated Calcium Carbonate Market, By Grade
8.1.Precipitated Calcium Carbonate Market, by Grade Type, 2023-2032
8.1.1. Food
8.1.1.1.Market Revenue and Forecast (2020-2032)
8.1.2. Pharmaceutical
8.1.2.1.Market Revenue and Forecast (2020-2032)
8.1.3. Reagent
8.1.3.1.Market Revenue and Forecast (2020-2032)
8.1.4. Cosmetic
8.1.4.1.Market Revenue and Forecast (2020-2032)
Chapter 9. Global Precipitated Calcium Carbonate Market, Regional Estimates and Trend Forecast
9.1. North America
9.1.1. Market Revenue and Forecast, by Grade (2020-2032)
9.1.2. U.S.
9.1.2.1. Market Revenue and Forecast, by Grade (2020-2032)
9.1.3. Rest of North America
9.1.3.1. Market Revenue and Forecast, by Grade (2020-2032)
9.2. Europe
9.2.1. Market Revenue and Forecast, by Grade (2020-2032)
9.2.2. UK
9.2.2.1. Market Revenue and Forecast, by Grade (2020-2032)
9.2.3. Germany
9.2.3.1. Market Revenue and Forecast, by Grade (2020-2032)
9.2.4. France
9.2.4.1. Market Revenue and Forecast, by Grade (2020-2032)
9.2.5. Rest of Europe
9.2.5.1. Market Revenue and Forecast, by Grade (2020-2032)
9.3. APAC
9.3.1. Market Revenue and Forecast, by Grade (2020-2032)
9.3.2. India
9.3.2.1. Market Revenue and Forecast, by Grade (2020-2032)
9.3.3. China
9.3.3.1. Market Revenue and Forecast, by Grade (2020-2032)
9.3.4. Japan
9.3.4.1. Market Revenue and Forecast, by Grade (2020-2032)
9.3.5. Rest of APAC
9.3.5.1. Market Revenue and Forecast, by Grade (2020-2032)
9.4. MEA
9.4.1. Market Revenue and Forecast, by Grade (2020-2032)
9.4.2. GCC
9.4.2.1. Market Revenue and Forecast, by Grade (2020-2032)
9.4.3. North Africa
9.4.3.1. Market Revenue and Forecast, by Grade (2020-2032)
9.4.4. South Africa
9.4.4.1. Market Revenue and Forecast, by Grade (2020-2032)
9.4.5. Rest of MEA
9.4.5.1. Market Revenue and Forecast, by Grade (2020-2032)
9.5. Latin America
9.5.1. Market Revenue and Forecast, by Grade (2020-2032)
9.5.2. Brazil
9.5.2.1. Market Revenue and Forecast, by Grade (2020-2032)
9.5.3. Rest of LATAM
9.5.3.1. Market Revenue and Forecast, by Grade (2020-2032)
Chapter 10.Company Profiles
10.1. Fujian Sanmu Nano Calcium Carbonate Co., Ltd.
10.1.1.Company Overview
10.1.2.Product Offerings
10.1.3.Financial Performance
10.1.4.Recent Initiatives
10.2. Guangdong Qiangda New Materials Technology Co.
10.2.1.Company Overview
10.2.2.Product Offerings
10.2.3.Financial Performance
10.2.4.Recent Initiatives
10.3. Minerals Technologies Inc.
10.3.1.Company Overview
10.3.2.Product Offerings
10.3.3.Financial Performance
10.3.4.Recent Initiatives
10.4. NanoMaterials Technology
10.4.1.Company Overview
10.4.2.Product Offerings
10.4.3.Financial Performance
10.4.4.Recent Initiatives
10.5. EZ Chemicals Inc.
10.5.1.Company Overview
10.5.2.Product Offerings
10.5.3.Financial Performance
10.5.4.Recent Initiatives
10.6. Nanoshel LLC
10.6.1.Company Overview
10.6.2.Product Offerings
10.6.3.Financial Performance
10.6.4.Recent Initiatives
10.7. GCCP Resources Ltd.
10.7.1.Company Overview
10.7.2.Product Offerings
10.7.3.Financial Performance
10.7.4.Recent Initiatives
10.8. Gulshan Polyols Ltd.
10.8.1.Company Overview
10.8.2.Product Offerings
10.8.3.Financial Performance
10.8.4.Recent Initiatives
Chapter 11.Research Methodology
11.1.Primary Research
11.2.Secondary Research
11.3.Assumptions
Chapter 12.Appendix
12.1. About Us
12.2. Glossary of Terms
 Cross-segment Market Size and Analysis for
Mentioned Segments
Additional Company Profiles (Upto 5 With No Cost)
Additional Countries (Apart From Mentioned Countries)
Country/Region-specific Report
Go To Market Strategy
Region Specific Market DynamicsRegion Level Market Share Import Export AnalysisProduction AnalysisOthers
Cross-segment Market Size and Analysis for
Mentioned Segments
Additional Company Profiles (Upto 5 With No Cost)
Additional Countries (Apart From Mentioned Countries)
Country/Region-specific Report
Go To Market Strategy
Region Specific Market DynamicsRegion Level Market Share Import Export AnalysisProduction AnalysisOthers