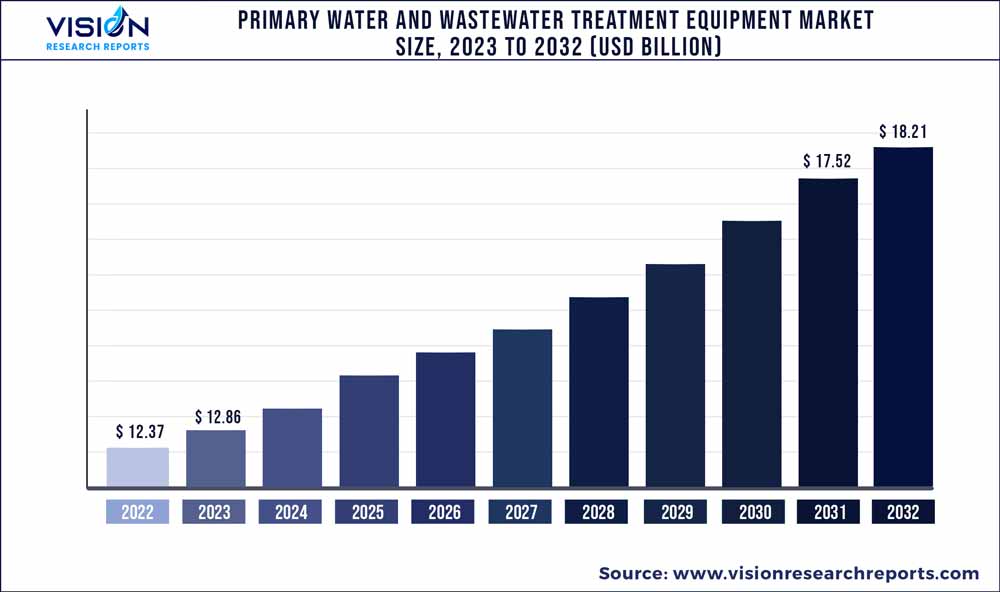
The global primary water and wastewater treatment equipment market was estimated at USD 12.37 billion in 2022 and it is expected to surpass around USD 18.21 billion by 2032, poised to grow at a CAGR of 3.94% from 2023 to 2032. The primary water and wastewater treatment equipment market in the United States was accounted for USD 1.5 billion in 2022.

Key Pointers
Report Scope of the Primary Water And Wastewater Treatment Equipment Market
| Report Coverage | Details |
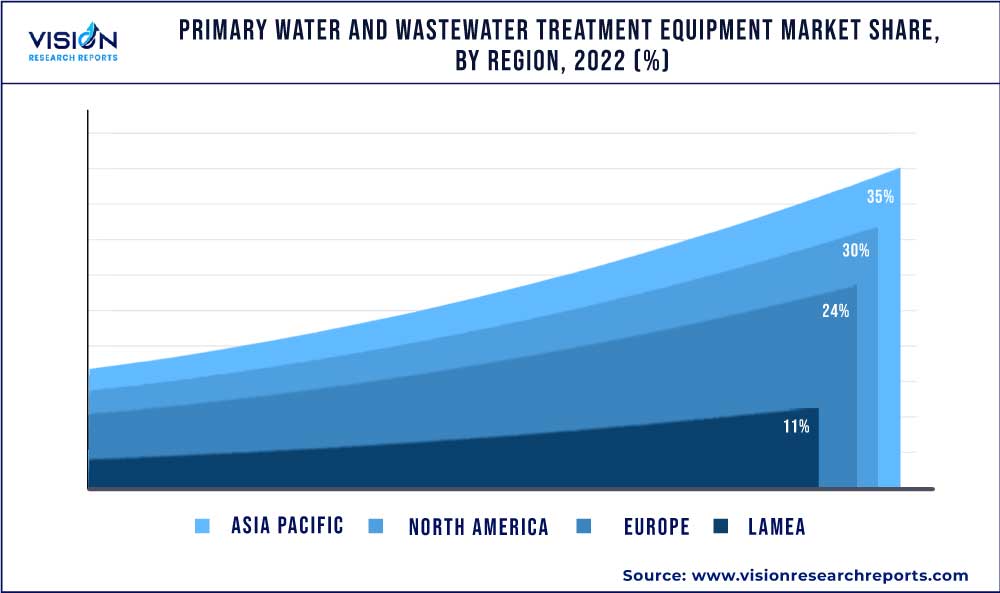
| Revenue Share of Asia Pacific in 2022 | 35% |
| Revenue Forecast by 2032 | USD 18.21 billion |
| Growth Rate from 2023 to 2032 | CAGR of 3.94% |
| Base Year | 2022 |
| Forecast Period | 2023 to 2032 |
| Market Analysis (Terms Used) | Value (US$ Million/Billion) or (Volume/Units) |
| Companies Covered | Veolia Group; Ecolab Inc.; Evoqua Water Technologies LLC; Pentair plc; Toshiba Water Solutions Private Limited; Xylem, Inc. |
Rising demand for clean water has resulted in augmenting the number of water and sludge treatment plants globally, thereby driving the growth of the market. Primary water & wastewater treatment involves the separation of floating materials and heavy solids from effluent. The slurry is passed through several tanks and filters that separate water from contaminants. Low operating costs and high market visibility of the process are expected to play a crucial role in increasing the application scope of primary treatment over the forecast period.
According to the U.S. EPA, over 23,000 to 75,000 sanitary sewers overflow every year in the U.S., thereby augmenting the number of new users connected to the centralized treatment systems. The increasing number of users is expected to boost the demand for the construction of new slurry treatment plants or upgradation of existing plants, driving demand for primary water & wastewater treatment equipment in the country.
The dumping of untreated slurry into water bodies from houses, municipal facilities, and industries pollutes the water, endangering the environment as well as human and animal life. As a result, governments throughout the world have enacted strict laws and guidelines for the management of wastewater in the municipal and industrial sectors, which is predicted to stimulate market expansion.
Primary wastewater treatment includes the removal of large solids from sewage using physical techniques such as sedimentation, skimming, and screening. During the primary treatment process, around 65% of the grease & oil, over 50% to 70% of the total suspended solids (TSS), and 25% to 35% of the biochemical oxygen demand (BOD) are removed.
Several governments have implemented stringent regulations related to wastewater discharge for industrial and municipal sectors, which is expected to boost the primary water & wastewater treatment equipment market growth. Key governmental authorities such as the U.S. EPA, Central Pollution Control Board (CPCB), and European Environment Agency (EEA) play vital roles in preventing water pollution and improving the quality of the water environment.
Equipment Insights
The primary clarifier segment led the market and accounted for more than 29% of the global revenue share in 2022 on account of the equipment’s ability to remove around 25% of the total BOD, 40% to 60% of the suspended solids, and 90% to 95% of the settleable solids in the wastewater. The adoption of primary clarifiers in the paper mills aids in removing the fiber from the waste streams aids in augmenting the demand.
Pre-treatment equipment majorly includes screening products such as bar screens, waterfall screens, coarse screens, trash racks, and others used for removing oil and grease in the wastewater. The demand for pre-treatment equipment is anticipated to witness growth due to its ability to lower the operating costs of the sludge management plants, reducing the risk of impairing the plant equipment in further stages.
Grit removal equipment is estimated to witness a CAGR of 3.83% from 2023 to 2032 in terms of revenue, owing to its ability to remove cinder, gravel, sand, coffee grounds, seeds, bone chips, and large organic particles such as food waste. Factors such as grit characteristics, the quantity of grit, space requirements, organic contents, cost, and removal efficiency are taken into consideration prior to the selection of grit removal systems.
Application Insights
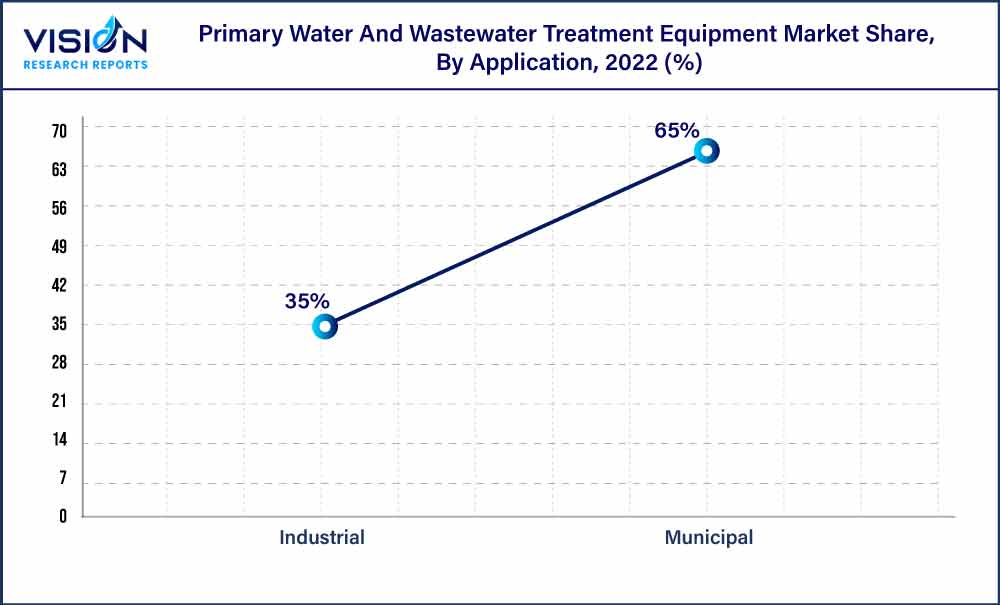
The municipal application segment led the market and accounted for 65% of the global revenue share in 2022. Factors such as growing residential construction, an increasing number of rural households switching to public sewers, rapid urbanization, and population growth are anticipated to drive demand for primary water & wastewater treatment equipment in the municipal sector.
Increasing federal funding in the wastewater management sector under the Clean Water State Revolving Fund (CWSRF) program in the U.S. is expected to drive the demand for wastewater management systems. This, in turn, is expected to have a positive impact on the primary water & wastewater treatment equipment market in the country.

Industrial applications include significant sectors such as food & beverage, chemical, pharmaceutical, pulp & paper, and oil & gas. Factors such as the presence of stringent regulations regarding sludge discharge and growing investments in various industries are expected to drive the demand for primary water & wastewater treatment equipment in the industrial sector over the forecast period.
The industrial application segment is anticipated to witness a CAGR of 4.46% in North America from 2023 to 2032 in terms of revenue. The effluent from the paper & pulp industry is characterized by high levels of suspended solids, BOD & COD from the digestion process, and chlorinated organic products from the bleaching process. Increasing the adoption of primary wastewater treatment equipment in the paper & pulp industry is expected to drive growth.
Regional Insights
The Asia Pacific dominated the market and accounted for 35% share of global revenue in 2022 on account of the presence of a strong consumer base in the region. The strong consumer base has led to a significant surge in demand for primary water & wastewater treatment equipment. Furthermore, improving economic conditions, a rising population, and the presence of one of the most important manufacturing sectors are expected to complement growth.
The demand for primary water & wastewater treatment equipment in India is estimated to witness growth owing to the increasing demand for more reliable supplies of municipal and industrial water. Furthermore, positive developments in the country’s economic conditions are likely to augment the growth of the primary water & wastewater treatment equipment market.

The robust presence of oil & gas reserves in Argentina, Brazil, Columbia, and Venezuela is expected to have a positive impact on the market growth in Central & South America. Furthermore, airport expansions and the development of large-scale commercial structures, especially in Brazil and Columbia, are anticipated to drive the demand for primary water & wastewater treatment equipment over the forecast period.
The demand for primary water & wastewater treatment equipment in Canada was valued at USD 352.5 billion in 2022. The presence of a supportive environment for business growth and proximity to the U.S., which are creating strong growth potential for equipment suppliers and manufacturers, is anticipated to impact the country’s market growth positively.
Primary Water And Wastewater Treatment Equipment Market Segmentations:
By Equipment
By Application
By Region
Chapter 1. Introduction
1.1. Research Objective
1.2. Scope of the Study
1.3. Definition
Chapter 2. Research Methodology
2.1. Research Approach
2.2. Data Sources
2.3. Assumptions & Limitations
Chapter 3. Executive Summary
3.1. Market Snapshot
Chapter 4. Market Variables and Scope
4.1. Introduction
4.2. Market Classification and Scope
4.3. Industry Value Chain Analysis
4.3.1. Raw Material Procurement Analysis
4.3.2. Sales and Distribution Channel Analysis
4.3.3. Downstream Buyer Analysis
Chapter 5. COVID 19 Impact on Primary Water And Wastewater Treatment Equipment Market
5.1. COVID-19 Landscape: Primary Water And Wastewater Treatment Equipment Industry Impact
5.2. COVID 19 - Impact Assessment for the Industry
5.3. COVID 19 Impact: Global Major Government Policy
5.4. Market Trends and Opportunities in the COVID-19 Landscape
Chapter 6. Market Dynamics Analysis and Trends
6.1. Market Dynamics
6.1.1. Market Drivers
6.1.2. Market Restraints
6.1.3. Market Opportunities
6.2. Porter’s Five Forces Analysis
6.2.1. Bargaining power of suppliers
6.2.2. Bargaining power of buyers
6.2.3. Threat of substitute
6.2.4. Threat of new entrants
6.2.5. Degree of competition
Chapter 7. Competitive Landscape
7.1.1. Company Market Share/Positioning Analysis
7.1.2. Key Strategies Adopted by Players
7.1.3. Vendor Landscape
7.1.3.1. List of Suppliers
7.1.3.2. List of Buyers
Chapter 8. Global Primary Water And Wastewater Treatment Equipment Market, By Equipment
8.1. Primary Water And Wastewater Treatment Equipment Market, by Equipment, 2023-2032
8.1.1. Primary Clarifier
8.1.1.1. Market Revenue and Forecast (2020-2032)
8.1.2. Sludge Removal
8.1.2.1. Market Revenue and Forecast (2020-2032)
8.1.3. Grit Removal
8.1.3.1. Market Revenue and Forecast (2020-2032)
8.1.4. Pre-treatment
8.1.4.1. Market Revenue and Forecast (2020-2032)
8.1.5. Others
8.1.5.1. Market Revenue and Forecast (2020-2032)
Chapter 9. Global Primary Water And Wastewater Treatment Equipment Market, By Application
9.1. Primary Water And Wastewater Treatment Equipment Market, by Application, 2023-2032
9.1.1. Municipal
9.1.1.1. Market Revenue and Forecast (2020-2032)
9.1.2. Industrial
9.1.2.1. Market Revenue and Forecast (2020-2032)
Chapter 10. Global Primary Water And Wastewater Treatment Equipment Market, Regional Estimates and Trend Forecast
10.1. North America
10.1.1. Market Revenue and Forecast, by Equipment (2020-2032)
10.1.2. Market Revenue and Forecast, by Application (2020-2032)
10.1.3. U.S.
10.1.3.1. Market Revenue and Forecast, by Equipment (2020-2032)
10.1.3.2. Market Revenue and Forecast, by Application (2020-2032)
10.1.4. Rest of North America
10.1.4.1. Market Revenue and Forecast, by Equipment (2020-2032)
10.1.4.2. Market Revenue and Forecast, by Application (2020-2032)
10.2. Europe
10.2.1. Market Revenue and Forecast, by Equipment (2020-2032)
10.2.2. Market Revenue and Forecast, by Application (2020-2032)
10.2.3. UK
10.2.3.1. Market Revenue and Forecast, by Equipment (2020-2032)
10.2.3.2. Market Revenue and Forecast, by Application (2020-2032)
10.2.4. Germany
10.2.4.1. Market Revenue and Forecast, by Equipment (2020-2032)
10.2.4.2. Market Revenue and Forecast, by Application (2020-2032)
10.2.5. France
10.2.5.1. Market Revenue and Forecast, by Equipment (2020-2032)
10.2.5.2. Market Revenue and Forecast, by Application (2020-2032)
10.2.6. Rest of Europe
10.2.6.1. Market Revenue and Forecast, by Equipment (2020-2032)
10.2.6.2. Market Revenue and Forecast, by Application (2020-2032)
10.3. APAC
10.3.1. Market Revenue and Forecast, by Equipment (2020-2032)
10.3.2. Market Revenue and Forecast, by Application (2020-2032)
10.3.3. India
10.3.3.1. Market Revenue and Forecast, by Equipment (2020-2032)
10.3.3.2. Market Revenue and Forecast, by Application (2020-2032)
10.3.4. China
10.3.4.1. Market Revenue and Forecast, by Equipment (2020-2032)
10.3.4.2. Market Revenue and Forecast, by Application (2020-2032)
10.3.5. Japan
10.3.5.1. Market Revenue and Forecast, by Equipment (2020-2032)
10.3.5.2. Market Revenue and Forecast, by Application (2020-2032)
10.3.6. Rest of APAC
10.3.6.1. Market Revenue and Forecast, by Equipment (2020-2032)
10.3.6.2. Market Revenue and Forecast, by Application (2020-2032)
10.4. MEA
10.4.1. Market Revenue and Forecast, by Equipment (2020-2032)
10.4.2. Market Revenue and Forecast, by Application (2020-2032)
10.4.3. GCC
10.4.3.1. Market Revenue and Forecast, by Equipment (2020-2032)
10.4.3.2. Market Revenue and Forecast, by Application (2020-2032)
10.4.4. North Africa
10.4.4.1. Market Revenue and Forecast, by Equipment (2020-2032)
10.4.4.2. Market Revenue and Forecast, by Application (2020-2032)
10.4.5. South Africa
10.4.5.1. Market Revenue and Forecast, by Equipment (2020-2032)
10.4.5.2. Market Revenue and Forecast, by Application (2020-2032)
10.4.6. Rest of MEA
10.4.6.1. Market Revenue and Forecast, by Equipment (2020-2032)
10.4.6.2. Market Revenue and Forecast, by Application (2020-2032)
10.5. Latin America
10.5.1. Market Revenue and Forecast, by Equipment (2020-2032)
10.5.2. Market Revenue and Forecast, by Application (2020-2032)
10.5.3. Brazil
10.5.3.1. Market Revenue and Forecast, by Equipment (2020-2032)
10.5.3.2. Market Revenue and Forecast, by Application (2020-2032)
10.5.4. Rest of LATAM
10.5.4.1. Market Revenue and Forecast, by Equipment (2020-2032)
10.5.4.2. Market Revenue and Forecast, by Application (2020-2032)
Chapter 11. Company Profiles
11.1. Veolia Group
11.1.1. Company Overview
11.1.2. Product Offerings
11.1.3. Financial Performance
11.1.4. Recent Initiatives
11.2. Ecolab Inc.
11.2.1. Company Overview
11.2.2. Product Offerings
11.2.3. Financial Performance
11.2.4. Recent Initiatives
11.3. Evoqua Water Technologies LLC
11.3.1. Company Overview
11.3.2. Product Offerings
11.3.3. Financial Performance
11.3.4. Recent Initiatives
11.4. Pentair plc
11.4.1. Company Overview
11.4.2. Product Offerings
11.4.3. Financial Performance
11.4.4. LTE Scientific
11.5. Toshiba Water Solutions Private Limited
11.5.1. Company Overview
11.5.2. Product Offerings
11.5.3. Financial Performance
11.5.4. Recent Initiatives
11.6. Xylem, Inc.
11.6.1. Company Overview
11.6.2. Product Offerings
11.6.3. Financial Performance
11.6.4. Recent Initiatives
Chapter 12. Research Methodology
12.1. Primary Research
12.2. Secondary Research
12.3. Assumptions
Chapter 13. Appendix
13.1. About Us
13.2. Glossary of Terms
 Cross-segment Market Size and Analysis for
Mentioned Segments
 Additional Company Profiles (Upto 5 With No Cost)
 Additional Countries (Apart From Mentioned Countries)
 Country/Region-specific Report
 Go To Market Strategy
 Region Specific Market Dynamics
 Region Level Market Share
 Import Export Analysis
 Production Analysis
 Others