Radiodermatitis Market Size, Growth, Trends | Report 2023-2032
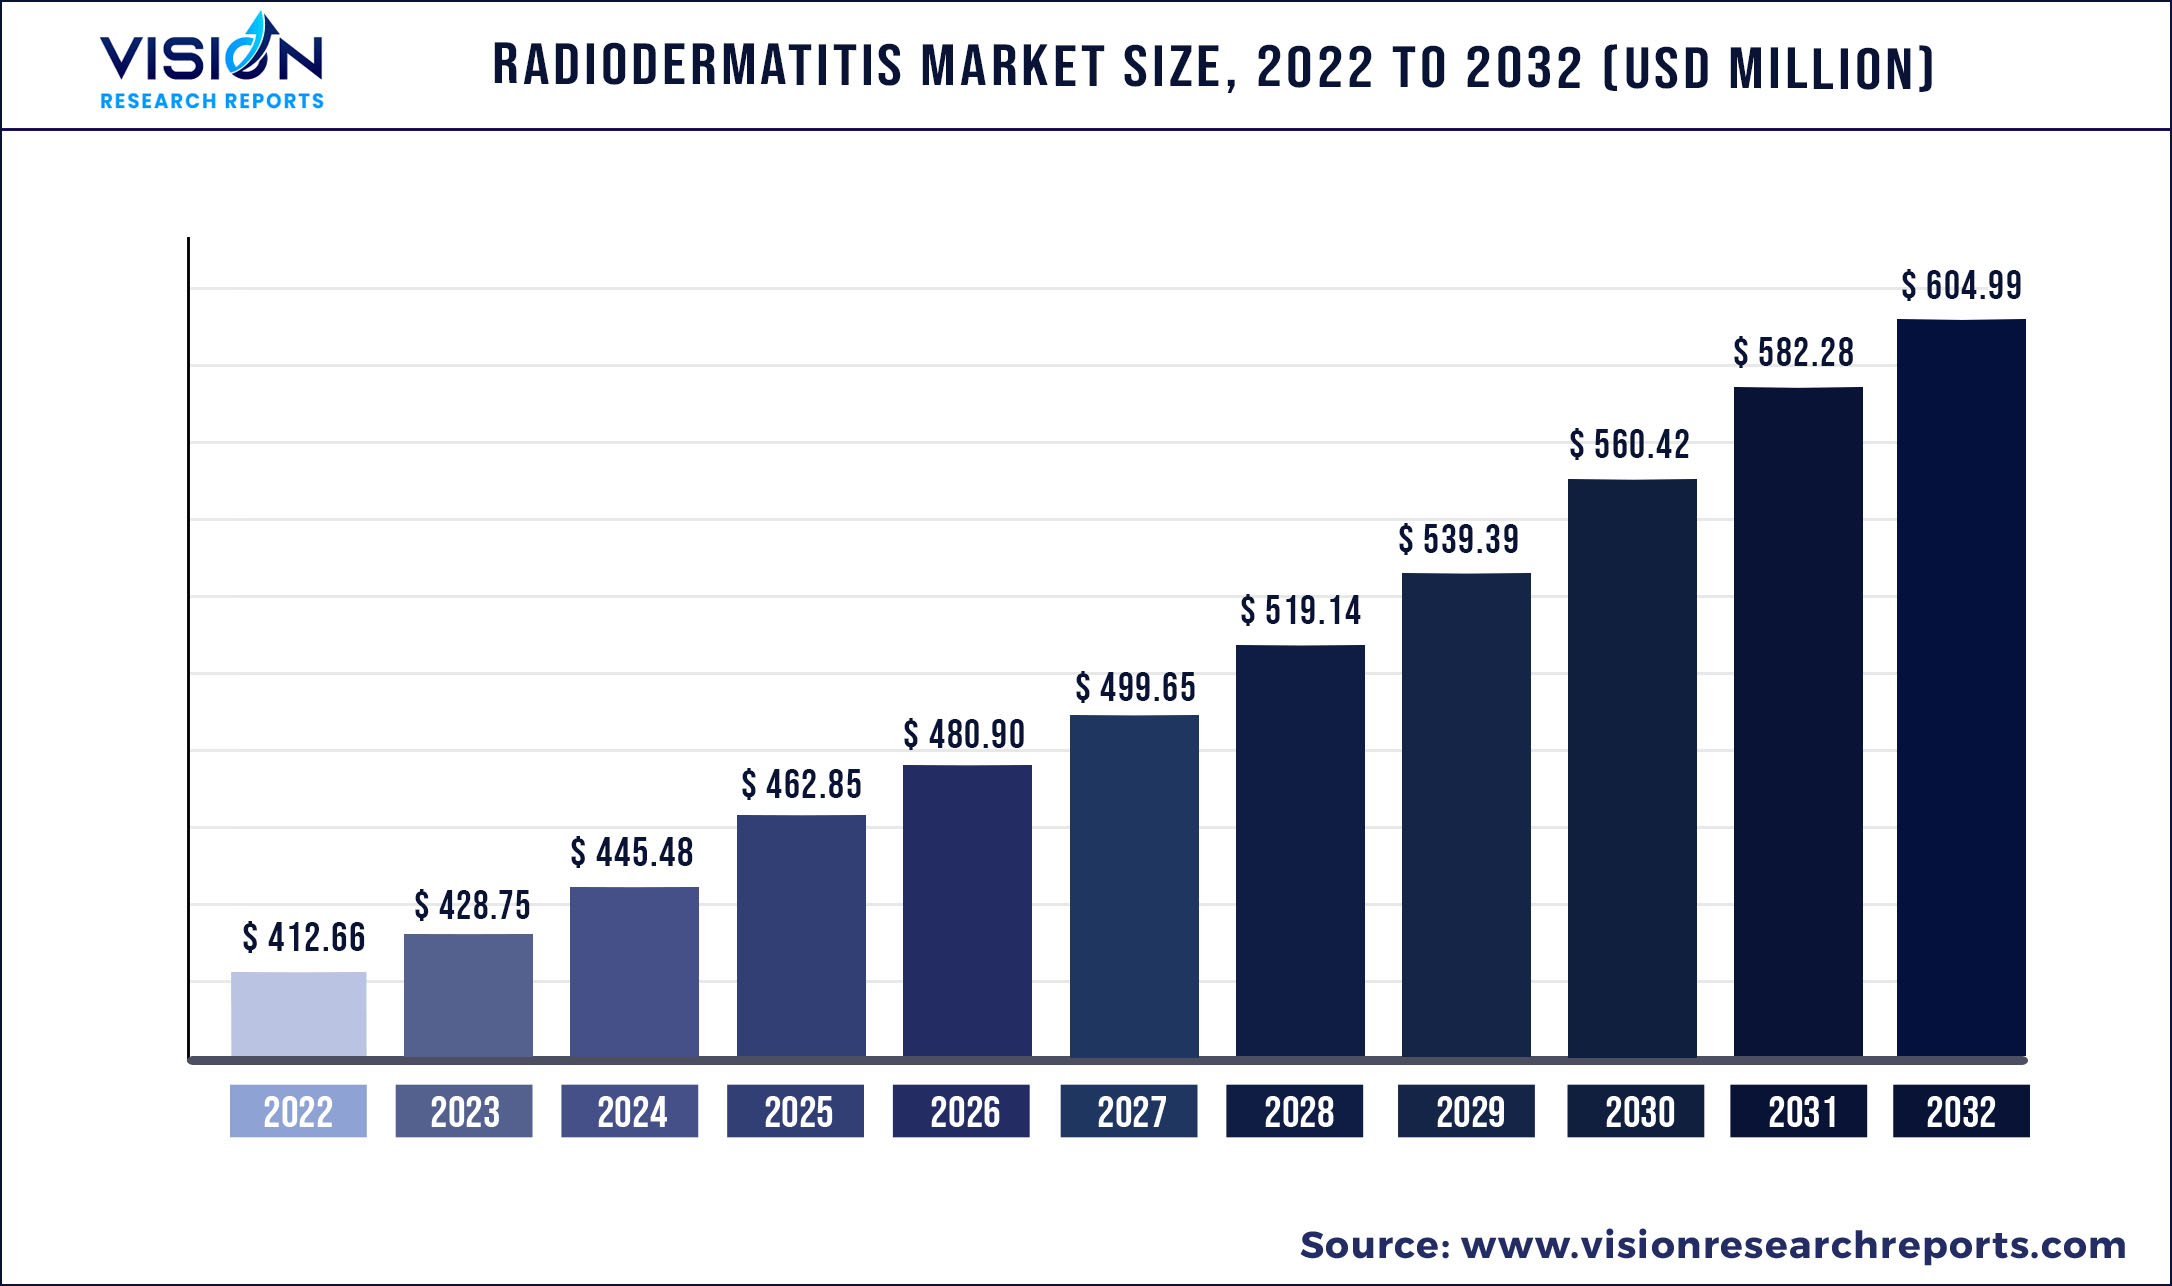
The global radiodermatitis market was estimated at USD 412.66 million in 2022 and it is expected to surpass around USD 604.99 million by 2032, poised to grow at a CAGR of 3.9% from 2023 to 2032.
Key Pointers
| Report Coverage | Details |
| Market Size in 2022 | USD 412.66 million |
| Revenue Forecast by 2032 | USD 604.99 million |
| Growth rate from 2023 to 2032 | CAGR of 3.9% |
| Base Year | 2022 |
| Forecast Period | 2023 to 2032 |
| Regions Covered | North America, Europe, Asia Pacific, Latin America, Middle East & Africa |
| Companies Covered | Stratpharma AG; Smith & Nephew; Molnlycke Health Care AB; Derma Sciences Inc.; ConvaTec Inc.; BMG Pharma S.R.L.; Acelity; 3M; Alliqua BioMedical |
The market is predominantly driven by a growing number of patients suffering from radiodermatitis as an adverse effect of radiation therapy. The need for radiodermatitis treatment items is now more urgent than it has ever been because of the need to stop this negative consequence. Radiodermatitis, which includes erythema, dry desquamation, and moist desquamation, affects 95% of cancer patients getting radiation therapy. Also, it is estimated that 85-95% of patients receiving radiotherapy for breastcancer experience radiodermatitis in variable degrees.
As the prevalence of diabetes and obesity increases, the cases of cancer are also rising. According to the Centers for Disease Control, there were 34.2 million cases of diabetes worldwide in 2018; this number is expected to climb to 1.2 billion by 2030. This increase will show that a greater population of patients are more likely to get cancer, and because of a co-morbid condition, they would be more prone to experience radiation-induced skin damage. This is likely to drive the market during the forecast period.
One of the key factors driving this market is the growing number of governmental and private healthcare organisations actively working to raise knowledge about the management and treatment of radiodermatitis. These organisations also publish instructions and suggestions for effectively treating the illness, which is expected to increase the potential for growth throughout the course of the projection period.
For instance, the Provincial Health Services Authority's BC Cancer Agency published information on radiodermatitis risk factors as well as instructions for managing the symptoms of the condition. This is expected to increase knowledge of assessment & treatment methods as well as general skincare advice, boosting potential growth. The product pipeline is expected to grow and the market will have profitable growth opportunities as more clinical studies are conducted to assess the effectiveness of a variety of radiodermatitis treatment products for treatment.
Radiodermatitis Market Segmentations:
By Product
By Distribution Channel
Chapter 1. Introduction
1.1. Research Objective
1.2. Scope of the Study
1.3. Definition
Chapter 2. Research Methodology
2.1. Research Approach
2.2. Data Sources
2.3. Assumptions & Limitations
Chapter 3. Executive Summary
3.1. Market Snapshot
Chapter 4. Market Variables and Scope
4.1. Introduction
4.2. Market Classification and Scope
4.3. Industry Value Chain Analysis
4.3.1. Raw Material Procurement Analysis
4.3.2. Sales and Distribution Channel Analysis
4.3.3. Downstream Buyer Analysis
Chapter 5. COVID 19 Impact on Radiodermatitis Market
5.1. COVID-19 Landscape: Radiodermatitis Industry Impact
5.2. COVID 19 - Impact Assessment for the Industry
5.3. COVID 19 Impact: Global Major Government Policy
5.4. Market Trends and Opportunities in the COVID-19 Landscape
Chapter 6. Market Dynamics Analysis and Trends
6.1. Market Dynamics
6.1.1. Market Drivers
6.1.2. Market Restraints
6.1.3. Market Opportunities
6.2. Porter’s Five Forces Analysis
6.2.1. Bargaining power of suppliers
6.2.2. Bargaining power of buyers
6.2.3. Threat of substitute
6.2.4. Threat of new entrants
6.2.5. Degree of competition
Chapter 7. Competitive Landscape
7.1.1. Company Market Share/Positioning Analysis
7.1.2. Key Strategies Adopted by Players
7.1.3. Vendor Landscape
7.1.3.1. List of Suppliers
7.1.3.2. List of Buyers
Chapter 8. Global Radiodermatitis Market, By Product
8.1. Radiodermatitis Market, by Product, 2023-2032
8.1.1. Topical
8.1.1.1. Market Revenue and Forecast (2019-2032)
8.1.2. Oral
8.1.2.1. Market Revenue and Forecast (2019-2032)
8.1.3. Dressings
8.1.3.1. Market Revenue and Forecast (2019-2032)
Chapter 9. Global Radiodermatitis Market, By Distribution Channel
9.1. Radiodermatitis Market, by Distribution Channel, 2023-2032
9.1.1. Hospital Pharmacies
9.1.1.1. Market Revenue and Forecast (2019-2032)
9.1.2. Retail Pharmacies
9.1.2.1. Market Revenue and Forecast (2019-2032)
9.1.3. Online
9.1.3.1. Market Revenue and Forecast (2019-2032)
Chapter 10. Global Radiodermatitis Market, Regional Estimates and Trend Forecast
10.1. North America
10.1.1. Market Revenue and Forecast, by Product (2019-2032)
10.1.2. Market Revenue and Forecast, by Distribution Channel (2019-2032)
10.1.3. U.S.
10.1.3.1. Market Revenue and Forecast, by Product (2019-2032)
10.1.3.2. Market Revenue and Forecast, by Distribution Channel (2019-2032)
10.1.4. Rest of North America
10.1.4.1. Market Revenue and Forecast, by Product (2019-2032)
10.1.4.2. Market Revenue and Forecast, by Distribution Channel (2019-2032)
10.2. Europe
10.2.1. Market Revenue and Forecast, by Product (2019-2032)
10.2.2. Market Revenue and Forecast, by Distribution Channel (2019-2032)
10.2.3. UK
10.2.3.1. Market Revenue and Forecast, by Product (2019-2032)
10.2.3.2. Market Revenue and Forecast, by Distribution Channel (2019-2032)
10.2.4. Germany
10.2.4.1. Market Revenue and Forecast, by Product (2019-2032)
10.2.4.2. Market Revenue and Forecast, by Distribution Channel (2019-2032)
10.2.5. France
10.2.5.1. Market Revenue and Forecast, by Product (2019-2032)
10.2.5.2. Market Revenue and Forecast, by Distribution Channel (2019-2032)
10.2.6. Rest of Europe
10.2.6.1. Market Revenue and Forecast, by Product (2019-2032)
10.2.6.2. Market Revenue and Forecast, by Distribution Channel (2019-2032)
10.3. APAC
10.3.1. Market Revenue and Forecast, by Product (2019-2032)
10.3.2. Market Revenue and Forecast, by Distribution Channel (2019-2032)
10.3.3. India
10.3.3.1. Market Revenue and Forecast, by Product (2019-2032)
10.3.3.2. Market Revenue and Forecast, by Distribution Channel (2019-2032)
10.3.4. China
10.3.4.1. Market Revenue and Forecast, by Product (2019-2032)
10.3.4.2. Market Revenue and Forecast, by Distribution Channel (2019-2032)
10.3.5. Japan
10.3.5.1. Market Revenue and Forecast, by Product (2019-2032)
10.3.5.2. Market Revenue and Forecast, by Distribution Channel (2019-2032)
10.3.6. Rest of APAC
10.3.6.1. Market Revenue and Forecast, by Product (2019-2032)
10.3.6.2. Market Revenue and Forecast, by Distribution Channel (2019-2032)
10.4. MEA
10.4.1. Market Revenue and Forecast, by Product (2019-2032)
10.4.2. Market Revenue and Forecast, by Distribution Channel (2019-2032)
10.4.3. GCC
10.4.3.1. Market Revenue and Forecast, by Product (2019-2032)
10.4.3.2. Market Revenue and Forecast, by Distribution Channel (2019-2032)
10.4.4. North Africa
10.4.4.1. Market Revenue and Forecast, by Product (2019-2032)
10.4.4.2. Market Revenue and Forecast, by Distribution Channel (2019-2032)
10.4.5. South Africa
10.4.5.1. Market Revenue and Forecast, by Product (2019-2032)
10.4.5.2. Market Revenue and Forecast, by Distribution Channel (2019-2032)
10.4.6. Rest of MEA
10.4.6.1. Market Revenue and Forecast, by Product (2019-2032)
10.4.6.2. Market Revenue and Forecast, by Distribution Channel (2019-2032)
10.5. Latin America
10.5.1. Market Revenue and Forecast, by Product (2019-2032)
10.5.2. Market Revenue and Forecast, by Distribution Channel (2019-2032)
10.5.3. Brazil
10.5.3.1. Market Revenue and Forecast, by Product (2019-2032)
10.5.3.2. Market Revenue and Forecast, by Distribution Channel (2019-2032)
10.5.4. Rest of LATAM
10.5.4.1. Market Revenue and Forecast, by Product (2019-2032)
10.5.4.2. Market Revenue and Forecast, by Distribution Channel (2019-2032)
Chapter 11. Company Profiles
11.1. Stratpharma AG
11.1.1. Company Overview
11.1.2. Product Offerings
11.1.3. Financial Performance
11.1.4. Recent Initiatives
11.2. Smith & Nephew
11.2.1. Company Overview
11.2.2. Product Offerings
11.2.3. Financial Performance
11.2.4. Recent Initiatives
11.3. Molnlycke Health Care AB
11.3.1. Company Overview
11.3.2. Product Offerings
11.3.3. Financial Performance
11.3.4. Recent Initiatives
11.4. Derma Sciences Inc.
11.4.1. Company Overview
11.4.2. Product Offerings
11.4.3. Financial Performance
11.4.4. LTE Scientific
11.5. ConvaTec Inc.
11.5.1. Company Overview
11.5.2. Product Offerings
11.5.3. Financial Performance
11.5.4. Recent Initiatives
11.6. BMG Pharma S.R.L.
11.6.1. Company Overview
11.6.2. Product Offerings
11.6.3. Financial Performance
11.6.4. Recent Initiatives
11.7. Acelity
11.7.1. Company Overview
11.7.2. Product Offerings
11.7.3. Financial Performance
11.7.4. Recent Initiatives
11.8. 3M
11.8.1. Company Overview
11.8.2. Product Offerings
11.8.3. Financial Performance
11.8.4. Recent Initiatives
11.9. Alliqua BioMedical
11.9.1. Company Overview
11.9.2. Product Offerings
11.9.3. Financial Performance
11.9.4. Recent Initiatives
Chapter 12. Research Methodology
12.1. Primary Research
12.2. Secondary Research
12.3. Assumptions
Chapter 13. Appendix
13.1. About Us
13.2. Glossary of Terms
 Cross-segment Market Size and Analysis for
Mentioned Segments
Additional Company Profiles (Upto 5 With No Cost)
Additional Countries (Apart From Mentioned Countries)
Country/Region-specific Report
Go To Market Strategy
Region Specific Market DynamicsRegion Level Market Share Import Export AnalysisProduction AnalysisOthers
Cross-segment Market Size and Analysis for
Mentioned Segments
Additional Company Profiles (Upto 5 With No Cost)
Additional Countries (Apart From Mentioned Countries)
Country/Region-specific Report
Go To Market Strategy
Region Specific Market DynamicsRegion Level Market Share Import Export AnalysisProduction AnalysisOthers