Real World Evidence Solutions Market Size, Growth, Trends | Report 2023-2032
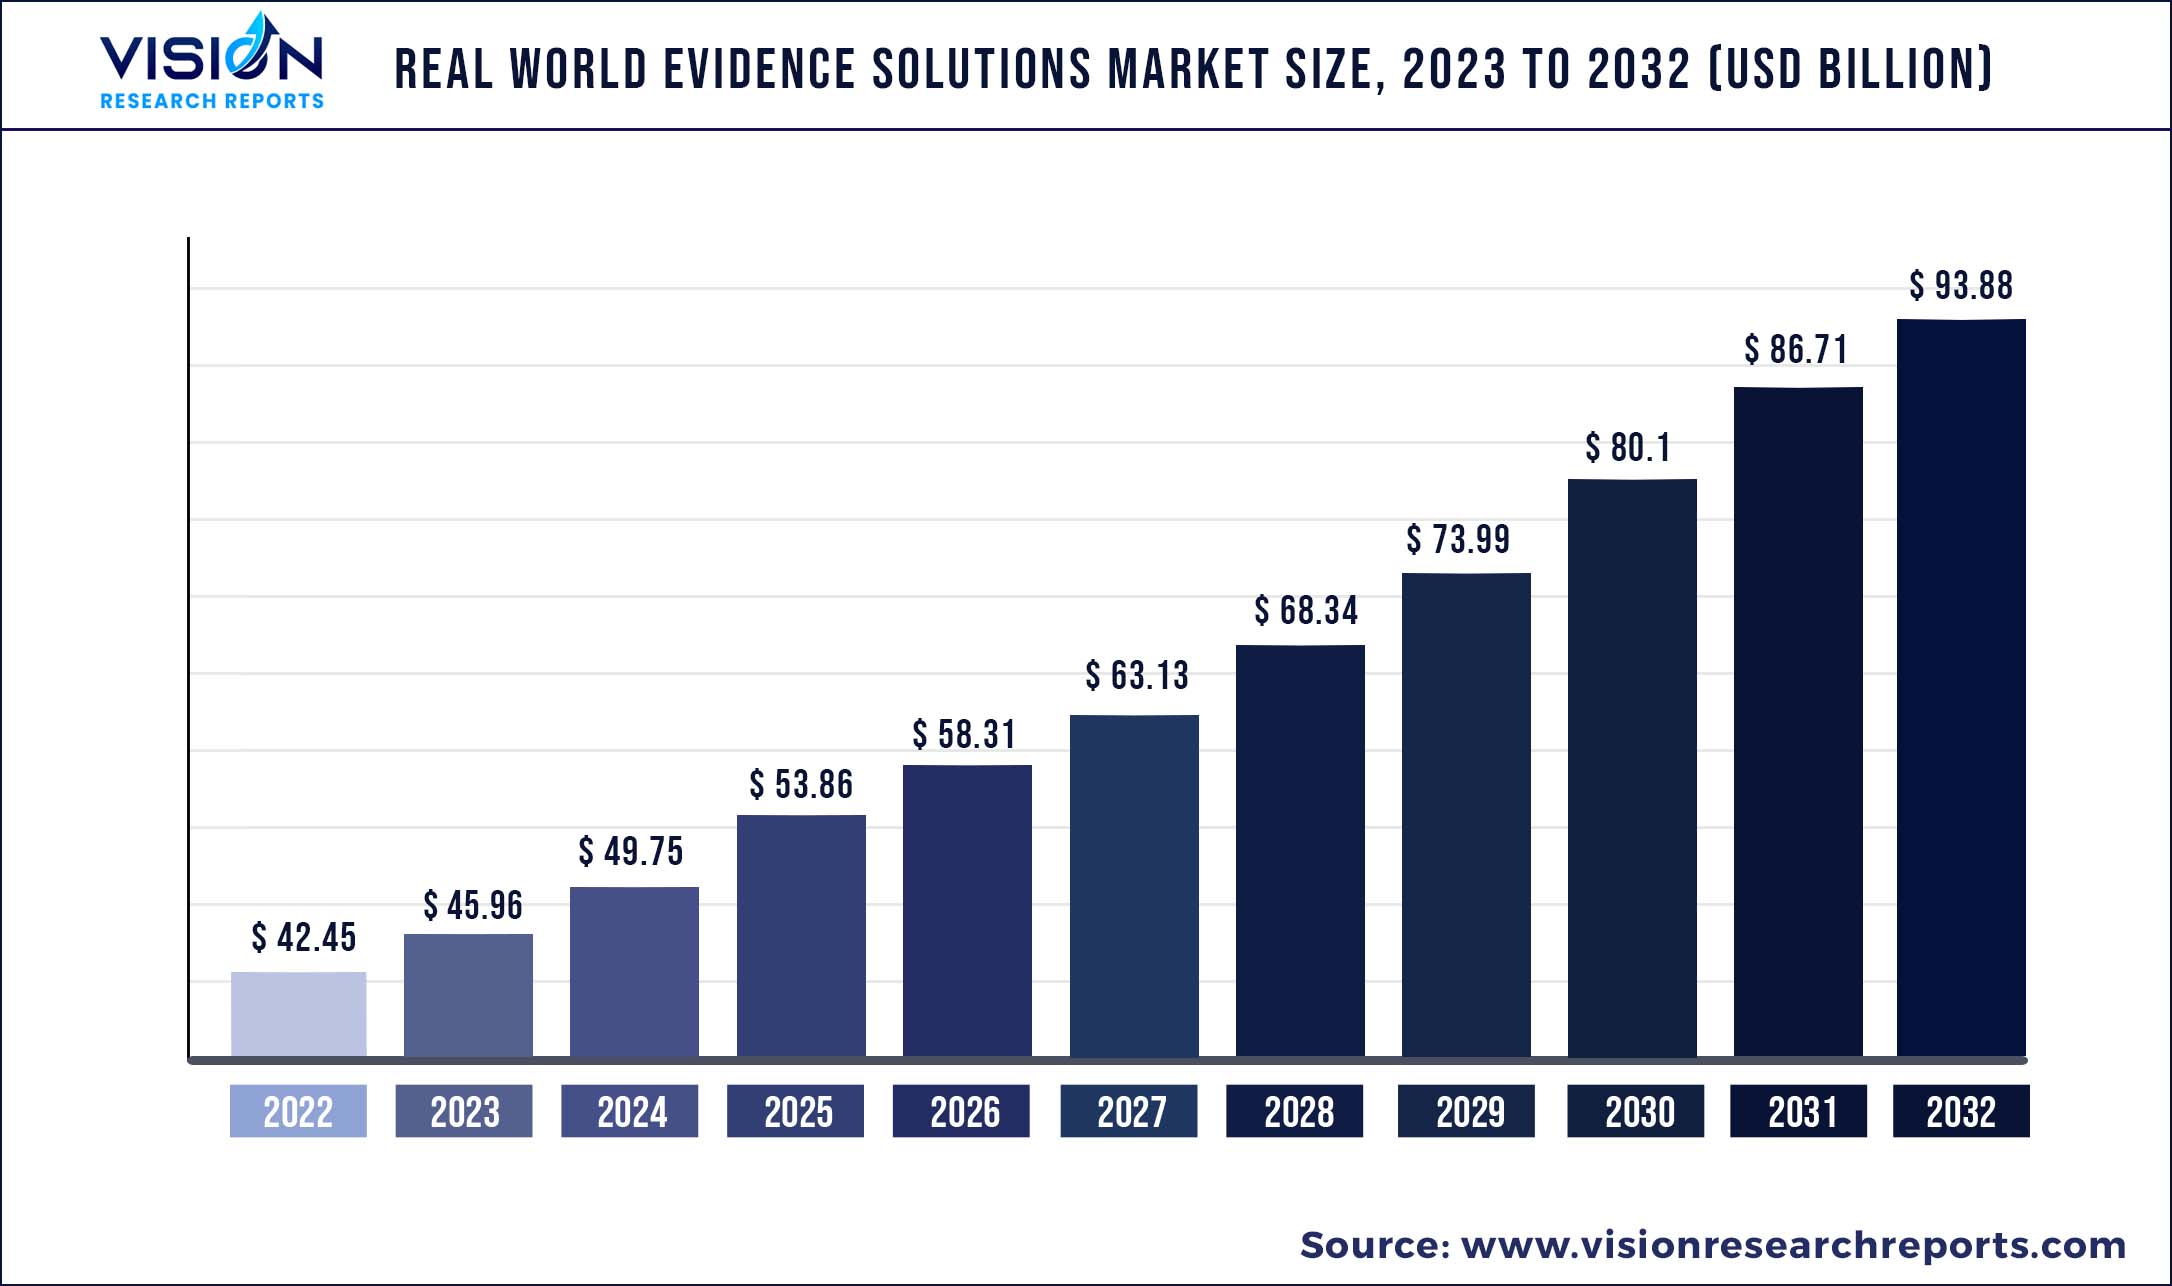
The global real world evidence solutions market was surpassed at USD 42.45 billion in 2022 and is expected to hit around USD 93.88 billion by 2032, growing at a CAGR of 8.26% from 2023 to 2032.
Key Pointers
Report Scope of the Real World Evidence Solutions Market
| Report Coverage | Details |
| Market Size in 2022 | USD 42.45 billion |
| Revenue Forecast by 2032 | USD 93.88 billion |
| Growth rate from 2023 to 2032 | CAGR of 8.26% |
| Base Year | 2022 |
| Forecast Period | 2023 to 2032 |
| Regions Covered | North America, Europe, Asia Pacific, Latin America, Middle East & Africa |
| Companies Covered | IQVIA; IBM; PPD Inc.; Parexel International Corporation; PerkinElmer Inc.; Icon Plc; Oracle; Syneos Health; Cegedim Health Data; Medpace |
Support from regulatory bodies for using Real World Evidence Solutions (RWE) and an increase in R&D spending are anticipated to boost market growth. Furthermore, the shift from volume to value-based care is also expected to fuel the growth. Due to the COVID-19 pandemic, many market players began to experience general business disruptions, which impeded normal business activities.
For instance, IQVIA reported that it was unable to perform on-site monitoring and deliver offerings that relied on in-person gatherings or face-to-face interactions. However, the company accelerated and expanded a variety of cost containment actions for reducing the impact on profitability.
It also activated business continuity plans, including remote delivery capabilities in technology and analytics, remote monitoring & virtual trials in research & development solutions, and virtual commercial activity with clients wherever possible. Organizations, like the National Patient-Centered Clinical Research Network (PCORnet), National Institutes of Health (NIH) Collaboratory, and FDA’s Sentinel Initiative have collaborated to use the RWE data for improving clinical trial efficiency and drug safety monitoring.
The uncertainty brought on by the pandemic has significantly shifted how and when patients choose to seek medical care. In addition, a shift in healthcare treatment and provision during the pandemic has altered the discovery & reporting of some outcomes in data and the treated populace. This indicates that disease trends may lead to inaccurate interpretations when RWE and Real-world Data (RWD) do not border in the framework of the COVID-19 pandemic and long-term COVID-19 therapy, disease, and lifestyle changes.
The European Medicines Agency has also issued guidelines for RWE studies, requiring risk-benefit data in addition to post-authorization safety studies. Therefore, favorable government initiatives are expected to boost market growth. Furthermore, an industry coalition to innovate and expand the application of RWE promotes market growth.
For instance, in May 2021, five corporations-Aetion, IQVIA, Flatiron Health, Tempus, and Syapse-collaborated to expand the use of data derived from EHRs, claims, and other sources beyond clinical trials. The coalition will also work together with pharma companies, medical device manufacturers, patient groups, and other key stakeholders to support broader efforts around the usage of RWE, which members say supports developers, regulators, and providers in having a greater understanding of medical product safety & efficacy. Thus, such kind of innovations will support the market to enable faster access to new treatment options, which, in turn, will impel growth.
As there is continuous growth in data variety, volume, and speed, and there is a need for quick delivery of insights derived from that data, the need for integrating the right technologies for the implementation of the RWE program is growing. Many life sciences companies are adopting cloud technologies owing to the speed, flexibility, security, and scalability they provide.
Cloud technology can provide various benefits to RWE solutions. These include speed through which cloud-based analytics can be scale-up quickly, which helps as the data volume grows; and security, which helps in protecting patient-level data even in a de-identified format.
Real World Evidence Solutions Market Segmentations:
By Component
By Application
By End-user
By Therapeutic Area
Chapter 1. Introduction
1.1. Research Objective
1.2. Scope of the Study
1.3. Definition
Chapter 2. Research Methodology
2.1. Research Approach
2.2. Data Sources
2.3. Assumptions & Limitations
Chapter 3. Executive Summary
3.1. Market Snapshot
Chapter 4. Market Variables and Scope
4.1. Introduction
4.2. Market Classification and Scope
4.3. Industry Value Chain Analysis
4.3.1. Raw Material Procurement Analysis
4.3.2. Sales and Distribution Channel Analysis
4.3.3. Downstream Buyer Analysis
Chapter 5. COVID 19 Impact on Real World Evidence Solutions Market
5.1. COVID-19 Landscape: Real World Evidence Solutions Industry Impact
5.2. COVID 19 - Impact Assessment for the Industry
5.3. COVID 19 Impact: Global Major Government Policy
5.4. Market Trends and Opportunities in the COVID-19 Landscape
Chapter 6. Market Dynamics Analysis and Trends
6.1. Market Dynamics
6.1.1. Market Drivers
6.1.2. Market Restraints
6.1.3. Market Opportunities
6.2. Porter’s Five Forces Analysis
6.2.1. Bargaining power of suppliers
6.2.2. Bargaining power of buyers
6.2.3. Threat of substitute
6.2.4. Threat of new entrants
6.2.5. Degree of competition
Chapter 7. Competitive Landscape
7.1.1. Company Market Share/Positioning Analysis
7.1.2. Key Strategies Adopted by Players
7.1.3. Vendor Landscape
7.1.3.1. List of Suppliers
7.1.3.2. List of Buyers
Chapter 8. Global Real World Evidence Solutions Market, By Component
8.1. Real World Evidence Solutions Market, by Component, 2023-2032
8.1.1. Services
8.1.1.1. Market Revenue and Forecast (2020-2032)
8.1.2. Data Sets
8.1.2.1. Market Revenue and Forecast (2020-2032)
Chapter 9. Global Real World Evidence Solutions Market, By Application
9.1. Real World Evidence Solutions Market, by Application, 2023-2032
9.1.1. Drug Development & Approvals
9.1.1.1. Market Revenue and Forecast (2020-2032)
9.1.2. Medical Device Development & Approvals
9.1.2.1. Market Revenue and Forecast (2020-2032)
9.1.3. Reimbursement/Coverage & Regulatory Decision Making
9.1.3.1. Market Revenue and Forecast (2020-2032)
9.1.4. Post Market Safety & Adverse Events Monitoring
9.1.4.1. Market Revenue and Forecast (2020-2032)
Chapter 10. Global Real World Evidence Solutions Market, By End-user
10.1. Real World Evidence Solutions Market, by End-user, 2023-2032
10.1.1. Healthcare Companies (Pharmaceutical, Biopharmaceutical, Medical Device)
10.1.1.1. Market Revenue and Forecast (2020-2032)
10.1.2. Healthcare Payers
10.1.2.1. Market Revenue and Forecast (2020-2032)
10.1.3. Healthcare Providers
10.1.3.1. Market Revenue and Forecast (2020-2032)
10.1.4. Others
10.1.4.1. Market Revenue and Forecast (2020-2032)
Chapter 11. Global Real World Evidence Solutions Market, By Therapeutic Area
11.1. Real World Evidence Solutions Market, by Therapeutic Area, 2023-2032
11.1.1. Oncology
11.1.1.1. Market Revenue and Forecast (2020-2032)
11.1.2. Cardiology
11.1.2.1. Market Revenue and Forecast (2020-2032)
11.1.3. Neurology
11.1.3.1. Market Revenue and Forecast (2020-2032)
11.1.4. Diabetes
11.1.4.1. Market Revenue and Forecast (2020-2032)
11.1.5. Psychiatry
11.1.5.1. Market Revenue and Forecast (2020-2032)
11.1.6. Respiratory
11.1.6.1. Market Revenue and Forecast (2020-2032)
11.1.7. Other therapeutic areas (Immunology, Gastroenterology, etc.)
11.1.7.1. Market Revenue and Forecast (2020-2032)
Chapter 12. Global Real World Evidence Solutions Market, Regional Estimates and Trend Forecast
12.1. North America
12.1.1. Market Revenue and Forecast, by Component (2020-2032)
12.1.2. Market Revenue and Forecast, by Application (2020-2032)
12.1.3. Market Revenue and Forecast, by End-user (2020-2032)
12.1.4. Market Revenue and Forecast, by Therapeutic Area (2020-2032)
12.1.5. U.S.
12.1.5.1. Market Revenue and Forecast, by Component (2020-2032)
12.1.5.2. Market Revenue and Forecast, by Application (2020-2032)
12.1.5.3. Market Revenue and Forecast, by End-user (2020-2032)
12.1.5.4. Market Revenue and Forecast, by Therapeutic Area (2020-2032)
12.1.6. Rest of North America
12.1.6.1. Market Revenue and Forecast, by Component (2020-2032)
12.1.6.2. Market Revenue and Forecast, by Application (2020-2032)
12.1.6.3. Market Revenue and Forecast, by End-user (2020-2032)
12.1.6.4. Market Revenue and Forecast, by Therapeutic Area (2020-2032)
12.2. Europe
12.2.1. Market Revenue and Forecast, by Component (2020-2032)
12.2.2. Market Revenue and Forecast, by Application (2020-2032)
12.2.3. Market Revenue and Forecast, by End-user (2020-2032)
12.2.4. Market Revenue and Forecast, by Therapeutic Area (2020-2032)
12.2.5. UK
12.2.5.1. Market Revenue and Forecast, by Component (2020-2032)
12.2.5.2. Market Revenue and Forecast, by Application (2020-2032)
12.2.5.3. Market Revenue and Forecast, by End-user (2020-2032)
12.2.5.4. Market Revenue and Forecast, by Therapeutic Area (2020-2032)
12.2.6. Germany
12.2.6.1. Market Revenue and Forecast, by Component (2020-2032)
12.2.6.2. Market Revenue and Forecast, by Application (2020-2032)
12.2.6.3. Market Revenue and Forecast, by End-user (2020-2032)
12.2.6.4. Market Revenue and Forecast, by Therapeutic Area (2020-2032)
12.2.7. France
12.2.7.1. Market Revenue and Forecast, by Component (2020-2032)
12.2.7.2. Market Revenue and Forecast, by Application (2020-2032)
12.2.7.3. Market Revenue and Forecast, by End-user (2020-2032)
12.2.7.4. Market Revenue and Forecast, by Therapeutic Area (2020-2032)
12.2.8. Rest of Europe
12.2.8.1. Market Revenue and Forecast, by Component (2020-2032)
12.2.8.2. Market Revenue and Forecast, by Application (2020-2032)
12.2.8.3. Market Revenue and Forecast, by End-user (2020-2032)
12.2.8.4. Market Revenue and Forecast, by Therapeutic Area (2020-2032)
12.3. APAC
12.3.1. Market Revenue and Forecast, by Component (2020-2032)
12.3.2. Market Revenue and Forecast, by Application (2020-2032)
12.3.3. Market Revenue and Forecast, by End-user (2020-2032)
12.3.4. Market Revenue and Forecast, by Therapeutic Area (2020-2032)
12.3.5. India
12.3.5.1. Market Revenue and Forecast, by Component (2020-2032)
12.3.5.2. Market Revenue and Forecast, by Application (2020-2032)
12.3.5.3. Market Revenue and Forecast, by End-user (2020-2032)
12.3.5.4. Market Revenue and Forecast, by Therapeutic Area (2020-2032)
12.3.6. China
12.3.6.1. Market Revenue and Forecast, by Component (2020-2032)
12.3.6.2. Market Revenue and Forecast, by Application (2020-2032)
12.3.6.3. Market Revenue and Forecast, by End-user (2020-2032)
12.3.6.4. Market Revenue and Forecast, by Therapeutic Area (2020-2032)
12.3.7. Japan
12.3.7.1. Market Revenue and Forecast, by Component (2020-2032)
12.3.7.2. Market Revenue and Forecast, by Application (2020-2032)
12.3.7.3. Market Revenue and Forecast, by End-user (2020-2032)
12.3.7.4. Market Revenue and Forecast, by Therapeutic Area (2020-2032)
12.3.8. Rest of APAC
12.3.8.1. Market Revenue and Forecast, by Component (2020-2032)
12.3.8.2. Market Revenue and Forecast, by Application (2020-2032)
12.3.8.3. Market Revenue and Forecast, by End-user (2020-2032)
12.3.8.4. Market Revenue and Forecast, by Therapeutic Area (2020-2032)
12.4. MEA
12.4.1. Market Revenue and Forecast, by Component (2020-2032)
12.4.2. Market Revenue and Forecast, by Application (2020-2032)
12.4.3. Market Revenue and Forecast, by End-user (2020-2032)
12.4.4. Market Revenue and Forecast, by Therapeutic Area (2020-2032)
12.4.5. GCC
12.4.5.1. Market Revenue and Forecast, by Component (2020-2032)
12.4.5.2. Market Revenue and Forecast, by Application (2020-2032)
12.4.5.3. Market Revenue and Forecast, by End-user (2020-2032)
12.4.5.4. Market Revenue and Forecast, by Therapeutic Area (2020-2032)
12.4.6. North Africa
12.4.6.1. Market Revenue and Forecast, by Component (2020-2032)
12.4.6.2. Market Revenue and Forecast, by Application (2020-2032)
12.4.6.3. Market Revenue and Forecast, by End-user (2020-2032)
12.4.6.4. Market Revenue and Forecast, by Therapeutic Area (2020-2032)
12.4.7. South Africa
12.4.7.1. Market Revenue and Forecast, by Component (2020-2032)
12.4.7.2. Market Revenue and Forecast, by Application (2020-2032)
12.4.7.3. Market Revenue and Forecast, by End-user (2020-2032)
12.4.7.4. Market Revenue and Forecast, by Therapeutic Area (2020-2032)
12.4.8. Rest of MEA
12.4.8.1. Market Revenue and Forecast, by Component (2020-2032)
12.4.8.2. Market Revenue and Forecast, by Application (2020-2032)
12.4.8.3. Market Revenue and Forecast, by End-user (2020-2032)
12.4.8.4. Market Revenue and Forecast, by Therapeutic Area (2020-2032)
12.5. Latin America
12.5.1. Market Revenue and Forecast, by Component (2020-2032)
12.5.2. Market Revenue and Forecast, by Application (2020-2032)
12.5.3. Market Revenue and Forecast, by End-user (2020-2032)
12.5.4. Market Revenue and Forecast, by Therapeutic Area (2020-2032)
12.5.5. Brazil
12.5.5.1. Market Revenue and Forecast, by Component (2020-2032)
12.5.5.2. Market Revenue and Forecast, by Application (2020-2032)
12.5.5.3. Market Revenue and Forecast, by End-user (2020-2032)
12.5.5.4. Market Revenue and Forecast, by Therapeutic Area (2020-2032)
12.5.6. Rest of LATAM
12.5.6.1. Market Revenue and Forecast, by Component (2020-2032)
12.5.6.2. Market Revenue and Forecast, by Application (2020-2032)
12.5.6.3. Market Revenue and Forecast, by End-user (2020-2032)
12.5.6.4. Market Revenue and Forecast, by Therapeutic Area (2020-2032)
Chapter 13. Company Profiles
13.1. IQVIA
13.1.1. Company Overview
13.1.2. Product Offerings
13.1.3. Financial Performance
13.1.4. Recent Initiatives
13.2. IBM
13.2.1. Company Overview
13.2.2. Product Offerings
13.2.3. Financial Performance
13.2.4. Recent Initiatives
13.3. PPD Inc.
13.3.1. Company Overview
13.3.2. Product Offerings
13.3.3. Financial Performance
13.3.4. Recent Initiatives
13.4. Parexel International Corporation
13.4.1. Company Overview
13.4.2. Product Offerings
13.4.3. Financial Performance
13.4.4. Recent Initiatives
13.5. PerkinElmer Inc.
13.5.1. Company Overview
13.5.2. Product Offerings
13.5.3. Financial Performance
13.5.4. Recent Initiatives
13.6. Icon Plc
13.6.1. Company Overview
13.6.2. Product Offerings
13.6.3. Financial Performance
13.6.4. Recent Initiatives
13.7. Oracle
13.7.1. Company Overview
13.7.2. Product Offerings
13.7.3. Financial Performance
13.7.4. Recent Initiatives
13.8. Syneos Health
13.8.1. Company Overview
13.8.2. Product Offerings
13.8.3. Financial Performance
13.8.4. Recent Initiatives
13.9. Cegedim Health Data
13.9.1. Company Overview
13.9.2. Product Offerings
13.9.3. Financial Performance
13.9.4. Recent Initiatives
13.10. Medpace
13.10.1. Company Overview
13.10.2. Product Offerings
13.10.3. Financial Performance
13.10.4. Recent Initiatives
Chapter 14. Research Methodology
14.1. Primary Research
14.2. Secondary Research
14.3. Assumptions
Chapter 15. Appendix
15.1. About Us
15.2. Glossary of Terms
 Cross-segment Market Size and Analysis for
Mentioned Segments
Additional Company Profiles (Upto 5 With No Cost)
Additional Countries (Apart From Mentioned Countries)
Country/Region-specific Report
Go To Market Strategy
Region Specific Market DynamicsRegion Level Market Share Import Export AnalysisProduction AnalysisOthers
Cross-segment Market Size and Analysis for
Mentioned Segments
Additional Company Profiles (Upto 5 With No Cost)
Additional Countries (Apart From Mentioned Countries)
Country/Region-specific Report
Go To Market Strategy
Region Specific Market DynamicsRegion Level Market Share Import Export AnalysisProduction AnalysisOthers