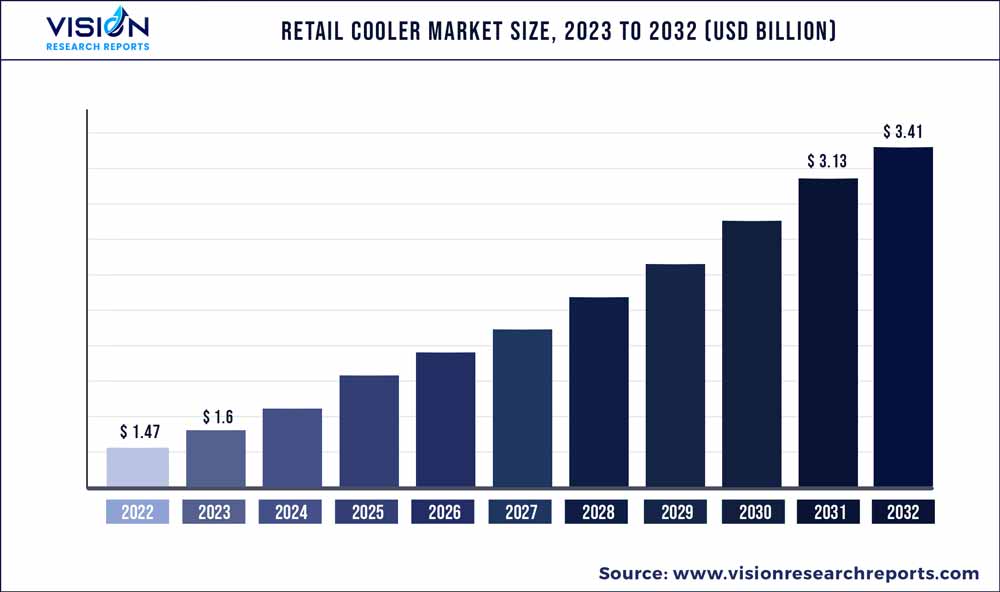
The global retail cooler market was valued at USD 1.47 billion in 2022 and it is predicted to surpass around USD 3.41 billion by 2032 with a CAGR of 8.77% from 2023 to 2032. The retail cooler market in the United States was accounted for USD 0.6 billion in 2022.

Key Pointers
Report Scope of the Retail Cooler Market
| Report Coverage | Details |
| Revenue Share of North America in 2022 | 39% |
| CAGR of Asia Pacific from 2023 to 2032 | 9.87% |
| Revenue Forecast by 2032 | USD 3.41 billion |
| Growth Rate from 2023 to 2032 | CAGR of 8.77% |
| Base Year | 2022 |
| Forecast Period | 2023 to 2032 |
| Market Analysis (Terms Used) | Value (US$ Million/Billion) or (Volume/Units) |
| Companies Covered | Polar Bear Coolers; Lifoam Industries LLC; ORCA Coolers, LLC; Plastilite Corporation; ICEE Containers Pty Ltd.; Bison Coolers; Grizzly Coolers LLC; Huntington Solutions; The Coleman Company, Inc.; YETI Holdings, Inc. |
A rise in the popularity of outdoor recreational activities such as off-roading and hiking among travelers is driving the market. In addition, improved manufacturing technologies for lightweight chillers that can keep ice for an extended period will contribute to market expansion over the foreseeable future. However, the COVID-19 pandemic has impacted the growth of the market. In the wake of the COVID-19 pandemic, customers are willing to spend more time in nature through activities such as hiking, camping, fishing, boating, and cycling, which is boosting the market demand for retail cooler. For instance, according to Outdoor Industry Association, Americans took up new activities such as hiking, walking, and running during the COVID-19 period.
Moreover, polystyrene coolers are perceived negatively as most products made from the material are dumped in landfills. Polystyrene materials also occupy a disproportionate amount of space by volume in a landfill on account of their bulky nature. Polystyrene coolers take approximately 500 years to decompose completely. Polystyrene is built of multiple units of styrene, which is believed to be carcinogenic by the Department of Health and Human Services and the International Agency for Research on Cancer.
Additionally, the rising number of hypermarkets, specialty food stores, and supermarkets across the globe has significantly boosted the adoption of retail cooler. According to The Food Institute, Costco is expected to open around 22 new warehouses each year, with 75% of them located in the U.S. The retailer also plans to open three new stores in Bradenton, Florida; Bismarck, North Dakota; and Plainfield, Illinois. Similarly, Walmart invested billions in new stores and improvements throughout 2019.
An increasing number of companies are striving for innovation in the sustainable space, particularly when it comes to choosing materials. For instance, NIKU Farms, a Toronto-based meat delivery service, opted for a new biodegradable and compostable packaging material from KTM Industries for its insulated coolers in 2019. NIKU became the first meat delivery service company to use KTM’s Green Cell Foam in Canada for its farm-to-door meat subscription boxes.
Furthermore, companies operating in the market cater to consumers worldwide, particularly in North America and Europe. Increasing innovation by these companies is rapidly transforming the product’s material composition. For instance, in 2019, Yeti launched Yeti V, a stainless-steel cooler that uses a combination of a vacuum and polyurethane foam in order to be able to store ice 50% longer than a regular Yeti cooler.
Capacity Insights
In terms of revenue, the above 50 quarts segment dominated the market with a share of over 55% in 2022. The high retention capacity is perfect for long road trips, days spent at campsites, and sporting events, which is fueling the demand for the segment. Moreover, the benefits such as heavy-duty wheels to roll the cooler through tough terrain with the rigged wheels while it’s fully loaded are driving this segment.
Below 10 quarts capacity is projected to register the highest CAGR of 9.83% from 2023 to 2032. The growing customer base of outdoor travelers for recreation is boosting the adoption of retail cooler with a small capacity. According to a blog by Northstar Travel Media LLC, solo travel comprised 18% of the global bookings in 2019, witnessing an increase of 7% as compared to the previous year. Furthermore, according to Cox & Kings, solo travel is the second-most popular category for post lockdown trips.
Distribution Channel Insights
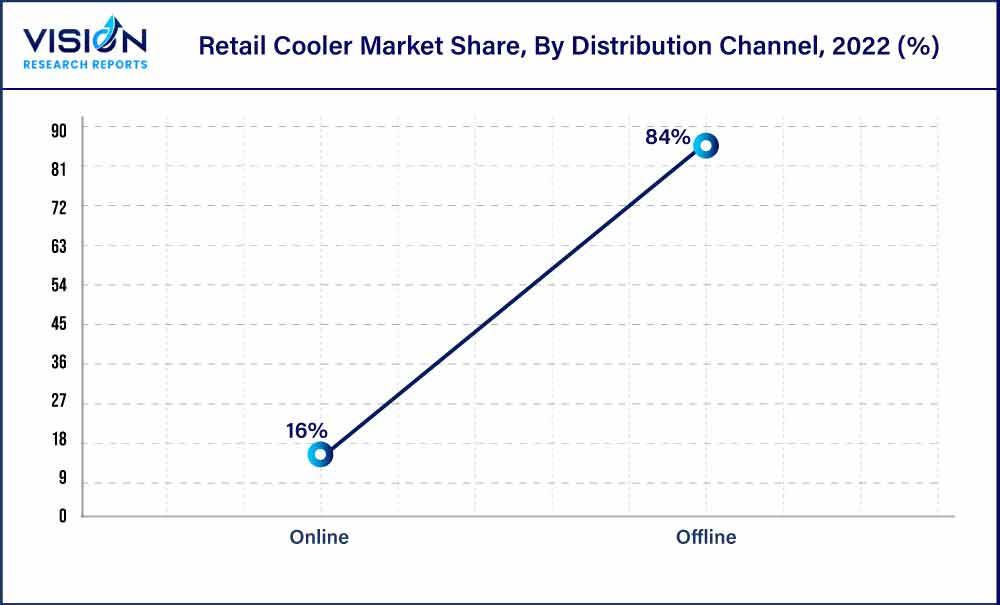
In terms of revenue, the offline segment dominated the market with a share of 84% in 2022. Growing urbanization, coupled with the expansion of supermarkets and hypermarkets to further extend their reach to maximum consumers, is expected to drive the sales of retail cooler through offline distribution channels across the globe over the forecast period. Moreover, major manufacturers in the market are inclined to sell their products via offline channels, positively impacting the growth of the segment.

The online segment is estimated to register the fastest CAGR of 9.83% over the forecast period. An increase in internet penetration among the middle-class population, coupled with the rising use of smartphones and similar devices, is the key factor driving the popularity of online channels in the market. For instance, in June 2019, YETI launched the YETO.ca.website in Canada to provide customers the opportunity to purchase YETI products directly online.
Regional Insights
North America dominated the market with a revenue share of over 39% in 2022. This is attributed to the high inclination of people in America toward outdoor recreational activities, short trips, and picnics, which is fueling the demand for retail cooler in the region. Moreover, consumers in the U.S. and Canada prefer to travel short distances with hassle-free planning and retail cooler are a convenient option for them.
Asia Pacific is expected to register the fastest CAGR of 9.87% from 2023 to 2032. The growth of the Asia Pacific market can be attributed to an increase in consumer interest in glamping among Asian households. In addition, several camping sites and adventure destinations are being developed at a fast pace in most of the countries in the Asia Pacific, including Thailand, Hong Kong, Cambodia, Australia, and India, which is likely to favor the growth of the market over the forecast period.
Retail Cooler Market Segmentations:
By Capacity
By Distribution Channel
By Regional
Chapter 1. Introduction
1.1. Research Objective
1.2. Scope of the Study
1.3. Definition
Chapter 2. Research Methodology
2.1. Research Approach
2.2. Data Sources
2.3. Assumptions & Limitations
Chapter 3. Executive Summary
3.1. Market Snapshot
Chapter 4. Market Variables and Scope
4.1. Introduction
4.2. Market Classification and Scope
4.3. Industry Value Chain Analysis
4.3.1. Raw Material Procurement Analysis
4.3.2. Sales and Distribution Channel Analysis
4.3.3. Downstream Buyer Analysis
Chapter 5. COVID 19 Impact on Retail Cooler Market
5.1. COVID-19 Landscape: Retail Cooler Industry Impact
5.2. COVID 19 - Impact Assessment for the Industry
5.3. COVID 19 Impact: Global Major Government Policy
5.4. Market Trends and Opportunities in the COVID-19 Landscape
Chapter 6. Market Dynamics Analysis and Trends
6.1. Market Dynamics
6.1.1. Market Drivers
6.1.2. Market Restraints
6.1.3. Market Opportunities
6.2. Porter’s Five Forces Analysis
6.2.1. Bargaining power of suppliers
6.2.2. Bargaining power of buyers
6.2.3. Threat of substitute
6.2.4. Threat of new entrants
6.2.5. Degree of competition
Chapter 7. Competitive Landscape
7.1.1. Company Market Share/Positioning Analysis
7.1.2. Key Strategies Adopted by Players
7.1.3. Vendor Landscape
7.1.3.1. List of Suppliers
7.1.3.2. List of Buyers
Chapter 8. Global Retail Cooler Market, By Capacity
8.1. Retail Cooler Market, by Capacity, 2023-2032
8.1.1. Below 10 Quarts
8.1.1.1. Market Revenue and Forecast (2020-2032)
8.1.2. Between 11-25 Quarts
8.1.2.1. Market Revenue and Forecast (2020-2032)
8.1.3. Between 26-50 Quarts
8.1.3.1. Market Revenue and Forecast (2020-2032)
8.1.4. Above 50 Quarts
8.1.4.1. Market Revenue and Forecast (2020-2032)
Chapter 9. Global Retail Cooler Market, By Distribution Channel
9.1. Retail Cooler Market, by Distribution Channel, 2023-2032
9.1.1. Offline
9.1.1.1. Market Revenue and Forecast (2020-2032)
9.1.2. Online
9.1.2.1. Market Revenue and Forecast (2020-2032)
Chapter 10. Global Retail Cooler Market, Regional Estimates and Trend Forecast
10.1. North America
10.1.1. Market Revenue and Forecast, by Capacity (2020-2032)
10.1.2. Market Revenue and Forecast, by Distribution Channel (2020-2032)
10.1.3. U.S.
10.1.3.1. Market Revenue and Forecast, by Capacity (2020-2032)
10.1.3.2. Market Revenue and Forecast, by Distribution Channel (2020-2032)
10.1.4. Rest of North America
10.1.4.1. Market Revenue and Forecast, by Capacity (2020-2032)
10.1.4.2. Market Revenue and Forecast, by Distribution Channel (2020-2032)
10.2. Europe
10.2.1. Market Revenue and Forecast, by Capacity (2020-2032)
10.2.2. Market Revenue and Forecast, by Distribution Channel (2020-2032)
10.2.3. UK
10.2.3.1. Market Revenue and Forecast, by Capacity (2020-2032)
10.2.3.2. Market Revenue and Forecast, by Distribution Channel (2020-2032)
10.2.4. Germany
10.2.4.1. Market Revenue and Forecast, by Capacity (2020-2032)
10.2.4.2. Market Revenue and Forecast, by Distribution Channel (2020-2032)
10.2.5. France
10.2.5.1. Market Revenue and Forecast, by Capacity (2020-2032)
10.2.5.2. Market Revenue and Forecast, by Distribution Channel (2020-2032)
10.2.6. Rest of Europe
10.2.6.1. Market Revenue and Forecast, by Capacity (2020-2032)
10.2.6.2. Market Revenue and Forecast, by Distribution Channel (2020-2032)
10.3. APAC
10.3.1. Market Revenue and Forecast, by Capacity (2020-2032)
10.3.2. Market Revenue and Forecast, by Distribution Channel (2020-2032)
10.3.3. India
10.3.3.1. Market Revenue and Forecast, by Capacity (2020-2032)
10.3.3.2. Market Revenue and Forecast, by Distribution Channel (2020-2032)
10.3.4. China
10.3.4.1. Market Revenue and Forecast, by Capacity (2020-2032)
10.3.4.2. Market Revenue and Forecast, by Distribution Channel (2020-2032)
10.3.5. Japan
10.3.5.1. Market Revenue and Forecast, by Capacity (2020-2032)
10.3.5.2. Market Revenue and Forecast, by Distribution Channel (2020-2032)
10.3.6. Rest of APAC
10.3.6.1. Market Revenue and Forecast, by Capacity (2020-2032)
10.3.6.2. Market Revenue and Forecast, by Distribution Channel (2020-2032)
10.4. MEA
10.4.1. Market Revenue and Forecast, by Capacity (2020-2032)
10.4.2. Market Revenue and Forecast, by Distribution Channel (2020-2032)
10.4.3. GCC
10.4.3.1. Market Revenue and Forecast, by Capacity (2020-2032)
10.4.3.2. Market Revenue and Forecast, by Distribution Channel (2020-2032)
10.4.4. North Africa
10.4.4.1. Market Revenue and Forecast, by Capacity (2020-2032)
10.4.4.2. Market Revenue and Forecast, by Distribution Channel (2020-2032)
10.4.5. South Africa
10.4.5.1. Market Revenue and Forecast, by Capacity (2020-2032)
10.4.5.2. Market Revenue and Forecast, by Distribution Channel (2020-2032)
10.4.6. Rest of MEA
10.4.6.1. Market Revenue and Forecast, by Capacity (2020-2032)
10.4.6.2. Market Revenue and Forecast, by Distribution Channel (2020-2032)
10.5. Latin America
10.5.1. Market Revenue and Forecast, by Capacity (2020-2032)
10.5.2. Market Revenue and Forecast, by Distribution Channel (2020-2032)
10.5.3. Brazil
10.5.3.1. Market Revenue and Forecast, by Capacity (2020-2032)
10.5.3.2. Market Revenue and Forecast, by Distribution Channel (2020-2032)
10.5.4. Rest of LATAM
10.5.4.1. Market Revenue and Forecast, by Capacity (2020-2032)
10.5.4.2. Market Revenue and Forecast, by Distribution Channel (2020-2032)
Chapter 11. Company Profiles
11.1. Polar Bear Coolers
11.1.1. Company Overview
11.1.2. Product Offerings
11.1.3. Financial Performance
11.1.4. Recent Initiatives
11.2. Lifoam Industries LLC
11.2.1. Company Overview
11.2.2. Product Offerings
11.2.3. Financial Performance
11.2.4. Recent Initiatives
11.3. ORCA Coolers, LLC
11.3.1. Company Overview
11.3.2. Product Offerings
11.3.3. Financial Performance
11.3.4. Recent Initiatives
11.4. Plastilite Corporation; ICEE Containers Pty Ltd.
11.4.1. Company Overview
11.4.2. Product Offerings
11.4.3. Financial Performance
11.4.4. LTE Scientific
11.5. Bison Coolers
11.5.1. Company Overview
11.5.2. Product Offerings
11.5.3. Financial Performance
11.5.4. Recent Initiatives
11.6. Grizzly Coolers LLC
11.6.1. Company Overview
11.6.2. Product Offerings
11.6.3. Financial Performance
11.6.4. Recent Initiatives
11.7. Huntington Solutions
11.7.1. Company Overview
11.7.2. Product Offerings
11.7.3. Financial Performance
11.7.4. Recent Initiatives
11.8. The Coleman Company, Inc.
11.8.1. Company Overview
11.8.2. Product Offerings
11.8.3. Financial Performance
11.8.4. Recent Initiatives
11.9. YETI Holdings, Inc.
11.9.1. Company Overview
11.9.2. Product Offerings
11.9.3. Financial Performance
11.9.4. Recent Initiatives
Chapter 12. Research Methodology
12.1. Primary Research
12.2. Secondary Research
12.3. Assumptions
Chapter 13. Appendix
13.1. About Us
13.2. Glossary of Terms
 Cross-segment Market Size and Analysis for
Mentioned Segments
 Additional Company Profiles (Upto 5 With No Cost)
 Additional Countries (Apart From Mentioned Countries)
 Country/Region-specific Report
 Go To Market Strategy
 Region Specific Market Dynamics
 Region Level Market Share
 Import Export Analysis
 Production Analysis
 Others