Robotic Process Automation Market Size, Share | Report 2023-2032
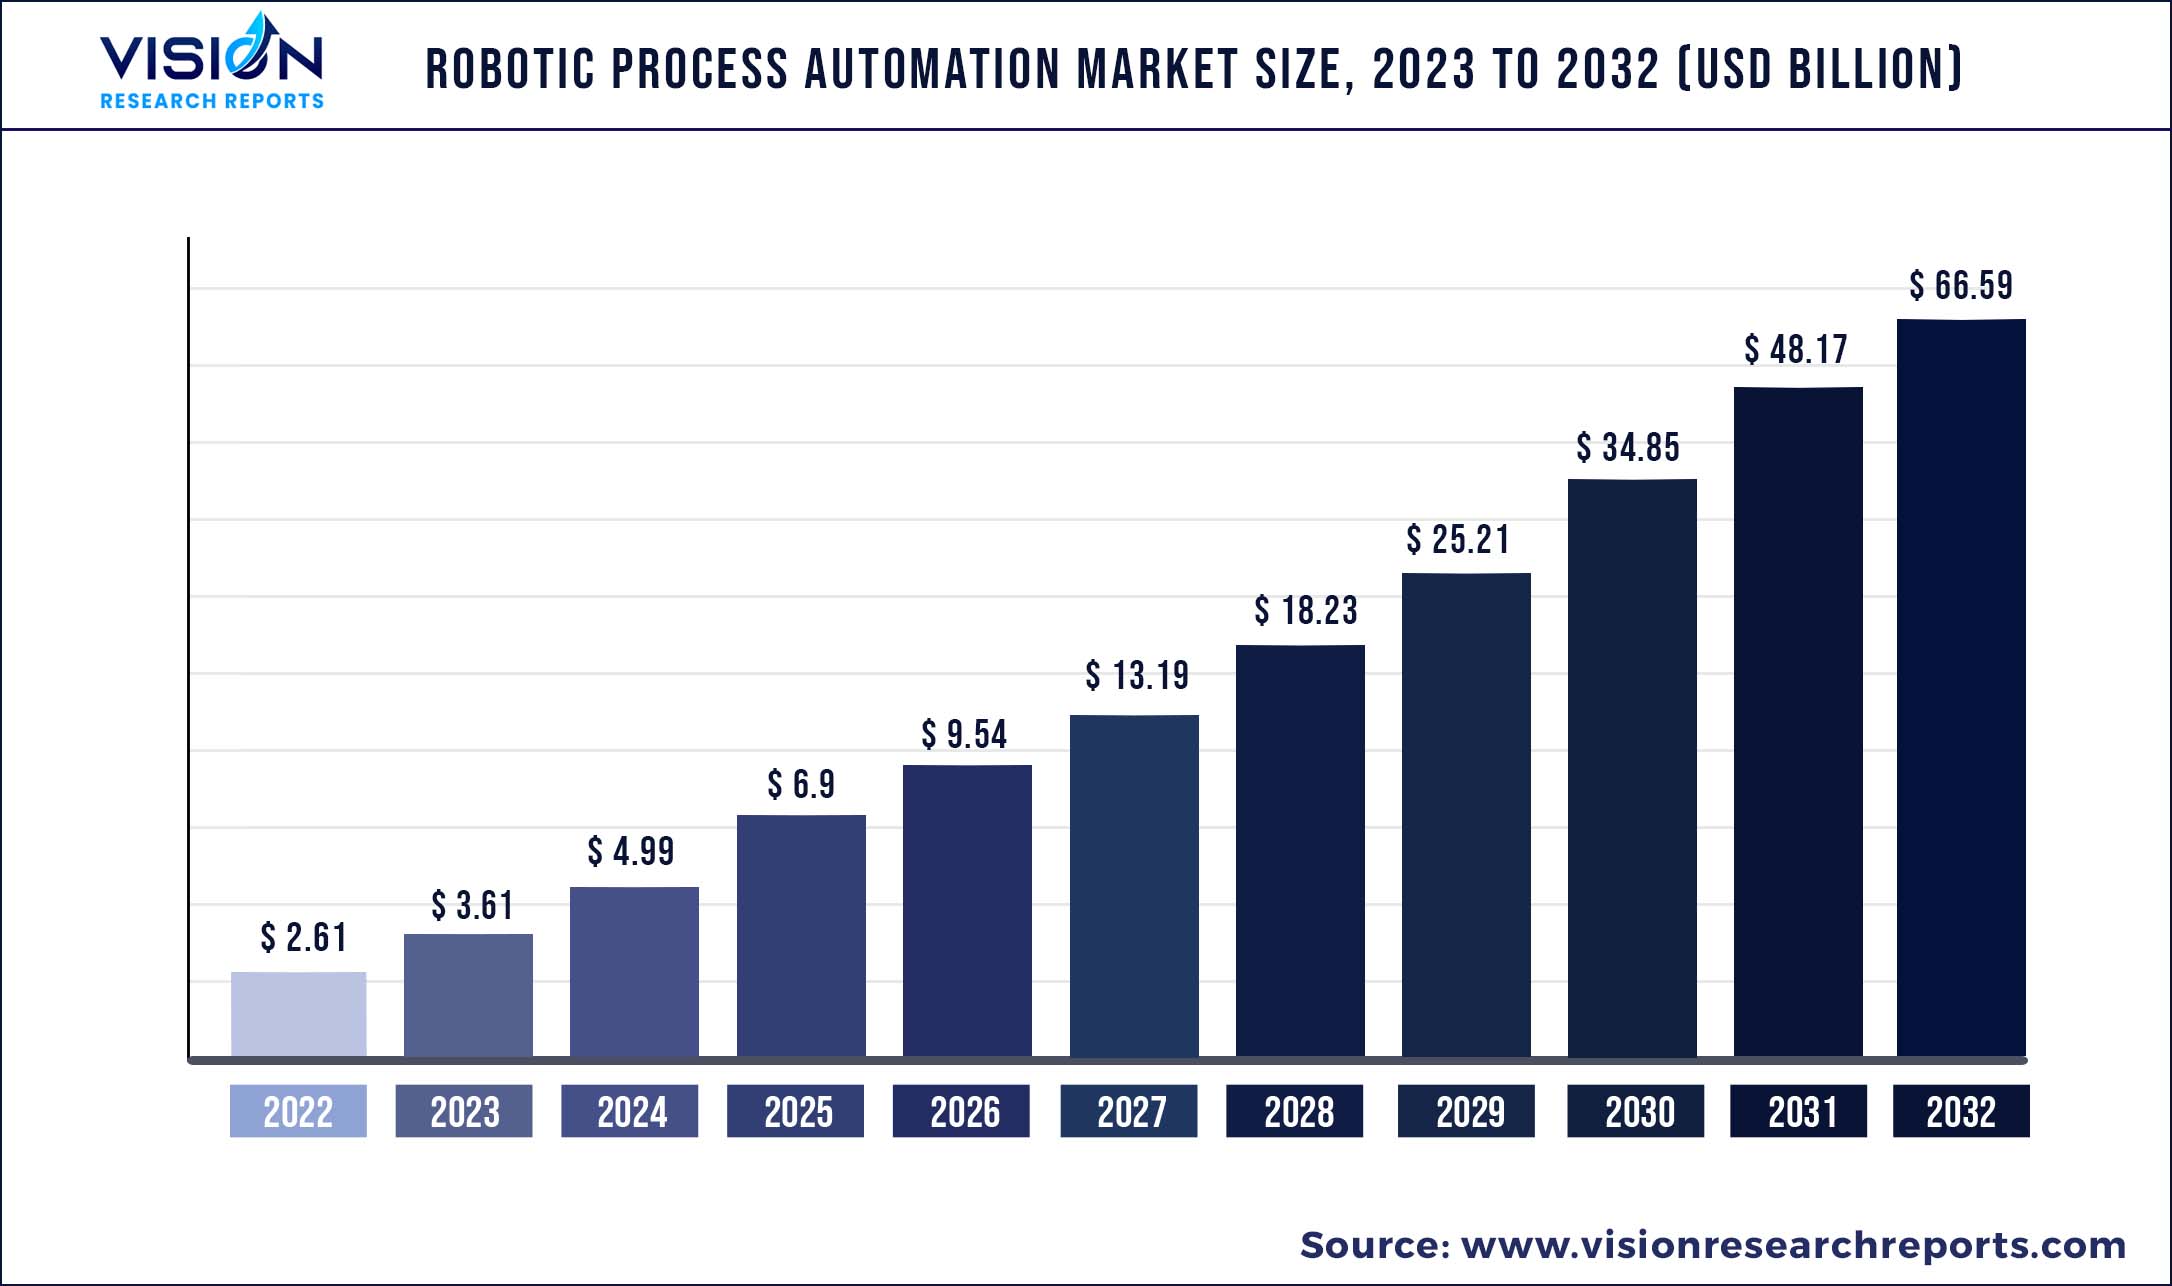
The global robotic process automation market was valued at USD 2.61 billion in 2022 and it is predicted to surpass around USD 66.59 billion by 2032 with a CAGR of 38.24% from 2023 to 2032.
Key Pointers
Report Scope of the Robotic Process Automation Market
| Report Coverage | Details |
| Market Size in 2022 | USD 2.61 billion |
| Revenue Forecast by 2032 | USD 66.59 billion |
| Growth rate from 2023 to 2032 | CAGR of 38.24% |
| Base Year | 2022 |
| Forecast Period | 2023 to 2032 |
| Regions Covered | North America, Europe, Asia Pacific, Latin America, Middle East & Africa |
| Companies Covered | Automation Anywhere; Blue Prism; EdgeVerve Systems Ltd.; FPT Software; KOFAX, Inc.; NICE; NTT Advanced Technology Corp.; OnviSource, Inc.; Pegasytems; UiPath |
Factors such as the need to optimize operations to gain improved productivity and generate maximum return, integration of the latest technologies, and changing business processes across enterprises is expected to boost the market growth. Furthermore, during the COVID-19 pandemic, businesses switched to remote work culture, and the need to automate workflow was also increased thus this factor accelerated the market growth. As RPA is becoming mature, it is anticipated to grow increasingly more sophisticated during the forecasted period. Technological advancement such as machine learning, Optical Character Recognition (OCR), and analytics within the RPA domain is potentially creating a demand for intelligent automation systems. As a result, intelligent automation is anticipated to eliminate more than 40% of service desk interactions by 2025. The combination of cognitive RPA and various chatbot technologies would enable unattended modes of automation at the services desk, thereby reducing human interventions and improving operational productivity.
The growing demand for automation of business processes is one of the significant factors influencing the increasing adoption of RPA technology. The core purpose of RPA is to document the activities of an organization for efficient management. Moreover, automated data collection provides seamless data entry & storage and eliminates errors and repetitions. Such practices reduce the time and cost required to rectify the mistakes in data gathering and processing. According to a survey conducted by UiPath (U.S.) in 2020, a global software company for robotic process automation, and The Economist Intelligence Unit (U.K.), a research and analysis division of the Economist Group, 90% of the organizations adopted RPA for automating business processes. In comparison, 73% of the surveyed agreed to be completely satisfied with the benefits resulting from automation.
Further, the increased demand to simplify the complex handling process is expected to augment the industry growth. Organizations across several verticals are deploying RPA and AI to increase productivity and efficiency. In a highly competitive market, it has become essential to improve work agility and deliver enhanced customer experiences. RPA robots can perform tasks across different legacy systems to get information on the digital platform. For instance, bank customers can check their account details online and process KYC verification and automatic bill payment along with other functions through the internet. These services have minimized manual involvement and are guiding in delivering a better customer experience.
Even though the market is anticipated to grow steadily due to the benefits mentioned above, the reluctance of companies to switch from manual to automated processes is expected to restrain the market growth. Organizations around the globe are looking at deploying RPA solutions to improve business processes. However, lack of understanding about the technology pose a barrier to the adoption of this software. Professional service providers are planning to implement RPA solutions in their organizations within the next two to three years.
Robotic Process Automation Market Segmentations:
| By Type | By Deployment | By Organization | By Application |
|
Software Service |
Cloud On-premise |
Large Enterprises Small & Medium Enterprises |
BFSI Pharma & Healthcare Retail & Consumer Goods Information Technology (IT) & Telecom Communication and Media & Education Manufacturing Logistics and Energy & Utilities Others |
Chapter 1. Introduction
1.1. Research Objective
1.2. Scope of the Study
1.3. Definition
Chapter 2. Research Methodology
2.1. Research Approach
2.2. Data Sources
2.3. Assumptions & Limitations
Chapter 3. Executive Summary
3.1. Market Snapshot
Chapter 4. Market Variables and Scope
4.1. Introduction
4.2. Market Classification and Scope
4.3. Industry Value Chain Analysis
4.3.1. Raw Material Procurement Analysis
4.3.2. Sales and Distribution Channel Analysis
4.3.3. Downstream Buyer Analysis
Chapter 5. COVID 19 Impact on Robotic Process Automation Market
5.1. COVID-19 Landscape: Robotic Process Automation Industry Impact
5.2. COVID 19 - Impact Assessment for the Industry
5.3. COVID 19 Impact: Global Major Government Policy
5.4. Market Trends and Opportunities in the COVID-19 Landscape
Chapter 6. Market Dynamics Analysis and Trends
6.1. Market Dynamics
6.1.1. Market Drivers
6.1.2. Market Restraints
6.1.3. Market Opportunities
6.2. Porter’s Five Forces Analysis
6.2.1. Bargaining power of suppliers
6.2.2. Bargaining power of buyers
6.2.3. Threat of substitute
6.2.4. Threat of new entrants
6.2.5. Degree of competition
Chapter 7. Competitive Landscape
7.1.1. Company Market Share/Positioning Analysis
7.1.2. Key Strategies Adopted by Players
7.1.3. Vendor Landscape
7.1.3.1. List of Suppliers
7.1.3.2. List of Buyers
Chapter 8. Global Robotic Process Automation Market, By Type
8.1. Robotic Process Automation Market, by Type, 2023-2032
8.1.1. Software
8.1.1.1. Market Revenue and Forecast (2020-2032)
8.1.2. Service
8.1.2.1. Market Revenue and Forecast (2020-2032)
Chapter 9. Global Robotic Process Automation Market, By Deployment
9.1. Robotic Process Automation Market, by Deployment, 2023-2032
9.1.1. Cloud
9.1.1.1. Market Revenue and Forecast (2020-2032)
9.1.2. On-premise
9.1.2.1. Market Revenue and Forecast (2020-2032)
Chapter 10. Global Robotic Process Automation Market, By Organization
10.1. Robotic Process Automation Market, by Organization, 2023-2032
10.1.1. Large Enterprises
10.1.1.1. Market Revenue and Forecast (2020-2032)
10.1.2. Small & Medium Enterprises
10.1.2.1. Market Revenue and Forecast (2020-2032)
Chapter 11. Global Robotic Process Automation Market, By Application
11.1. Robotic Process Automation Market, by Application, 2023-2032
11.1.1. BFSI
11.1.1.1. Market Revenue and Forecast (2020-2032)
11.1.2. Pharma & Healthcare
11.1.2.1. Market Revenue and Forecast (2020-2032)
11.1.3. Retail & Consumer Goods
11.1.3.1. Market Revenue and Forecast (2020-2032)
11.1.4. Information Technology (IT) & Telecom
11.1.4.1. Market Revenue and Forecast (2020-2032)
11.1.5. Communication and Media & Education
11.1.5.1. Market Revenue and Forecast (2020-2032)
11.1.6. Manufacturing
11.1.6.1. Market Revenue and Forecast (2020-2032)
11.1.7. Logistics and Energy & Utilities
11.1.7.1. Market Revenue and Forecast (2020-2032)
11.1.8. Others
11.1.8.1. Market Revenue and Forecast (2020-2032)
Chapter 12. Global Robotic Process Automation Market, Regional Estimates and Trend Forecast
12.1. North America
12.1.1. Market Revenue and Forecast, by Type (2020-2032)
12.1.2. Market Revenue and Forecast, by Deployment (2020-2032)
12.1.3. Market Revenue and Forecast, by Organization (2020-2032)
12.1.4. Market Revenue and Forecast, by Application (2020-2032)
12.1.5. U.S.
12.1.5.1. Market Revenue and Forecast, by Type (2020-2032)
12.1.5.2. Market Revenue and Forecast, by Deployment (2020-2032)
12.1.5.3. Market Revenue and Forecast, by Organization (2020-2032)
12.1.5.4. Market Revenue and Forecast, by Application (2020-2032)
12.1.6. Rest of North America
12.1.6.1. Market Revenue and Forecast, by Type (2020-2032)
12.1.6.2. Market Revenue and Forecast, by Deployment (2020-2032)
12.1.6.3. Market Revenue and Forecast, by Organization (2020-2032)
12.1.6.4. Market Revenue and Forecast, by Application (2020-2032)
12.2. Europe
12.2.1. Market Revenue and Forecast, by Type (2020-2032)
12.2.2. Market Revenue and Forecast, by Deployment (2020-2032)
12.2.3. Market Revenue and Forecast, by Organization (2020-2032)
12.2.4. Market Revenue and Forecast, by Application (2020-2032)
12.2.5. UK
12.2.5.1. Market Revenue and Forecast, by Type (2020-2032)
12.2.5.2. Market Revenue and Forecast, by Deployment (2020-2032)
12.2.5.3. Market Revenue and Forecast, by Organization (2020-2032)
12.2.5.4. Market Revenue and Forecast, by Application (2020-2032)
12.2.6. Germany
12.2.6.1. Market Revenue and Forecast, by Type (2020-2032)
12.2.6.2. Market Revenue and Forecast, by Deployment (2020-2032)
12.2.6.3. Market Revenue and Forecast, by Organization (2020-2032)
12.2.6.4. Market Revenue and Forecast, by Application (2020-2032)
12.2.7. France
12.2.7.1. Market Revenue and Forecast, by Type (2020-2032)
12.2.7.2. Market Revenue and Forecast, by Deployment (2020-2032)
12.2.7.3. Market Revenue and Forecast, by Organization (2020-2032)
12.2.7.4. Market Revenue and Forecast, by Application (2020-2032)
12.2.8. Rest of Europe
12.2.8.1. Market Revenue and Forecast, by Type (2020-2032)
12.2.8.2. Market Revenue and Forecast, by Deployment (2020-2032)
12.2.8.3. Market Revenue and Forecast, by Organization (2020-2032)
12.2.8.4. Market Revenue and Forecast, by Application (2020-2032)
12.3. APAC
12.3.1. Market Revenue and Forecast, by Type (2020-2032)
12.3.2. Market Revenue and Forecast, by Deployment (2020-2032)
12.3.3. Market Revenue and Forecast, by Organization (2020-2032)
12.3.4. Market Revenue and Forecast, by Application (2020-2032)
12.3.5. India
12.3.5.1. Market Revenue and Forecast, by Type (2020-2032)
12.3.5.2. Market Revenue and Forecast, by Deployment (2020-2032)
12.3.5.3. Market Revenue and Forecast, by Organization (2020-2032)
12.3.5.4. Market Revenue and Forecast, by Application (2020-2032)
12.3.6. China
12.3.6.1. Market Revenue and Forecast, by Type (2020-2032)
12.3.6.2. Market Revenue and Forecast, by Deployment (2020-2032)
12.3.6.3. Market Revenue and Forecast, by Organization (2020-2032)
12.3.6.4. Market Revenue and Forecast, by Application (2020-2032)
12.3.7. Japan
12.3.7.1. Market Revenue and Forecast, by Type (2020-2032)
12.3.7.2. Market Revenue and Forecast, by Deployment (2020-2032)
12.3.7.3. Market Revenue and Forecast, by Organization (2020-2032)
12.3.7.4. Market Revenue and Forecast, by Application (2020-2032)
12.3.8. Rest of APAC
12.3.8.1. Market Revenue and Forecast, by Type (2020-2032)
12.3.8.2. Market Revenue and Forecast, by Deployment (2020-2032)
12.3.8.3. Market Revenue and Forecast, by Organization (2020-2032)
12.3.8.4. Market Revenue and Forecast, by Application (2020-2032)
12.4. MEA
12.4.1. Market Revenue and Forecast, by Type (2020-2032)
12.4.2. Market Revenue and Forecast, by Deployment (2020-2032)
12.4.3. Market Revenue and Forecast, by Organization (2020-2032)
12.4.4. Market Revenue and Forecast, by Application (2020-2032)
12.4.5. GCC
12.4.5.1. Market Revenue and Forecast, by Type (2020-2032)
12.4.5.2. Market Revenue and Forecast, by Deployment (2020-2032)
12.4.5.3. Market Revenue and Forecast, by Organization (2020-2032)
12.4.5.4. Market Revenue and Forecast, by Application (2020-2032)
12.4.6. North Africa
12.4.6.1. Market Revenue and Forecast, by Type (2020-2032)
12.4.6.2. Market Revenue and Forecast, by Deployment (2020-2032)
12.4.6.3. Market Revenue and Forecast, by Organization (2020-2032)
12.4.6.4. Market Revenue and Forecast, by Application (2020-2032)
12.4.7. South Africa
12.4.7.1. Market Revenue and Forecast, by Type (2020-2032)
12.4.7.2. Market Revenue and Forecast, by Deployment (2020-2032)
12.4.7.3. Market Revenue and Forecast, by Organization (2020-2032)
12.4.7.4. Market Revenue and Forecast, by Application (2020-2032)
12.4.8. Rest of MEA
12.4.8.1. Market Revenue and Forecast, by Type (2020-2032)
12.4.8.2. Market Revenue and Forecast, by Deployment (2020-2032)
12.4.8.3. Market Revenue and Forecast, by Organization (2020-2032)
12.4.8.4. Market Revenue and Forecast, by Application (2020-2032)
12.5. Latin America
12.5.1. Market Revenue and Forecast, by Type (2020-2032)
12.5.2. Market Revenue and Forecast, by Deployment (2020-2032)
12.5.3. Market Revenue and Forecast, by Organization (2020-2032)
12.5.4. Market Revenue and Forecast, by Application (2020-2032)
12.5.5. Brazil
12.5.5.1. Market Revenue and Forecast, by Type (2020-2032)
12.5.5.2. Market Revenue and Forecast, by Deployment (2020-2032)
12.5.5.3. Market Revenue and Forecast, by Organization (2020-2032)
12.5.5.4. Market Revenue and Forecast, by Application (2020-2032)
12.5.6. Rest of LATAM
12.5.6.1. Market Revenue and Forecast, by Type (2020-2032)
12.5.6.2. Market Revenue and Forecast, by Deployment (2020-2032)
12.5.6.3. Market Revenue and Forecast, by Organization (2020-2032)
12.5.6.4. Market Revenue and Forecast, by Application (2020-2032)
Chapter 13. Company Profiles
13.1. Automation Anywhere
13.1.1. Company Overview
13.1.2. Product Offerings
13.1.3. Financial Performance
13.1.4. Recent Initiatives
13.2. Blue Prism
13.2.1. Company Overview
13.2.2. Product Offerings
13.2.3. Financial Performance
13.2.4. Recent Initiatives
13.3. EdgeVerve Systems Ltd.
13.3.1. Company Overview
13.3.2. Product Offerings
13.3.3. Financial Performance
13.3.4. Recent Initiatives
13.4. FPT Software
13.4.1. Company Overview
13.4.2. Product Offerings
13.4.3. Financial Performance
13.4.4. Recent Initiatives
13.5. KOFAX, Inc.
13.5.1. Company Overview
13.5.2. Product Offerings
13.5.3. Financial Performance
13.5.4. Recent Initiatives
13.6. NICE
13.6.1. Company Overview
13.6.2. Product Offerings
13.6.3. Financial Performance
13.6.4. Recent Initiatives
13.7. NTT Advanced Technology Corp.
13.7.1. Company Overview
13.7.2. Product Offerings
13.7.3. Financial Performance
13.7.4. Recent Initiatives
13.8. OnviSource, Inc.
13.8.1. Company Overview
13.8.2. Product Offerings
13.8.3. Financial Performance
13.8.4. Recent Initiatives
13.9. Pegasystems
13.9.1. Company Overview
13.9.2. Product Offerings
13.9.3. Financial Performance
13.9.4. Recent Initiatives
13.10. UiPath
13.10.1. Company Overview
13.10.2. Product Offerings
13.10.3. Financial Performance
13.10.4. Recent Initiatives
Chapter 14. Research Methodology
14.1. Primary Research
14.2. Secondary Research
14.3. Assumptions
Chapter 15. Appendix
15.1. About Us
15.2. Glossary of Terms
 Cross-segment Market Size and Analysis for
Mentioned Segments
Additional Company Profiles (Upto 5 With No Cost)
Additional Countries (Apart From Mentioned Countries)
Country/Region-specific Report
Go To Market Strategy
Region Specific Market DynamicsRegion Level Market Share Import Export AnalysisProduction AnalysisOthers
Cross-segment Market Size and Analysis for
Mentioned Segments
Additional Company Profiles (Upto 5 With No Cost)
Additional Countries (Apart From Mentioned Countries)
Country/Region-specific Report
Go To Market Strategy
Region Specific Market DynamicsRegion Level Market Share Import Export AnalysisProduction AnalysisOthers