Shared Mobility Market Size, Share, Growth, Trends | Report 2023-2032
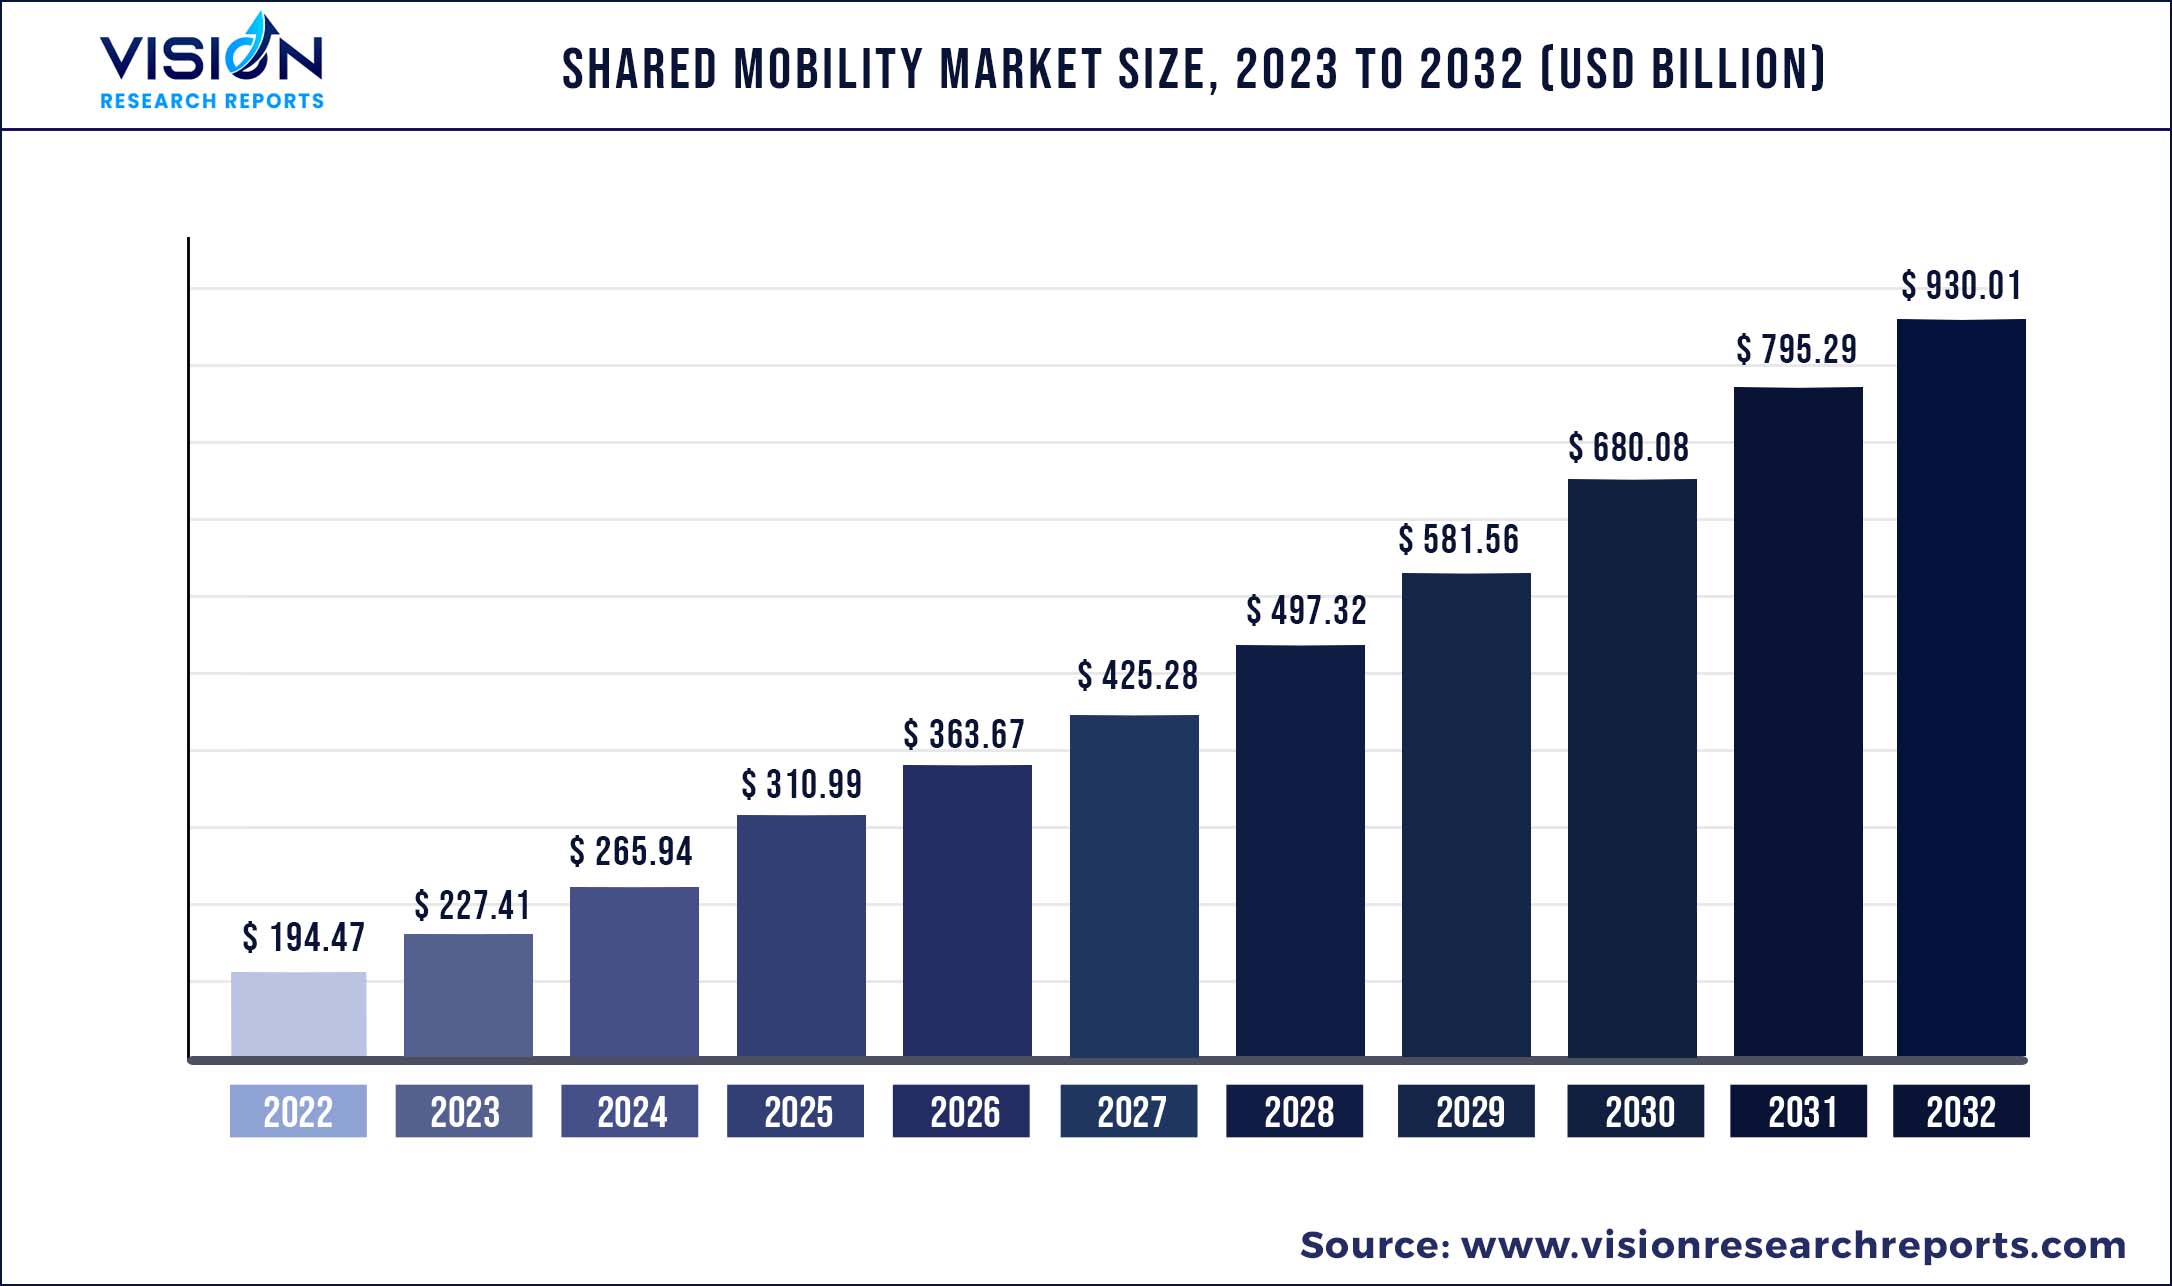
The global shared mobility market was estimated at USD 194.47 billion in 2022 and it is expected to surpass around USD 930.01 billion by 2032, poised to grow at a CAGR of 16.94% from 2023 to 2032.
Key Pointers
Report Scope of the Shared Mobility Market
| Report Coverage | Details |
| Market Size in 2022 | USD 194.47 billion |
| Revenue Forecast by 2032 | USD 930.01 billion |
| Growth rate from 2023 to 2032 | CAGR of 16.94% |
| Base Year | 2022 |
| Forecast Period | 2023 to 2032 |
| Regions Covered | North America, Europe, Asia Pacific, Latin America, Middle East & Africa |
| Companies Covered | Car2Go; Deutsche Bahn Connect GmbH; DiDi Chuxing; Drive Now (BMW); EVCARD; Flinkster; Grab; GreenGo; Lyft; Uber; Zipcar |
Shared mobility is an emerging market wherein transportation resources and services are shared concurrently or one after the other among its users. Apart from being cost-effective and environmentally friendly, shared mobility is also convenient. Because of this, shared mobility will only partially be able to replace car ownership. There has been observed a rise in customer demand for self-driving taxis and shuttles in comparatively lower density locations.
New modes and services have emerged like peer-to-peer car sharing, pooled ride-sharing, shared electric scooters, etc. This emergence has been attributed to their potential integration, automated processes, personalized travel on demand, and environment-friendly nature. The growth in penetration of connected cars and smartphones is one of the key factors driving the market for shared mobility. The increase in the cost of road vehicles and the cost of fuel, combined with a reduction in parking, especially in developed countries around the world, is estimated to boost the market growth in the coming years.
Additionally, shared mobility solutions are less expensive compared to other modes of transportation and eliminate limited parking problems. Various governments worldwide are launching programs to promote the growth of these solutions to reduce congestion. This has a significant impact on commuters' lifestyles and the market as a whole, such as increased accessibility, improved transportation, reduced driving, and decreased personal car ownership. Environmental, social, and transportation system benefits are frequently realized through shared mobility schemes. Multiple ways in which commuters commute are public transit which is through shared public transport, Micro mobility (bike-sharing or scooter sharing), Automobile-based mode (via car sharing, rides, micro-transit, and Ride on-demand), Commute-based modes or ridesharing (car or vanpooling).
Other reasons that support the growth of the market for shared mobility would be lack of parking space, growing traffic congestion on the road, high cost of owning personal vehicles, and mainly high fuel prices. With rising growth in private sector employment, the market is expected to grow further since many private-sector employees would want to commute through shared mobility services. COVID-19 has had a negative impact on expanding the market for shared mobility due to changes in mobility patterns of people worldwide. Mobility of people during the pandemic decreased significantly, also diminishing the number of visits to workplaces which was one of the main reasons and drivers of the market.
The pandemic has also led to a shift in priorities regarding Commute. Pre-COVID, the emphasis of commuters would be the cost of service, convenience, and other variables like time taken and mode of transport. Now, commuters look for safe, sanitized, and lower risk of infection modes of transportation. Hence, considering health as a priority is likely to decrease the use of sharing and public transport. Moreover, due to the loss of demand in the market, car-sharing services were either reduced or suspended during the global pandemic.
Shared Mobility Market Segmentations:
| By Service Model | By Vehicles |
|
Ride Hailing Bike Sharing Ride Sharing Car Sharing Others |
Cars Two-Wheelers Others |
Chapter 1. Introduction
1.1. Research Objective
1.2. Scope of the Study
1.3. Definition
Chapter 2. Research Methodology
2.1. Research Approach
2.2. Data Sources
2.3. Assumptions & Limitations
Chapter 3. Executive Summary
3.1. Market Snapshot
Chapter 4. Market Variables and Scope
4.1. Introduction
4.2. Market Classification and Scope
4.3. Industry Value Chain Analysis
4.3.1. Raw Material Procurement Analysis
4.3.2. Sales and Distribution Channel Analysis
4.3.3. Downstream Buyer Analysis
Chapter 5. COVID 19 Impact on Shared Mobility Market
5.1. COVID-19 Landscape: Shared Mobility Industry Impact
5.2. COVID 19 - Impact Assessment for the Industry
5.3. COVID 19 Impact: Global Major Government Policy
5.4. Market Trends and Opportunities in the COVID-19 Landscape
Chapter 6. Market Dynamics Analysis and Trends
6.1. Market Dynamics
6.1.1. Market Drivers
6.1.2. Market Restraints
6.1.3. Market Opportunities
6.2. Porter’s Five Forces Analysis
6.2.1. Bargaining power of suppliers
6.2.2. Bargaining power of buyers
6.2.3. Threat of substitute
6.2.4. Threat of new entrants
6.2.5. Degree of competition
Chapter 7. Competitive Landscape
7.1.1. Company Market Share/Positioning Analysis
7.1.2. Key Strategies Adopted by Players
7.1.3. Vendor Landscape
7.1.3.1. List of Suppliers
7.1.3.2. List of Buyers
Chapter 8. Global Shared Mobility Market, By Service Model
8.1. Shared Mobility Market, by Service Model, 2023-2032
8.1.1. Ride Hailing
8.1.1.1. Market Revenue and Forecast (2020-2032)
8.1.2. Bike Sharing
8.1.2.1. Market Revenue and Forecast (2020-2032)
8.1.3. Ride Sharing
8.1.3.1. Market Revenue and Forecast (2020-2032)
8.1.4. Car Sharing
8.1.4.1. Market Revenue and Forecast (2020-2032)
8.1.5. Others
8.1.5.1. Market Revenue and Forecast (2020-2032)
Chapter 9. Global Shared Mobility Market, By Vehicles
9.1. Shared Mobility Market, by Vehicles, 2023-2032
9.1.1. Cars
9.1.1.1. Market Revenue and Forecast (2020-2032)
9.1.2. Two-Wheelers
9.1.2.1. Market Revenue and Forecast (2020-2032)
9.1.3. Others
9.1.3.1. Market Revenue and Forecast (2020-2032)
Chapter 10. Global Shared Mobility Market, Regional Estimates and Trend Forecast
10.1. North America
10.1.1. Market Revenue and Forecast, by Service Model (2020-2032)
10.1.2. Market Revenue and Forecast, by Vehicles (2020-2032)
10.1.3. U.S.
10.1.3.1. Market Revenue and Forecast, by Service Model (2020-2032)
10.1.3.2. Market Revenue and Forecast, by Vehicles (2020-2032)
10.1.4. Rest of North America
10.1.4.1. Market Revenue and Forecast, by Service Model (2020-2032)
10.1.4.2. Market Revenue and Forecast, by Vehicles (2020-2032)
10.2. Europe
10.2.1. Market Revenue and Forecast, by Service Model (2020-2032)
10.2.2. Market Revenue and Forecast, by Vehicles (2020-2032)
10.2.3. UK
10.2.3.1. Market Revenue and Forecast, by Service Model (2020-2032)
10.2.3.2. Market Revenue and Forecast, by Vehicles (2020-2032)
10.2.4. Germany
10.2.4.1. Market Revenue and Forecast, by Service Model (2020-2032)
10.2.4.2. Market Revenue and Forecast, by Vehicles (2020-2032)
10.2.5. France
10.2.5.1. Market Revenue and Forecast, by Service Model (2020-2032)
10.2.5.2. Market Revenue and Forecast, by Vehicles (2020-2032)
10.2.6. Rest of Europe
10.2.6.1. Market Revenue and Forecast, by Service Model (2020-2032)
10.2.6.2. Market Revenue and Forecast, by Vehicles (2020-2032)
10.3. APAC
10.3.1. Market Revenue and Forecast, by Service Model (2020-2032)
10.3.2. Market Revenue and Forecast, by Vehicles (2020-2032)
10.3.3. India
10.3.3.1. Market Revenue and Forecast, by Service Model (2020-2032)
10.3.3.2. Market Revenue and Forecast, by Vehicles (2020-2032)
10.3.4. China
10.3.4.1. Market Revenue and Forecast, by Service Model (2020-2032)
10.3.4.2. Market Revenue and Forecast, by Vehicles (2020-2032)
10.3.5. Japan
10.3.5.1. Market Revenue and Forecast, by Service Model (2020-2032)
10.3.5.2. Market Revenue and Forecast, by Vehicles (2020-2032)
10.3.6. Rest of APAC
10.3.6.1. Market Revenue and Forecast, by Service Model (2020-2032)
10.3.6.2. Market Revenue and Forecast, by Vehicles (2020-2032)
10.4. MEA
10.4.1. Market Revenue and Forecast, by Service Model (2020-2032)
10.4.2. Market Revenue and Forecast, by Vehicles (2020-2032)
10.4.3. GCC
10.4.3.1. Market Revenue and Forecast, by Service Model (2020-2032)
10.4.3.2. Market Revenue and Forecast, by Vehicles (2020-2032)
10.4.4. North Africa
10.4.4.1. Market Revenue and Forecast, by Service Model (2020-2032)
10.4.4.2. Market Revenue and Forecast, by Vehicles (2020-2032)
10.4.5. South Africa
10.4.5.1. Market Revenue and Forecast, by Service Model (2020-2032)
10.4.5.2. Market Revenue and Forecast, by Vehicles (2020-2032)
10.4.6. Rest of MEA
10.4.6.1. Market Revenue and Forecast, by Service Model (2020-2032)
10.4.6.2. Market Revenue and Forecast, by Vehicles (2020-2032)
10.5. Latin America
10.5.1. Market Revenue and Forecast, by Service Model (2020-2032)
10.5.2. Market Revenue and Forecast, by Vehicles (2020-2032)
10.5.3. Brazil
10.5.3.1. Market Revenue and Forecast, by Service Model (2020-2032)
10.5.3.2. Market Revenue and Forecast, by Vehicles (2020-2032)
10.5.4. Rest of LATAM
10.5.4.1. Market Revenue and Forecast, by Service Model (2020-2032)
10.5.4.2. Market Revenue and Forecast, by Vehicles (2020-2032)
Chapter 11. Company Profiles
11.1. Car2Go
11.1.1. Company Overview
11.1.2. Product Offerings
11.1.3. Financial Performance
11.1.4. Recent Initiatives
11.2. Deutsche Bahn Connect GmbH
11.2.1. Company Overview
11.2.2. Product Offerings
11.2.3. Financial Performance
11.2.4. Recent Initiatives
11.3. DiDi Chuxing
11.3.1. Company Overview
11.3.2. Product Offerings
11.3.3. Financial Performance
11.3.4. Recent Initiatives
11.4. Drive Now (BMW)
11.4.1. Company Overview
11.4.2. Product Offerings
11.4.3. Financial Performance
11.4.4. LTE Scientific
11.5. EVCARD
11.5.1. Company Overview
11.5.2. Product Offerings
11.5.3. Financial Performance
11.5.4. Recent Initiatives
11.6. Flinkster
11.6.1. Company Overview
11.6.2. Product Offerings
11.6.3. Financial Performance
11.6.4. Recent Initiatives
11.7. Grab
11.7.1. Company Overview
11.7.2. Product Offerings
11.7.3. Financial Performance
11.7.4. Recent Initiatives
11.8. GreenGo
11.8.1. Company Overview
11.8.2. Product Offerings
11.8.3. Financial Performance
11.8.4. Recent Initiatives
11.9. Lyft
11.9.1. Company Overview
11.9.2. Product Offerings
11.9.3. Financial Performance
11.9.4. Recent Initiatives
11.10. Uber
11.10.1. Company Overview
11.10.2. Product Offerings
11.10.3. Financial Performance
11.10.4. Recent Initiatives
Chapter 12. Research Methodology
12.1. Primary Research
12.2. Secondary Research
12.3. Assumptions
Chapter 13. Appendix
13.1. About Us
13.2. Glossary of Terms
 Cross-segment Market Size and Analysis for
Mentioned Segments
Additional Company Profiles (Upto 5 With No Cost)
Additional Countries (Apart From Mentioned Countries)
Country/Region-specific Report
Go To Market Strategy
Region Specific Market DynamicsRegion Level Market Share Import Export AnalysisProduction AnalysisOthers
Cross-segment Market Size and Analysis for
Mentioned Segments
Additional Company Profiles (Upto 5 With No Cost)
Additional Countries (Apart From Mentioned Countries)
Country/Region-specific Report
Go To Market Strategy
Region Specific Market DynamicsRegion Level Market Share Import Export AnalysisProduction AnalysisOthers