Small-scale Bioreactors Market Size, Trends, Share, Growth | Report 2023-2032
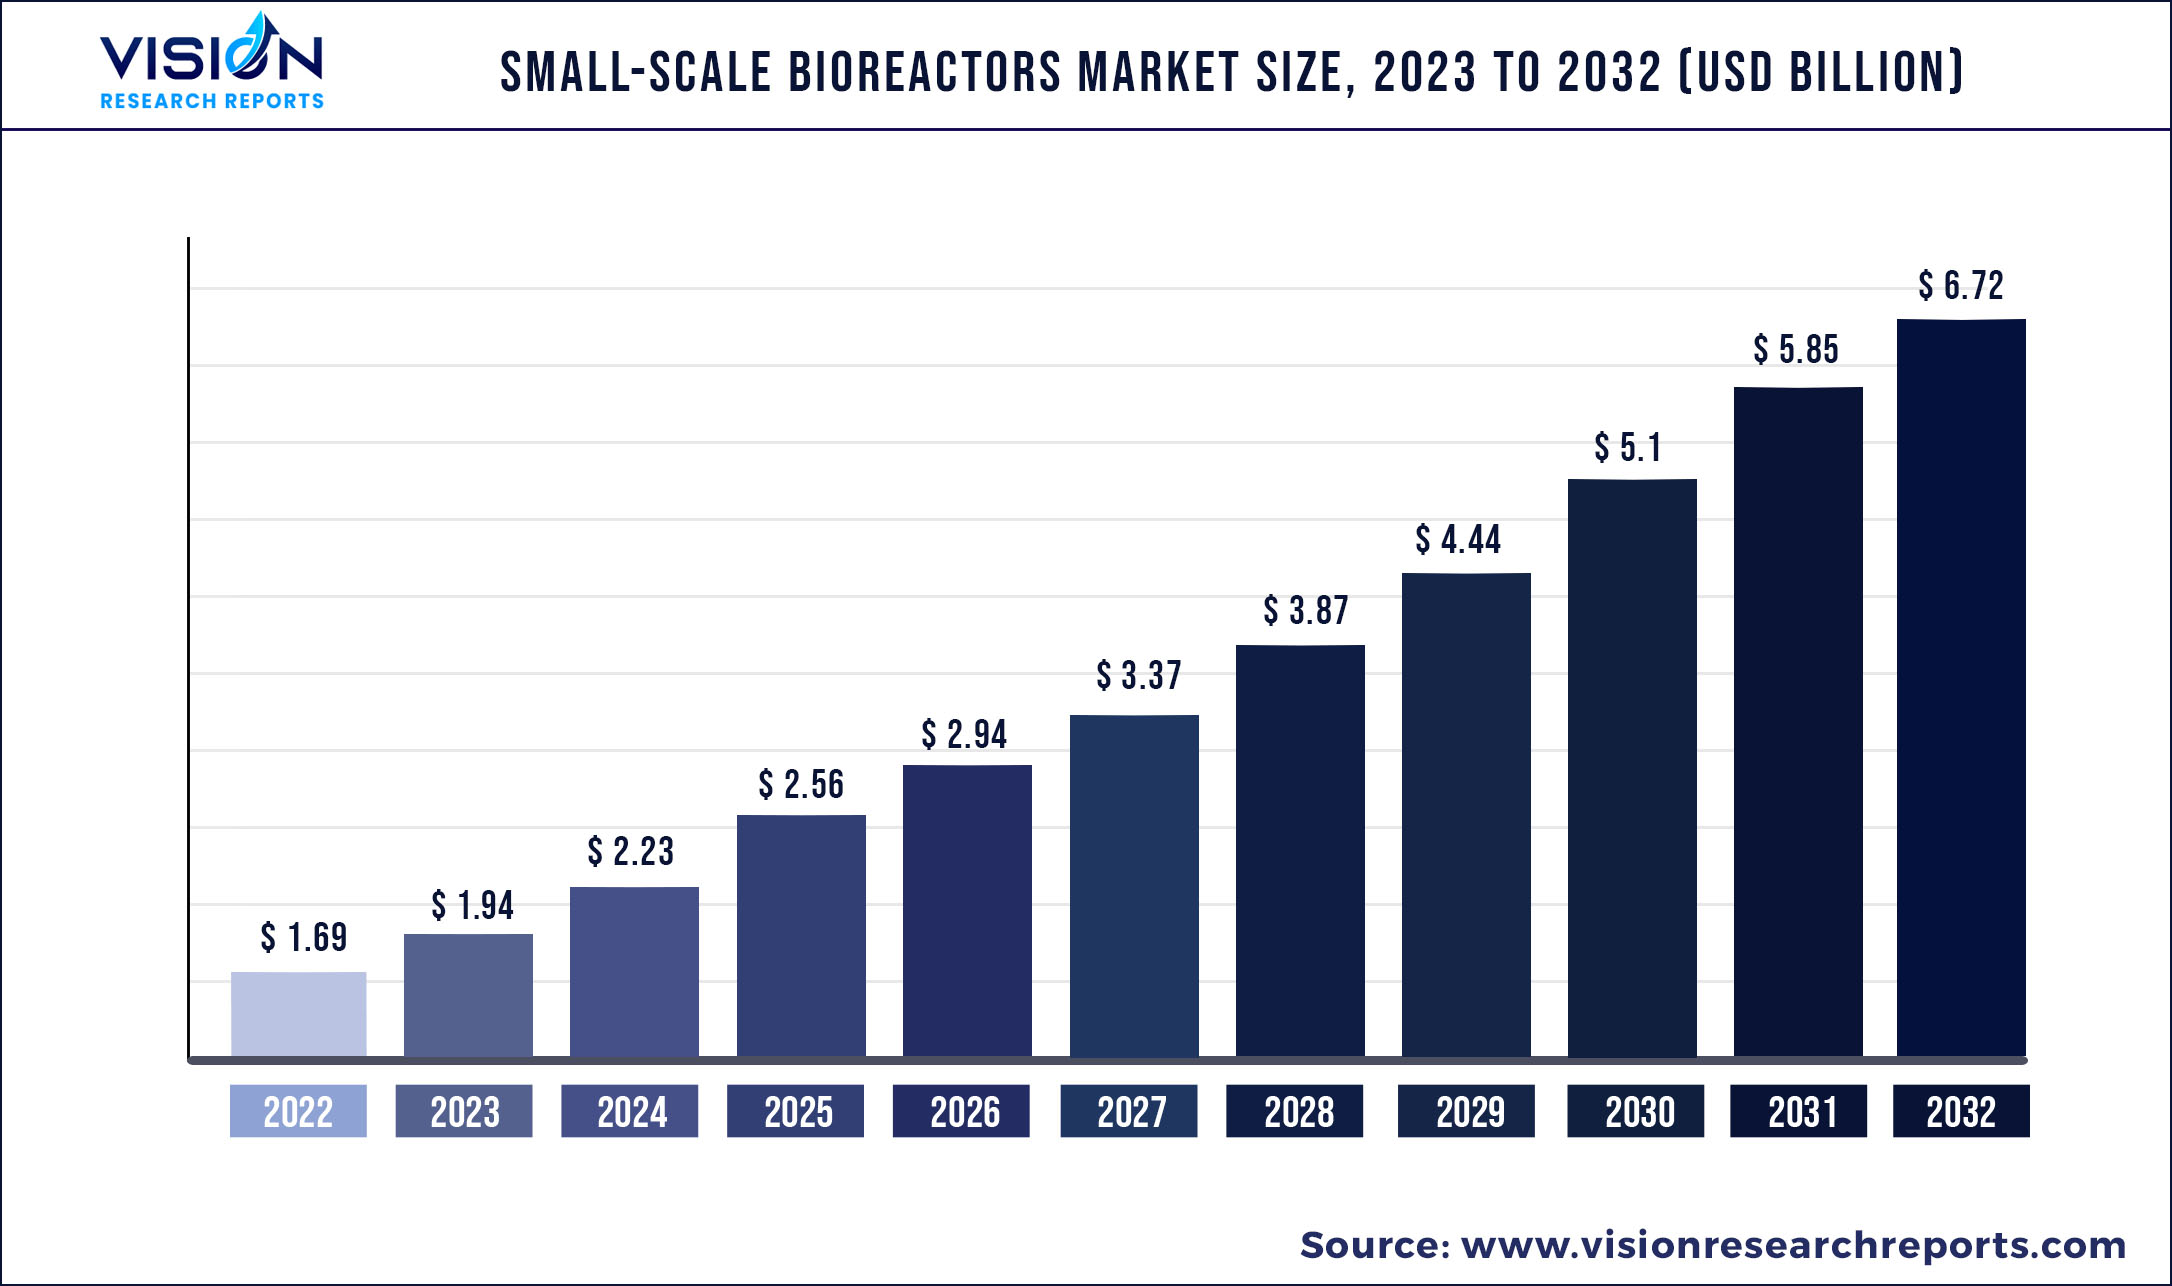
The global small-scale bioreactors market was surpassed at USD 1.69 billion in 2022 and is expected to hit around USD 6.72 billion by 2032, growing at a CAGR of 14.8% from 2023 to 2032.
Key Pointers
Report Scope of the Small-scale Bioreactors Market
| Report Coverage | Details |
| Market Size in 2022 | USD 1.69 billion |
| Revenue Forecast by 2032 | USD 6.72 billion |
| Growth rate from 2023 to 2032 | CAGR of 14.8% |
| Base Year | 2022 |
| Forecast Period | 2023 to 2032 |
| Market Analysis (Terms Used) | Value (US$ Million/Billion) or (Volume/Units) |
| Regions Covered | North America, Europe, Asia Pacific, Latin America, Middle East & Africa |
| Companies Covered | Sartorius AG; Thermo Fisher Scientific Inc.; Merck KGaA; Danaher Corp.; Lonza Group; Eppendorf AG; Miltenyi Biotec; Getinge AB; Solaris Biotechnology Srl; Infors AG |
The key drivers responsible for the market growth include the wide-scale product usage in the pharmaceutical industry along with portfolio expansion by major players. Small-scale bioreactors are essential for the development and optimization of processes, therefore they are frequently used in pharmaceutical and biopharmaceutical research. These bioprocessing equipment are generally used for small-scale production and range in size from a few milliliters to 5-10 L. The COVID-19 pandemic has witnessed an increased demand as a result of the sudden rise in COVID-19 cases.
The sales of small-scale bioreactors significantly increased in 2020 and 2021 as a result of numerous businesses expanding their facilities to carry out R&D for COVID-19 vaccines. Moreover, the worldwide immunization campaigns around the globe and the rising demand are expected to increase product sales during the forecast period. In addition, heavy investments by government authorities to improve biopharmaceutical research and the development of a vaccine are also influencing the industry’s growth. For instance, the South Korean government allocated USD 250 million in April 2020 to launch the Vaccine Innovative Technology Alliance (VITAL), which will help with vaccine research, production, and use. To make South Korea the fifth-largest vaccine manufacturer throughout the globe by 2025 and reach 80% vaccine self-sufficiency, the nation has spent an additional $2 billion on the K Vaccine program.
Moreover, the rising prevalence of chronic diseases, such as cancer, cardiac disease, diabetes, and hypertension, has led to more focus on the development of innovative biological therapies. Similarly, the demand for monoclonal antibodies as well as personalized medicines has increased bioproduction, accelerating small-scale bioreactor demand. Furthermore, the rising usage of high-end technologies to simplify complex manufacturing will enhance the demand for small-scale bioreactors during the forecast period. In addition, the high investments in research and development activities by key biopharmaceutical companies are expected to drive industry growth. For instance, in august 2021, PBS Biotech, a manufacturer of single-use bioprocessing devices, completed a USD 10 million private financing round with BroadOak Capital Partners.
With the funds, the company will have the opportunity to grow and commercialize its line of single-use bioreactor devices and outsourced process design services. Due to the demand for superior quality and better efficiency in drug manufacturing, the biopharmaceutical industry is quickly shifting toward the use of single-use bioprocessing systems with integrated real-time monitoring and technical analysis that can facilitate automation, enhance data-driven quality control, and continue driving performance. Therefore, it is expected that the shift toward advanced bioprocessing technology devices, such as small-scale bioreactors, will propel the growth of this market.
Small-scale Bioreactors Market Segmentations:
By Product
By Capacity
By End-user
Chapter 1. Introduction
1.1. Research Objective
1.2. Scope of the Study
1.3. Definition
Chapter 2. Research Methodology
2.1. Research Approach
2.2. Data Sources
2.3. Assumptions & Limitations
Chapter 3. Executive Summary
3.1. Market Snapshot
Chapter 4. Market Variables and Scope
4.1. Introduction
4.2. Market Classification and Scope
4.3. Industry Value Chain Analysis
4.3.1. Raw Material Procurement Analysis
4.3.2. Sales and Distribution Product Analysis
4.3.3. Downstream Buyer Analysis
Chapter 5. COVID 19 Impact on Small-scale Bioreactors Market
5.1. COVID-19 Landscape: Small-scale Bioreactors Industry Impact
5.2. COVID 19 - Impact Assessment for the Industry
5.3. COVID 19 Impact: Global Major Government Policy
5.4. Market Trends and Opportunities in the COVID-19 Landscape
Chapter 6. Market Dynamics Analysis and Trends
6.1. Market Dynamics
6.1.1. Market Drivers
6.1.2. Market Restraints
6.1.3. Market Opportunities
6.2. Porter’s Five Forces Analysis
6.2.1. Bargaining power of suppliers
6.2.2. Bargaining power of buyers
6.2.3. Threat of substitute
6.2.4. Threat of new entrants
6.2.5. Degree of competition
Chapter 7. Competitive Landscape
7.1.1. Company Market Share/Positioning Analysis
7.1.2. Key Strategies Adopted by Players
7.1.3. Vendor Landscape
7.1.3.1. List of Suppliers
7.1.3.2. List of Buyers
Chapter 8. Global Small-scale Bioreactors Market, By Product
8.1. Small-scale Bioreactors Market, by Product, 2023-2032
8.1.1 Reusable Bioreactors
8.1.1.1. Market Revenue and Forecast (2020-2032)
8.1.2. Single-use Bioreactors
8.1.2.1. Market Revenue and Forecast (2020-2032)
Chapter 9. Global Small-scale Bioreactors Market, By Capacity
9.1. Small-scale Bioreactors Market, by Capacity, 2023-2032
9.1.1. 5 ML -100 ML
9.1.1.1. Market Revenue and Forecast (2020-2032)
9.1.2. 100 ML-250 ML
9.1.2.1. Market Revenue and Forecast (2020-2032)
9.1.3. 250 ML -500 ML
9.1.3.1. Market Revenue and Forecast (2020-2032)
9.1.4. 500 ML-1 L
9.1.4.1. Market Revenue and Forecast (2020-2032)
9.1.5. 1L-3L
9.1.5.1. Market Revenue and Forecast (2020-2032)
9.1.6. 3L-5L
9.1.6.1. Market Revenue and Forecast (2020-2032)
Chapter 10. Global Small-scale Bioreactors Market, By End-user
10.1. Small-scale Bioreactors Market, by End-user, 2023-2032
10.1.1. Pharmaceutical & Biopharmaceutical Companies
10.1.1.1. Market Revenue and Forecast (2020-2032)
10.1.2. CROs & CMOs
10.1.2.1. Market Revenue and Forecast (2020-2032)
10.1.3. Academic & Research Institutes
10.1.3.1. Market Revenue and Forecast (2020-2032)
Chapter 11. Global Small-scale Bioreactors Market, Regional Estimates and Trend Forecast
11.1. North America
11.1.1. Market Revenue and Forecast, by Product (2020-2032)
11.1.2. Market Revenue and Forecast, by Capacity (2020-2032)
11.1.3. Market Revenue and Forecast, by End-user (2020-2032)
11.1.4. U.S.
11.1.4.1. Market Revenue and Forecast, by Product (2020-2032)
11.1.4.2. Market Revenue and Forecast, by Capacity (2020-2032)
11.1.4.3. Market Revenue and Forecast, by End-user (2020-2032)
11.1.5. Rest of North America
11.1.5.1. Market Revenue and Forecast, by Product (2020-2032)
11.1.5.2. Market Revenue and Forecast, by Capacity (2020-2032)
11.1.5.3. Market Revenue and Forecast, by End-user (2020-2032)
11.2. Europe
11.2.1. Market Revenue and Forecast, by Product (2020-2032)
11.2.2. Market Revenue and Forecast, by Capacity (2020-2032)
11.2.3. Market Revenue and Forecast, by End-user (2020-2032)
11.2.4. UK
11.2.4.1. Market Revenue and Forecast, by Product (2020-2032)
11.2.4.2. Market Revenue and Forecast, by Capacity (2020-2032)
11.2.4.3. Market Revenue and Forecast, by End-user (2020-2032)
11.2.5. Germany
11.2.5.1. Market Revenue and Forecast, by Product (2020-2032)
11.2.5.2. Market Revenue and Forecast, by Capacity (2020-2032)
11.2.5.3. Market Revenue and Forecast, by End-user (2020-2032)
11.2.6. France
11.2.6.1. Market Revenue and Forecast, by Product (2020-2032)
11.2.6.2. Market Revenue and Forecast, by Capacity (2020-2032)
11.2.6.3. Market Revenue and Forecast, by End-user (2020-2032)
11.2.7. Rest of Europe
11.2.7.1. Market Revenue and Forecast, by Product (2020-2032)
11.2.7.2. Market Revenue and Forecast, by Capacity (2020-2032)
11.2.7.3. Market Revenue and Forecast, by End-user (2020-2032)
11.3. APAC
11.3.1. Market Revenue and Forecast, by Product (2020-2032)
11.3.2. Market Revenue and Forecast, by Capacity (2020-2032)
11.3.3. Market Revenue and Forecast, by End-user (2020-2032)
11.3.4. India
11.3.4.1. Market Revenue and Forecast, by Product (2020-2032)
11.3.4.2. Market Revenue and Forecast, by Capacity (2020-2032)
11.3.4.3. Market Revenue and Forecast, by End-user (2020-2032)
11.3.5. China
11.3.5.1. Market Revenue and Forecast, by Product (2020-2032)
11.3.5.2. Market Revenue and Forecast, by Capacity (2020-2032)
11.3.5.3. Market Revenue and Forecast, by End-user (2020-2032)
11.3.6. Japan
11.3.6.1. Market Revenue and Forecast, by Product (2020-2032)
11.3.6.2. Market Revenue and Forecast, by Capacity (2020-2032)
11.3.6.3. Market Revenue and Forecast, by End-user (2020-2032)
11.3.7. Rest of APAC
11.3.7.1. Market Revenue and Forecast, by Product (2020-2032)
11.3.7.2. Market Revenue and Forecast, by Capacity (2020-2032)
11.3.7.3. Market Revenue and Forecast, by End-user (2020-2032)
11.4. MEA
11.4.1. Market Revenue and Forecast, by Product (2020-2032)
11.4.2. Market Revenue and Forecast, by Capacity (2020-2032)
11.4.3. Market Revenue and Forecast, by End-user (2020-2032)
11.4.4. GCC
11.4.4.1. Market Revenue and Forecast, by Product (2020-2032)
11.4.4.2. Market Revenue and Forecast, by Capacity (2020-2032)
11.4.4.3. Market Revenue and Forecast, by End-user (2020-2032)
11.4.5. North Africa
11.4.5.1. Market Revenue and Forecast, by Product (2020-2032)
11.4.5.2. Market Revenue and Forecast, by Capacity (2020-2032)
11.4.5.3. Market Revenue and Forecast, by End-user (2020-2032)
11.4.6. South Africa
11.4.6.1. Market Revenue and Forecast, by Product (2020-2032)
11.4.6.2. Market Revenue and Forecast, by Capacity (2020-2032)
11.4.6.3. Market Revenue and Forecast, by End-user (2020-2032)
11.4.7. Rest of MEA
11.4.7.1. Market Revenue and Forecast, by Product (2020-2032)
11.4.7.2. Market Revenue and Forecast, by Capacity (2020-2032)
11.4.7.3. Market Revenue and Forecast, by End-user (2020-2032)
11.5. Latin America
11.5.1. Market Revenue and Forecast, by Product (2020-2032)
11.5.2. Market Revenue and Forecast, by Capacity (2020-2032)
11.5.3. Market Revenue and Forecast, by End-user (2020-2032)
11.5.4. Brazil
11.5.4.1. Market Revenue and Forecast, by Product (2020-2032)
11.5.4.2. Market Revenue and Forecast, by Capacity (2020-2032)
11.5.4.3. Market Revenue and Forecast, by End-user (2020-2032)
11.5.5. Rest of LATAM
11.5.5.1. Market Revenue and Forecast, by Product (2020-2032)
11.5.5.2. Market Revenue and Forecast, by Capacity (2020-2032)
11.5.5.3. Market Revenue and Forecast, by End-user (2020-2032)
Chapter 12. Company Profiles
12.1. Sartorius AG
12.1.1. Company Overview
12.1.2. Product Offerings
12.1.3. Financial Performance
12.1.4. Recent Initiatives
12.2. Thermo Fisher Scientific Inc.
12.2.1. Company Overview
12.2.2. Product Offerings
12.2.3. Financial Performance
12.2.4. Recent Initiatives
12.3. Merck KGaA
12.3.1. Company Overview
12.3.2. Product Offerings
12.3.3. Financial Performance
12.3.4. Recent Initiatives
12.4. Klarna Inc.
12.4.1. Company Overview
12.4.2. Product Offerings
12.4.3. Financial Performance
12.4.4. Recent Initiatives
12.5. Lonza Group
12.5.1. Company Overview
12.5.2. Product Offerings
12.5.3. Financial Performance
12.5.4. Recent Initiatives
12.6. Eppendorf AG
12.6.1. Company Overview
12.6.2. Product Offerings
12.6.3. Financial Performance
12.6.4. Recent Initiatives
12.7. Miltenyi Biotec
12.7.1. Company Overview
12.7.2. Product Offerings
12.7.3. Financial Performance
12.7.4. Recent Initiatives
12.8. Getinge AB
12.8.1. Company Overview
12.8.2. Product Offerings
12.8.3. Financial Performance
12.8.4. Recent Initiatives
12.9. Solaris Biotechnology Srl
12.9.1. Company Overview
12.9.2. Product Offerings
12.9.3. Financial Performance
12.9.4. Recent Initiatives
12.10. Infors AG
12.10.1. Company Overview
12.10.2. Product Offerings
12.10.3. Financial Performance
12.10.4. Recent Initiatives
Chapter 13. Research Methodology
13.1. Primary Research
13.2. Secondary Research
13.3. Assumptions
Chapter 14. Appendix
14.1. About Us
14.2. Glossary of Terms
 Cross-segment Market Size and Analysis for
Mentioned Segments
Additional Company Profiles (Upto 5 With No Cost)
Additional Countries (Apart From Mentioned Countries)
Country/Region-specific Report
Go To Market Strategy
Region Specific Market DynamicsRegion Level Market Share Import Export AnalysisProduction AnalysisOthers
Cross-segment Market Size and Analysis for
Mentioned Segments
Additional Company Profiles (Upto 5 With No Cost)
Additional Countries (Apart From Mentioned Countries)
Country/Region-specific Report
Go To Market Strategy
Region Specific Market DynamicsRegion Level Market Share Import Export AnalysisProduction AnalysisOthers