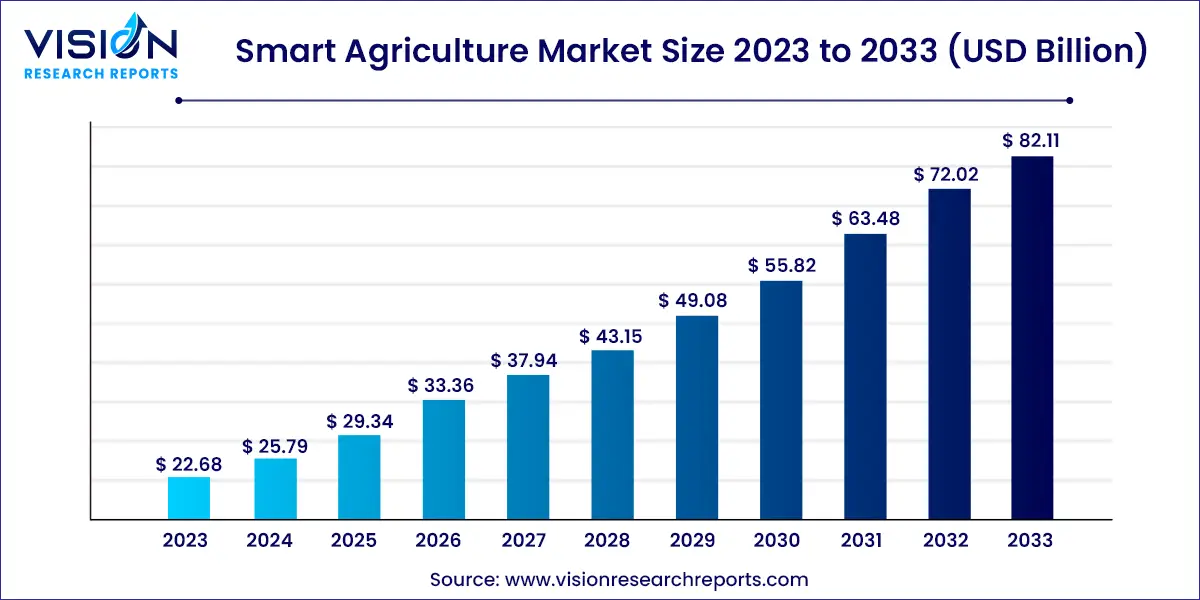
The global smart agriculture market size was estimated at USD 22.68 billion in 2023 and it is expected to surpass around USD 82.11 billion by 2033, poised to grow at a CAGR of 13.73% from 2024 to 2033. The smart agriculture market represents a transformative shift in farming practices through the integration of advanced technologies. This sector leverages innovations such as the Internet of Things (IoT), artificial intelligence (AI), and big data analytics to enhance agricultural productivity, efficiency, and sustainability.

The growth of the smart agriculture market is propelled by the escalating global population and the corresponding demand for increased food production are driving the need for advanced agricultural solutions. Farmers are increasingly turning to smart technologies to enhance crop yields and manage resources more efficiently. Additionally, advancements in technology, such as the Internet of Things (IoT), artificial intelligence (AI), and big data analytics, are significantly contributing to market expansion. These technologies enable real-time monitoring, predictive analytics, and precision farming, leading to optimized agricultural practices. Furthermore, the rising emphasis on sustainability and environmental conservation is pushing the adoption of smart agriculture solutions that minimize resource wastage and reduce the environmental footprint.
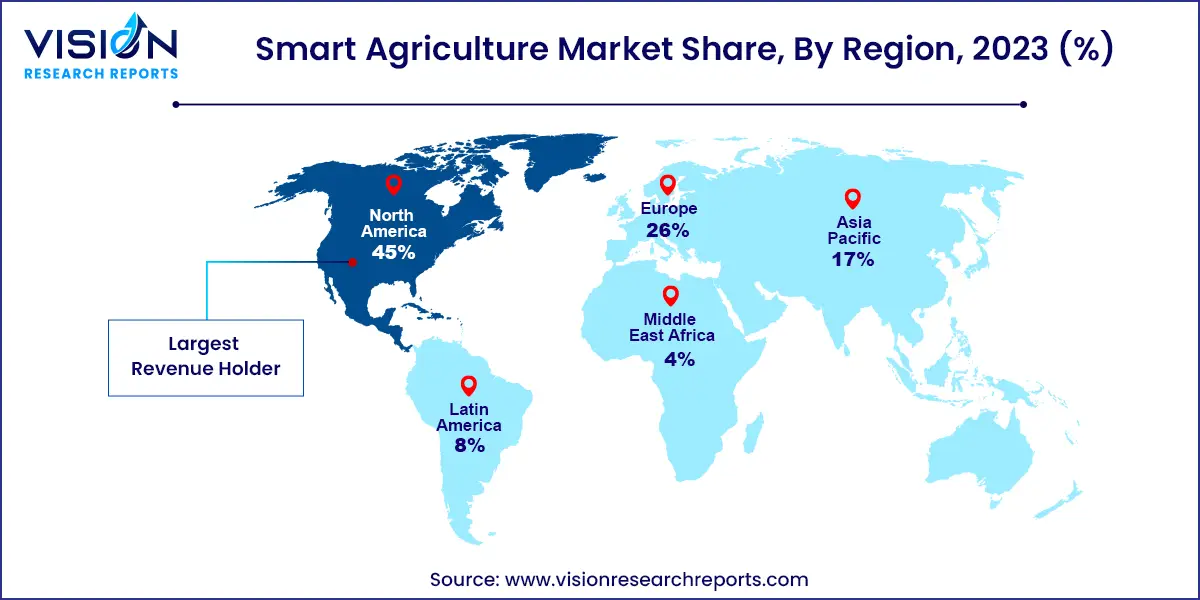
North America led the global smart agriculture market with a 45% share in 2023 and is expected to grow at a CAGR of 12.33% from 2024 to 2033. Government initiatives and regulations aimed at improving agriculture in the region are driving demand. The North America Climate Smart Agriculture Alliance (NACSAA) and subsidies for smart irrigation, such as rebates on smart controllers in California, highlight the region’s commitment to sustainable practices.

The Asia Pacific region is poised for the highest growth during the forecast period. Although smart farming is still in the early adoption phase here, increased government support and growing awareness among farmers are expected to boost regional demand. For instance, Japan's Ministry of Agriculture is funding precision agriculture development, and local farmers’ associations are promoting sustainable practices.
In 2023, the livestock monitoring segment held a significant 22% share of the global smart farming market. The market is segmented into precision farming, smart greenhouses, and other categories such as fish farming and horticulture. Precision livestock monitoring enhances real-time tracking of animal health, production, and welfare, aiming for optimal yields. Factors driving growth include the expansion of dairy farms and advancements in precision livestock monitoring technologies, which encourage market players to invest in new product developments and cost-effective livestock management solutions.
The smart greenhouse segment includes vertical farming and facilitates crop cultivation with minimal human intervention. It continuously monitors climatic conditions like soil moisture, temperature, and humidity, automatically adjusting these factors as needed.
Smart farming integrates IoT and information communication technologies to manage farming activities, conserve resources, and optimize yields. It provides real-time data on soil, air, and crop conditions to enhance farm profitability, sustainability, and environmental protection.
The software segment is projected to experience the highest growth rate from 2024 to 2033. The hardware segment is further divided into automation and control systems, HVAC systems, LED grow lights, RFID tags and readers, and sensing devices. Automation and control systems include application control devices, milking robots, guidance systems, driverless tractors, mobile devices, remote sensing, variable rate technology, drones, and wireless modules.
The automation of dairy and food production is expected to boost the milking robots segment, as these technologies improve milk quality and animal welfare while reducing labor costs. The rising demand for efficient herd management and cow health is anticipated to enhance the profitability of dairy and food processing sectors.
Drones within the automation and control systems are expected to see significant growth. Fixed-wing drones, with their rigid wings and forward airspeed, generate lift for stable flight, while rotary blade drones, including single and multi-rotor types, provide versatile flight capabilities. Hybrid drones, equipped with solar panels, offer prolonged flight durations by harnessing multiple energy sources.
In 2023, yield monitoring captured a 44% market share due to its role in tracking crop growth and reducing wastage through timely water and mineral supply. Applications within smart farming include irrigation management, yield monitoring, crop scouting, field mapping, weather forecasting, inventory management, and farm labor management. Weather monitoring and forecasting are expected to grow the fastest in the coming years.
Rising water scarcity and environmental awareness are driving changes in agricultural practices to conserve natural resources. Precision irrigation, which matches irrigation inputs with field yields, is expected to grow significantly. Smart greenhouses, which manage water, fertilizer, and HVAC systems, will also see expansion, particularly in HVAC management due to increasing greenhouse farms.
Livestock monitoring applications include milk harvesting, breeding management, feeding management, and animal comfort management. Technological advancements in livestock production are essential for addressing food shortages, with automated solutions enhancing animal well-being and productivity.
By Type
By Offering
By Application
By Region
Chapter 1. Introduction
1.1. Research Objective
1.2. Scope of the Study
1.3. Definition
Chapter 2. Research Methodology
2.1. Research Approach
2.2. Data Sources
2.3. Assumptions & Limitations
Chapter 3. Executive Summary
3.1. Market Snapshot
Chapter 4. Market Variables and Scope
4.1. Introduction
4.2. Market Classification and Scope
4.3. Industry Value Chain Analysis
4.3.1. Raw Material Procurement Analysis
4.3.2. Sales and Distribution Agriculture Type Analysis
4.3.3. Downstream Buyer Analysis
Chapter 5. COVID 19 Impact on Smart Agriculture Market
5.1. COVID-19 Landscape: Smart Agriculture Industry Impact
5.2. COVID 19 - Impact Assessment for the Industry
5.3. COVID 19 Impact: Global Major Government Policy
5.4. Market Trends and Opportunities in the COVID-19 Landscape
Chapter 6. Market Dynamics Analysis and Trends
6.1. Market Dynamics
6.1.1. Market Drivers
6.1.2. Market Restraints
6.1.3. Market Opportunities
6.2. Porter’s Five Forces Analysis
6.2.1. Bargaining power of suppliers
6.2.2. Bargaining power of buyers
6.2.3. Threat of substitute
6.2.4. Threat of new entrants
6.2.5. Degree of competition
Chapter 7. Competitive Landscape
7.1.1. Company Market Share/Positioning Analysis
7.1.2. Key Strategies Adopted by Players
7.1.3. Vendor Landscape
7.1.3.1. List of Suppliers
7.1.3.2. List of Buyers
Chapter 8. Global Smart Agriculture Market, By Type
8.1. Smart Agriculture Market, by Type, 2023-2032
8.1.1 Precision farming
8.1.1.1. Market Revenue and Forecast (2020-2032)
8.1.2. Livestock monitoring
8.1.2.1. Market Revenue and Forecast (2020-2032)
8.1.3. Smart greenhouse
8.1.3.1. Market Revenue and Forecast (2020-2032)
8.1.4. Others
8.1.4.1. Market Revenue and Forecast (2020-2032)
Chapter 9. Global Smart Agriculture Market, By Offering
9.1. Smart Agriculture Market, by Offering, 2023-2032
9.1.1. Hardware
9.1.1.1. Market Revenue and Forecast (2020-2032)
9.1.2. Software
9.1.2.1. Market Revenue and Forecast (2020-2032)
9.1.3. Services
9.1.3.1. Market Revenue and Forecast (2020-2032)
Chapter 10. Global Smart Agriculture Market, By Application
10.1. Smart Agriculture Market, by Application, 2023-2032
10.1.1. Precision farming application
10.1.1.1. Market Revenue and Forecast (2020-2032)
10.1.2. Livestock monitoring application
10.1.2.1. Market Revenue and Forecast (2020-2032)
10.1.3. Smart greenhouse application
10.1.3.1. Market Revenue and Forecast (2020-2032)
Chapter 11. Global Smart Agriculture Market, Regional Estimates and Trend Forecast
11.1. North America
11.1.1. Market Revenue and Forecast, by Agriculture Type (2020-2032)
11.1.2. Market Revenue and Forecast, by Offering (2020-2032)
11.1.3. Market Revenue and Forecast, by Application (2020-2032)
11.1.4. U.S.
11.1.4.1. Market Revenue and Forecast, by Agriculture Type (2020-2032)
11.1.4.2. Market Revenue and Forecast, by Offering (2020-2032)
11.1.4.3. Market Revenue and Forecast, by Application (2020-2032)
11.1.5. Rest of North America
11.1.5.1. Market Revenue and Forecast, by Agriculture Type (2020-2032)
11.1.5.2. Market Revenue and Forecast, by Offering (2020-2032)
11.1.5.3. Market Revenue and Forecast, by Application (2020-2032)
11.2. Europe
11.2.1. Market Revenue and Forecast, by Agriculture Type (2020-2032)
11.2.2. Market Revenue and Forecast, by Offering (2020-2032)
11.2.3. Market Revenue and Forecast, by Application (2020-2032)
11.2.4. UK
11.2.4.1. Market Revenue and Forecast, by Agriculture Type (2020-2032)
11.2.4.2. Market Revenue and Forecast, by Offering (2020-2032)
11.2.4.3. Market Revenue and Forecast, by Application (2020-2032)
11.2.5. Germany
11.2.5.1. Market Revenue and Forecast, by Agriculture Type (2020-2032)
11.2.5.2. Market Revenue and Forecast, by Offering (2020-2032)
11.2.5.3. Market Revenue and Forecast, by Application (2020-2032)
11.2.6. France
11.2.6.1. Market Revenue and Forecast, by Agriculture Type (2020-2032)
11.2.6.2. Market Revenue and Forecast, by Offering (2020-2032)
11.2.6.3. Market Revenue and Forecast, by Application (2020-2032)
11.2.7. Rest of Europe
11.2.7.1. Market Revenue and Forecast, by Agriculture Type (2020-2032)
11.2.7.2. Market Revenue and Forecast, by Offering (2020-2032)
11.2.7.3. Market Revenue and Forecast, by Application (2020-2032)
11.3. APAC
11.3.1. Market Revenue and Forecast, by Agriculture Type (2020-2032)
11.3.2. Market Revenue and Forecast, by Offering (2020-2032)
11.3.3. Market Revenue and Forecast, by Application (2020-2032)
11.3.4. India
11.3.4.1. Market Revenue and Forecast, by Agriculture Type (2020-2032)
11.3.4.2. Market Revenue and Forecast, by Offering (2020-2032)
11.3.4.3. Market Revenue and Forecast, by Application (2020-2032)
11.3.5. China
11.3.5.1. Market Revenue and Forecast, by Agriculture Type (2020-2032)
11.3.5.2. Market Revenue and Forecast, by Offering (2020-2032)
11.3.5.3. Market Revenue and Forecast, by Application (2020-2032)
11.3.6. Japan
11.3.6.1. Market Revenue and Forecast, by Agriculture Type (2020-2032)
11.3.6.2. Market Revenue and Forecast, by Offering (2020-2032)
11.3.6.3. Market Revenue and Forecast, by Application (2020-2032)
11.3.7. Rest of APAC
11.3.7.1. Market Revenue and Forecast, by Agriculture Type (2020-2032)
11.3.7.2. Market Revenue and Forecast, by Offering (2020-2032)
11.3.7.3. Market Revenue and Forecast, by Application (2020-2032)
11.4. MEA
11.4.1. Market Revenue and Forecast, by Agriculture Type (2020-2032)
11.4.2. Market Revenue and Forecast, by Offering (2020-2032)
11.4.3. Market Revenue and Forecast, by Application (2020-2032)
11.4.4. GCC
11.4.4.1. Market Revenue and Forecast, by Agriculture Type (2020-2032)
11.4.4.2. Market Revenue and Forecast, by Offering (2020-2032)
11.4.4.3. Market Revenue and Forecast, by Application (2020-2032)
11.4.5. North Africa
11.4.5.1. Market Revenue and Forecast, by Agriculture Type (2020-2032)
11.4.5.2. Market Revenue and Forecast, by Offering (2020-2032)
11.4.5.3. Market Revenue and Forecast, by Application (2020-2032)
11.4.6. South Africa
11.4.6.1. Market Revenue and Forecast, by Agriculture Type (2020-2032)
11.4.6.2. Market Revenue and Forecast, by Offering (2020-2032)
11.4.6.3. Market Revenue and Forecast, by Application (2020-2032)
11.4.7. Rest of MEA
11.4.7.1. Market Revenue and Forecast, by Agriculture Type (2020-2032)
11.4.7.2. Market Revenue and Forecast, by Offering (2020-2032)
11.4.7.3. Market Revenue and Forecast, by Application (2020-2032)
11.5. Latin America
11.5.1. Market Revenue and Forecast, by Agriculture Type (2020-2032)
11.5.2. Market Revenue and Forecast, by Offering (2020-2032)
11.5.3. Market Revenue and Forecast, by Application (2020-2032)
11.5.4. Brazil
11.5.4.1. Market Revenue and Forecast, by Agriculture Type (2020-2032)
11.5.4.2. Market Revenue and Forecast, by Offering (2020-2032)
11.5.4.3. Market Revenue and Forecast, by Application (2020-2032)
11.5.5. Rest of LATAM
11.5.5.1. Market Revenue and Forecast, by Agriculture Type (2020-2032)
11.5.5.2. Market Revenue and Forecast, by Offering (2020-2032)
11.5.5.3. Market Revenue and Forecast, by Application (2020-2032)
Chapter 12. Company Profiles
12.1. Ag Leader Technology
12.1.1. Company Overview
12.1.2. Product Offerings
12.1.3. Financial Performance
12.1.4. Recent Initiatives
12.2. AGCO Corporation.
12.2.1. Company Overview
12.2.2. Product Offerings
12.2.3. Financial Performance
12.2.4. Recent Initiatives
12.3. AgJunction
12.3.1. Company Overview
12.3.2. Product Offerings
12.3.3. Financial Performance
12.3.4. Recent Initiatives
12.4. AgEagle Aerial Systems Inc.
12.4.1. Company Overview
12.4.2. Product Offerings
12.4.3. Financial Performance
12.4.4. Recent Initiatives
12.5. Autonomous Solutions, Inc.
12.5.1. Company Overview
12.5.2. Product Offerings
12.5.3. Financial Performance
12.5.4. Recent Initiatives
12.6. Argus Control Systems Ltd
12.6.1. Company Overview
12.6.2. Product Offerings
12.6.3. Financial Performance
12.6.4. Recent Initiatives
12.7. BouMatic Robotic B.V.
12.7.1. Company Overview
12.7.2. Product Offerings
12.7.3. Financial Performance
12.7.4. Recent Initiatives
12.8. CropMetrics
12.8.1. Company Overview
12.8.2. Product Offerings
12.8.3. Financial Performance
12.8.4. Recent Initiatives
12.9. CLAAS KGaA mbH
12.9.1. Company Overview
12.9.2. Product Offerings
12.9.3. Financial Performance
12.9.4. Recent Initiatives
12.10. CropZilla
12.10.1. Company Overview
12.10.2. Product Offerings
12.10.3. Financial Performance
12.10.4. Recent Initiatives
Chapter 13. Research Methodology
13.1. Primary Research
13.2. Secondary Research
13.3. Assumptions
Chapter 14. Appendix
14.1. About Us
14.2. Glossary of Terms
 Cross-segment Market Size and Analysis for
Mentioned Segments
 Additional Company Profiles (Upto 5 With No Cost)
 Additional Countries (Apart From Mentioned Countries)
 Country/Region-specific Report
 Go To Market Strategy
 Region Specific Market Dynamics
 Region Level Market Share
 Import Export Analysis
 Production Analysis
 Others