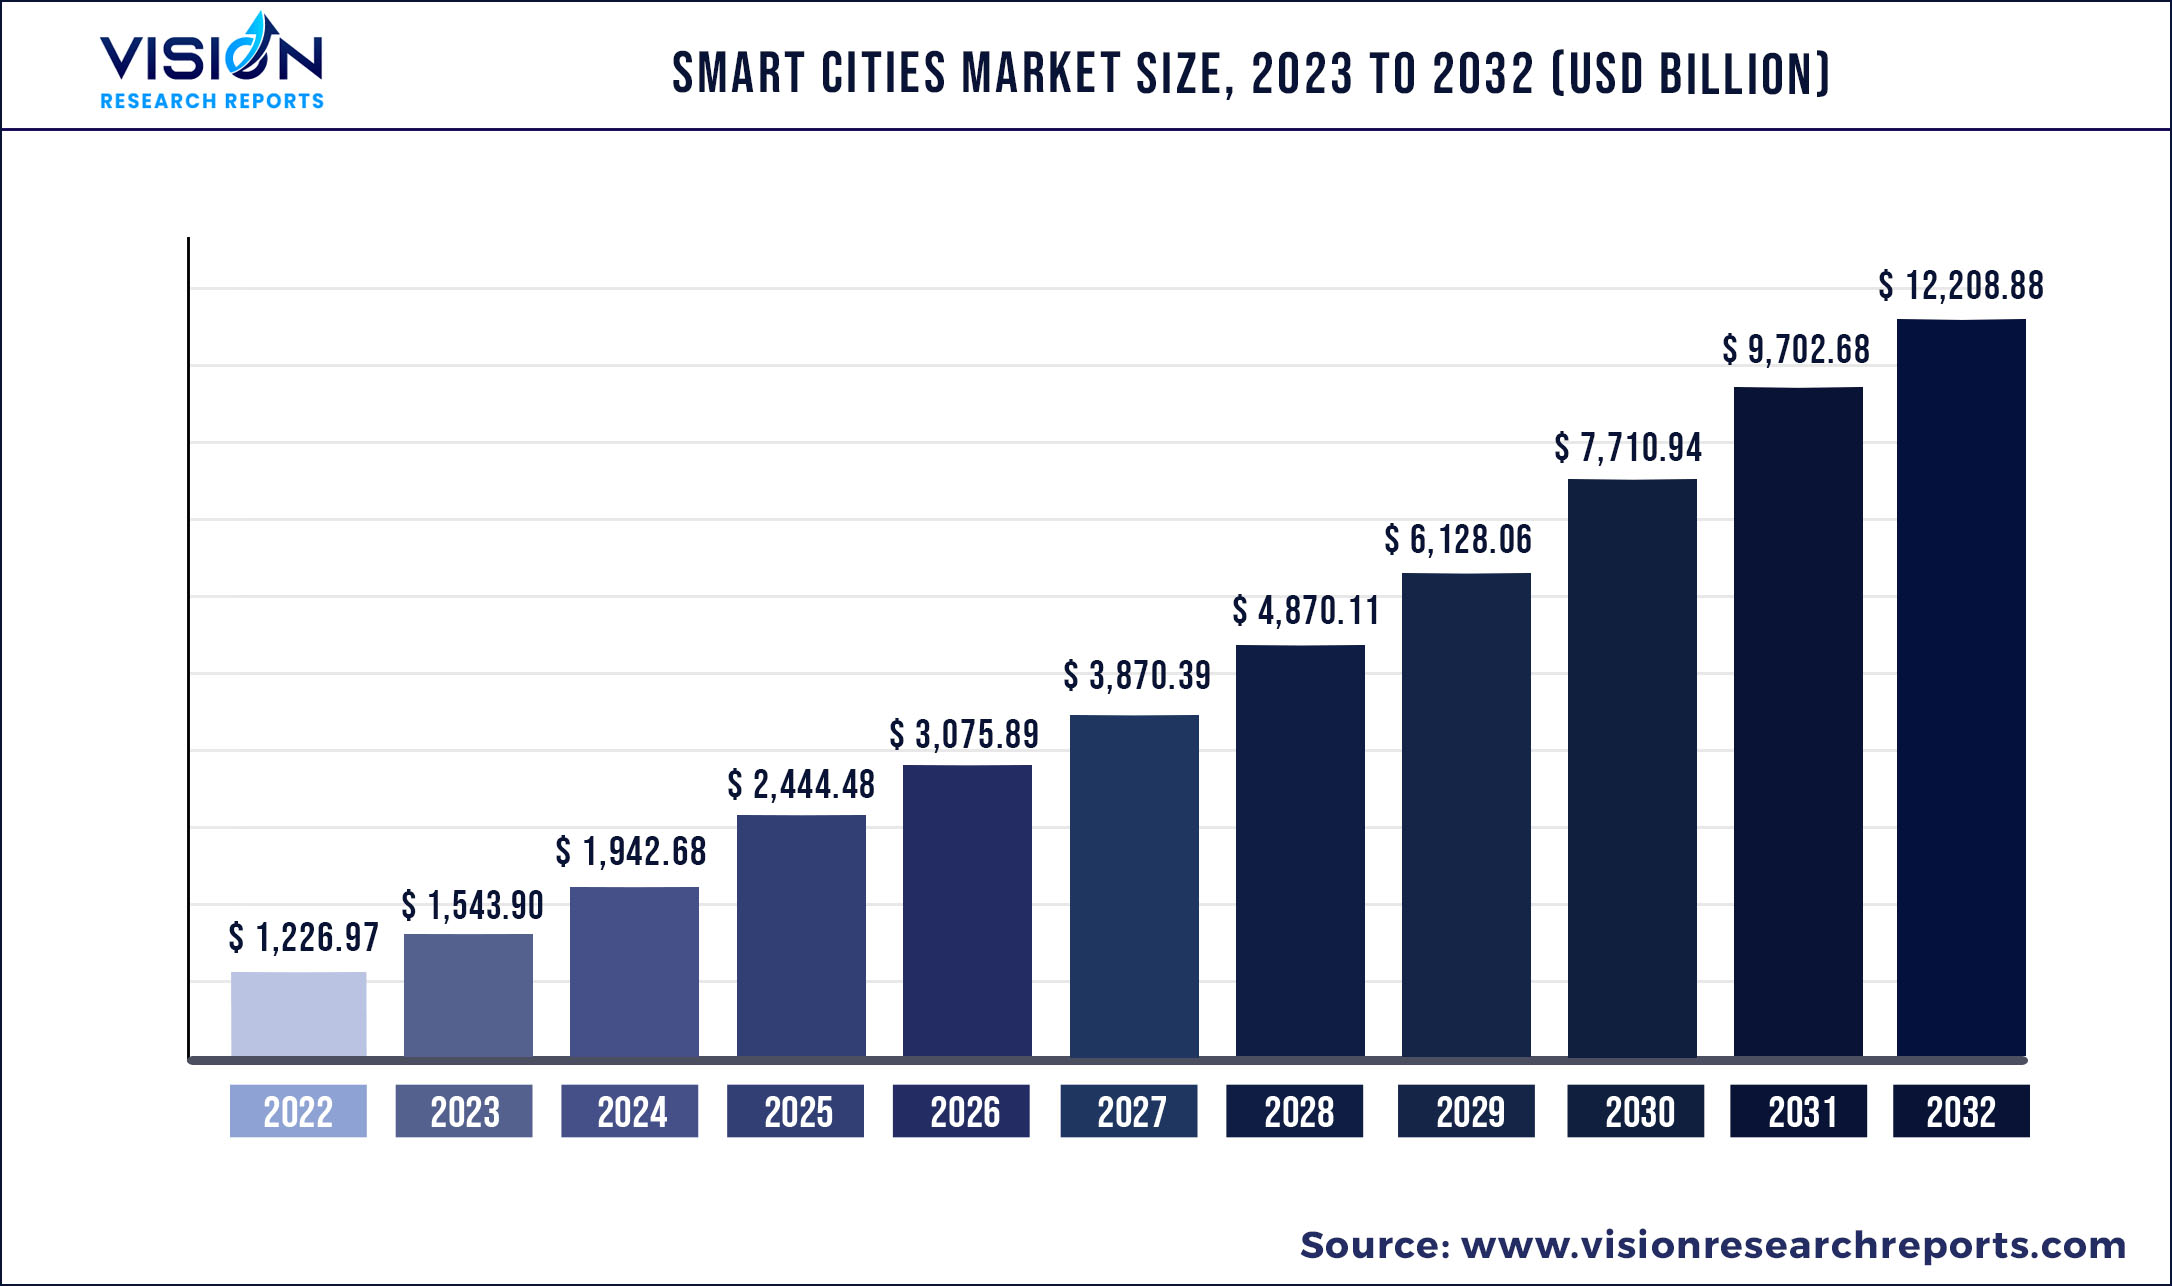
The global smart cities market was surpassed at USD 1,226.97 billion in 2022 and is expected to hit around USD 12,208.88 billion by 2032, growing at a CAGR of 25.83% from 2023 to 2032.
Key Pointers
| Report Coverage | Details |
| Market Size in 2022 | USD 1,226.97 billion |
| Revenue Forecast by 2032 | USD 12,208.88 billion |
| Growth rate from 2023 to 2032 | CAGR of 25.83% |
| Base Year | 2022 |
| Forecast Period | 2023 to 2032 |
| Regions Covered | North America, Europe, Asia Pacific, Latin America, Middle East & Africa |
| Companies Covered | ABB Limited; AGT International; AVEVA Group plc.; Cisco Systems, Inc.; Ericsson; General Electric; Honeywell International Inc.; International Business Machines Corporation; Itron Inc.; KAPSCH Group; Huawei Technologies Co., Ltd.; Microsoft Corporation; Oracle Corporation; Osram Gmbh; SAP SE; Schneider Electric SE; Siemens AG; Telensa; Verizon; Vodafone Group plc |
The increasing urbanization, the need for efficient management of resource utilization, public safety concerns, and increasing demand for an environment with efficient energy utilization are the major driving factors for the smart cities' market growth. Due to the COVID-19 pandemic, countries followed strict lockdowns and mobility constraints to avoid the spread of the virus. During the pandemic, the dependence of global economies on urban areas and the importance of public healthcare in smart city initiatives have been brought to light. However, organizations are trying to implement emerging technologies such as the Internet of Things (IoT) and Artificial Intelligence (A.I.) to overcome the challenges faced during the pandemic.
The need for sustainable structure due to the growing population and urbanization has become significant for market growth. Several regional governments are trying to handle these problems via smart city initiatives across serviceable segments, such as mobility, utility, safety, and management. The local governments have also been at the forefront of stimulating organizational and institutional changes, enabling steady investments, and creating a consortium for bringing diverse businesses together. The emergence of a new genre of public-private partnerships is also a particular development attributable to the smart city’s developments. Further, infrastructure development financing and funding models and governance systems are playing a major role in fueling the smart cities market.
The smart cities' market growth can be attributed to the growing adoption of nanotechnology, Artificial Learning (A.I.), Machine Learning (ML), cloud computing, IoT, cognitive computing, big data analytics, and open data. Moreover, the increasing implementation of Build-Own-Operate (B.O.O.), Build-Operate-Transfer (B.O.T.), Original Brand Manufacturer (O.B.M.), and Bill of Material (B.O.M.) business models is also driving the successful project execution of smart cities. Asian countries have been pursuing numerous initiatives to encourage the adoption of digital technologies for smart cities while seeking to maintain consumer data privacy. Moreover, several government initiatives worldwide are anticipated to drive market growth further. For instance, in December 2021, the U.A.E. government achieved a 100% paperless transformation under the Smart Dubai Plan 2021.
Though smart city projects need a diverse set of technologies, such as IoT, A.I., and smart sensors, to monitor city infrastructure, their application varies across projects and from city to city. The key driving factors for implementing smart city solutions are the need to improve resilient cities, reduce energy, and concern over the increase of environmental waste. Additionally, the vendors invest in Research & Development (R&D) to establish new systems and technologies for connected infrastructure across smart city projects. The key players in the market, such as Cisco Systems, Siemens AG, and IBM Corporation, are actively investing in R&D activities related to connected infrastructure in smart city development worldwide.
Smart Cities Market Segmentations:
| By Application | By Smart Governance | By Smart Utilities | By Smart Transportation |
|
Smart Governance Smart Building Environmental Solution Smart Utilities Smart Transportation Smart Healthcare |
City Surveillance E-governance Smart Lighting Smart Infrastructure |
Energy Management Water Management Waste Management |
Intelligent Transportation System Parking Management Smart Ticketing & Travel Assistance |
Chapter 1. Introduction
1.1. Research Objective
1.2. Scope of the Study
1.3. Definition
Chapter 2. Research Methodology
2.1. Research Approach
2.2. Data Sources
2.3. Assumptions & Limitations
Chapter 3. Executive Summary
3.1. Market Snapshot
Chapter 4. Market Variables and Scope
4.1. Introduction
4.2. Market Classification and Scope
4.3. Industry Value Chain Analysis
4.3.1. Raw Material Procurement Analysis
4.3.2. Sales and Distribution Channel Analysis
4.3.3. Downstream Buyer Analysis
Chapter 5. COVID 19 Impact on Smart Cities Market
5.1. COVID-19 Landscape: Smart Cities Industry Impact
5.2. COVID 19 - Impact Assessment for the Industry
5.3. COVID 19 Impact: Global Major Government Policy
5.4. Market Trends and Opportunities in the COVID-19 Landscape
Chapter 6. Market Dynamics Analysis and Trends
6.1. Market Dynamics
6.1.1. Market Drivers
6.1.2. Market Restraints
6.1.3. Market Opportunities
6.2. Porter’s Five Forces Analysis
6.2.1. Bargaining power of suppliers
6.2.2. Bargaining power of buyers
6.2.3. Threat of substitute
6.2.4. Threat of new entrants
6.2.5. Degree of competition
Chapter 7. Competitive Landscape
7.1.1. Company Market Share/Positioning Analysis
7.1.2. Key Strategies Adopted by Players
7.1.3. Vendor Landscape
7.1.3.1. List of Suppliers
7.1.3.2. List of Buyers
Chapter 8. Global Smart Cities Market, By Application
8.1. Smart Cities Market, by Application, 2023-2032
8.1.1. Smart Governance
8.1.1.1. Market Revenue and Forecast (2020-2032)
8.1.2. Smart Building
8.1.2.1. Market Revenue and Forecast (2020-2032)
8.1.3. Environmental Solution
8.1.3.1. Market Revenue and Forecast (2020-2032)
8.1.4. Smart Utilities
8.1.4.1. Market Revenue and Forecast (2020-2032)
8.1.5. Smart Transportation
8.1.5.1. Market Revenue and Forecast (2020-2032)
8.1.6. Smart Healthcare
8.1.6.1. Market Revenue and Forecast (2020-2032)
Chapter 9. Global Smart Cities Market, By Smart Governance
9.1. Smart Cities Market, by Smart Governance, 2023-2032
9.1.1. City Surveillance
9.1.1.1. Market Revenue and Forecast (2020-2032)
9.1.2. E-governance
9.1.2.1. Market Revenue and Forecast (2020-2032)
9.1.3. Smart Lighting
9.1.3.1. Market Revenue and Forecast (2020-2032)
9.1.4. Smart Infrastructure
9.1.4.1. Market Revenue and Forecast (2020-2032)
Chapter 10. Global Smart Cities Market, By Smart Utilities
10.1. Smart Cities Market, by Smart Utilities, 2023-2032
10.1.1. Energy Management
10.1.1.1. Market Revenue and Forecast (2020-2032)
10.1.2. Water Management
10.1.2.1. Market Revenue and Forecast (2020-2032)
10.1.3. Waste Management
10.1.3.1. Market Revenue and Forecast (2020-2032)
Chapter 11. Global Smart Cities Market, By Smart Transportation
11.1. Smart Cities Market, by Smart Transportation, 2023-2032
11.1.1. Intelligent Transportation System
11.1.1.1. Market Revenue and Forecast (2020-2032)
11.1.2. Parking Management
11.1.2.1. Market Revenue and Forecast (2020-2032)
11.1.3. Smart Ticketing & Travel Assistance
11.1.3.1. Market Revenue and Forecast (2020-2032)
Chapter 12. Global Smart Cities Market, Regional Estimates and Trend Forecast
12.1. North America
12.1.1. Market Revenue and Forecast, by Application (2020-2032)
12.1.2. Market Revenue and Forecast, by Smart Governance (2020-2032)
12.1.3. Market Revenue and Forecast, by Smart Utilities (2020-2032)
12.1.4. Market Revenue and Forecast, by Smart Transportation (2020-2032)
12.1.5. U.S.
12.1.5.1. Market Revenue and Forecast, by Application (2020-2032)
12.1.5.2. Market Revenue and Forecast, by Smart Governance (2020-2032)
12.1.5.3. Market Revenue and Forecast, by Smart Utilities (2020-2032)
12.1.5.4. Market Revenue and Forecast, by Smart Transportation (2020-2032)
12.1.6. Rest of North America
12.1.6.1. Market Revenue and Forecast, by Application (2020-2032)
12.1.6.2. Market Revenue and Forecast, by Smart Governance (2020-2032)
12.1.6.3. Market Revenue and Forecast, by Smart Utilities (2020-2032)
12.1.6.4. Market Revenue and Forecast, by Smart Transportation (2020-2032)
12.2. Europe
12.2.1. Market Revenue and Forecast, by Application (2020-2032)
12.2.2. Market Revenue and Forecast, by Smart Governance (2020-2032)
12.2.3. Market Revenue and Forecast, by Smart Utilities (2020-2032)
12.2.4. Market Revenue and Forecast, by Smart Transportation (2020-2032)
12.2.5. UK
12.2.5.1. Market Revenue and Forecast, by Application (2020-2032)
12.2.5.2. Market Revenue and Forecast, by Smart Governance (2020-2032)
12.2.5.3. Market Revenue and Forecast, by Smart Utilities (2020-2032)
12.2.5.4. Market Revenue and Forecast, by Smart Transportation (2020-2032)
12.2.6. Germany
12.2.6.1. Market Revenue and Forecast, by Application (2020-2032)
12.2.6.2. Market Revenue and Forecast, by Smart Governance (2020-2032)
12.2.6.3. Market Revenue and Forecast, by Smart Utilities (2020-2032)
12.2.6.4. Market Revenue and Forecast, by Smart Transportation (2020-2032)
12.2.7. France
12.2.7.1. Market Revenue and Forecast, by Application (2020-2032)
12.2.7.2. Market Revenue and Forecast, by Smart Governance (2020-2032)
12.2.7.3. Market Revenue and Forecast, by Smart Utilities (2020-2032)
12.2.7.4. Market Revenue and Forecast, by Smart Transportation (2020-2032)
12.2.8. Rest of Europe
12.2.8.1. Market Revenue and Forecast, by Application (2020-2032)
12.2.8.2. Market Revenue and Forecast, by Smart Governance (2020-2032)
12.2.8.3. Market Revenue and Forecast, by Smart Utilities (2020-2032)
12.2.8.4. Market Revenue and Forecast, by Smart Transportation (2020-2032)
12.3. APAC
12.3.1. Market Revenue and Forecast, by Application (2020-2032)
12.3.2. Market Revenue and Forecast, by Smart Governance (2020-2032)
12.3.3. Market Revenue and Forecast, by Smart Utilities (2020-2032)
12.3.4. Market Revenue and Forecast, by Smart Transportation (2020-2032)
12.3.5. India
12.3.5.1. Market Revenue and Forecast, by Application (2020-2032)
12.3.5.2. Market Revenue and Forecast, by Smart Governance (2020-2032)
12.3.5.3. Market Revenue and Forecast, by Smart Utilities (2020-2032)
12.3.5.4. Market Revenue and Forecast, by Smart Transportation (2020-2032)
12.3.6. China
12.3.6.1. Market Revenue and Forecast, by Application (2020-2032)
12.3.6.2. Market Revenue and Forecast, by Smart Governance (2020-2032)
12.3.6.3. Market Revenue and Forecast, by Smart Utilities (2020-2032)
12.3.6.4. Market Revenue and Forecast, by Smart Transportation (2020-2032)
12.3.7. Japan
12.3.7.1. Market Revenue and Forecast, by Application (2020-2032)
12.3.7.2. Market Revenue and Forecast, by Smart Governance (2020-2032)
12.3.7.3. Market Revenue and Forecast, by Smart Utilities (2020-2032)
12.3.7.4. Market Revenue and Forecast, by Smart Transportation (2020-2032)
12.3.8. Rest of APAC
12.3.8.1. Market Revenue and Forecast, by Application (2020-2032)
12.3.8.2. Market Revenue and Forecast, by Smart Governance (2020-2032)
12.3.8.3. Market Revenue and Forecast, by Smart Utilities (2020-2032)
12.3.8.4. Market Revenue and Forecast, by Smart Transportation (2020-2032)
12.4. MEA
12.4.1. Market Revenue and Forecast, by Application (2020-2032)
12.4.2. Market Revenue and Forecast, by Smart Governance (2020-2032)
12.4.3. Market Revenue and Forecast, by Smart Utilities (2020-2032)
12.4.4. Market Revenue and Forecast, by Smart Transportation (2020-2032)
12.4.5. GCC
12.4.5.1. Market Revenue and Forecast, by Application (2020-2032)
12.4.5.2. Market Revenue and Forecast, by Smart Governance (2020-2032)
12.4.5.3. Market Revenue and Forecast, by Smart Utilities (2020-2032)
12.4.5.4. Market Revenue and Forecast, by Smart Transportation (2020-2032)
12.4.6. North Africa
12.4.6.1. Market Revenue and Forecast, by Application (2020-2032)
12.4.6.2. Market Revenue and Forecast, by Smart Governance (2020-2032)
12.4.6.3. Market Revenue and Forecast, by Smart Utilities (2020-2032)
12.4.6.4. Market Revenue and Forecast, by Smart Transportation (2020-2032)
12.4.7. South Africa
12.4.7.1. Market Revenue and Forecast, by Application (2020-2032)
12.4.7.2. Market Revenue and Forecast, by Smart Governance (2020-2032)
12.4.7.3. Market Revenue and Forecast, by Smart Utilities (2020-2032)
12.4.7.4. Market Revenue and Forecast, by Smart Transportation (2020-2032)
12.4.8. Rest of MEA
12.4.8.1. Market Revenue and Forecast, by Application (2020-2032)
12.4.8.2. Market Revenue and Forecast, by Smart Governance (2020-2032)
12.4.8.3. Market Revenue and Forecast, by Smart Utilities (2020-2032)
12.4.8.4. Market Revenue and Forecast, by Smart Transportation (2020-2032)
12.5. Latin America
12.5.1. Market Revenue and Forecast, by Application (2020-2032)
12.5.2. Market Revenue and Forecast, by Smart Governance (2020-2032)
12.5.3. Market Revenue and Forecast, by Smart Utilities (2020-2032)
12.5.4. Market Revenue and Forecast, by Smart Transportation (2020-2032)
12.5.5. Brazil
12.5.5.1. Market Revenue and Forecast, by Application (2020-2032)
12.5.5.2. Market Revenue and Forecast, by Smart Governance (2020-2032)
12.5.5.3. Market Revenue and Forecast, by Smart Utilities (2020-2032)
12.5.5.4. Market Revenue and Forecast, by Smart Transportation (2020-2032)
12.5.6. Rest of LATAM
12.5.6.1. Market Revenue and Forecast, by Application (2020-2032)
12.5.6.2. Market Revenue and Forecast, by Smart Governance (2020-2032)
12.5.6.3. Market Revenue and Forecast, by Smart Utilities (2020-2032)
12.5.6.4. Market Revenue and Forecast, by Smart Transportation (2020-2032)
Chapter 13. Company Profiles
13.1. ABB Limited
13.1.1. Company Overview
13.1.2. Product Offerings
13.1.3. Financial Performance
13.1.4. Recent Initiatives
13.2. AGT International
13.2.1. Company Overview
13.2.2. Product Offerings
13.2.3. Financial Performance
13.2.4. Recent Initiatives
13.3. AVEVA Group plc.
13.3.1. Company Overview
13.3.2. Product Offerings
13.3.3. Financial Performance
13.3.4. Recent Initiatives
13.4. Cisco Systems, Inc.
13.4.1. Company Overview
13.4.2. Product Offerings
13.4.3. Financial Performance
13.4.4. Recent Initiatives
13.5. Ericsson
13.5.1. Company Overview
13.5.2. Product Offerings
13.5.3. Financial Performance
13.5.4. Recent Initiatives
13.6. General Electric
13.6.1. Company Overview
13.6.2. Product Offerings
13.6.3. Financial Performance
13.6.4. Recent Initiatives
13.7. Honeywell International Inc.
13.7.1. Company Overview
13.7.2. Product Offerings
13.7.3. Financial Performance
13.7.4. Recent Initiatives
13.8. International Business Machines Corporation
13.8.1. Company Overview
13.8.2. Product Offerings
13.8.3. Financial Performance
13.8.4. Recent Initiatives
13.9. Itron Inc.
13.9.1. Company Overview
13.9.2. Product Offerings
13.9.3. Financial Performance
13.9.4. Recent Initiatives
13.10. KAPSCH Group
13.10.1. Company Overview
13.10.2. Product Offerings
13.10.3. Financial Performance
13.10.4. Recent Initiatives
Chapter 14. Research Methodology
14.1. Primary Research
14.2. Secondary Research
14.3. Assumptions
Chapter 15. Appendix
15.1. About Us
15.2. Glossary of Terms
 Cross-segment Market Size and Analysis for
Mentioned Segments
Additional Company Profiles (Upto 5 With No Cost)
Additional Countries (Apart From Mentioned Countries)
Country/Region-specific Report
Go To Market Strategy
Region Specific Market DynamicsRegion Level Market Share Import Export AnalysisProduction AnalysisOthers
Cross-segment Market Size and Analysis for
Mentioned Segments
Additional Company Profiles (Upto 5 With No Cost)
Additional Countries (Apart From Mentioned Countries)
Country/Region-specific Report
Go To Market Strategy
Region Specific Market DynamicsRegion Level Market Share Import Export AnalysisProduction AnalysisOthers