Smart Healthcare Market Size, Share, Growth, Trends, Forecast 2023 to 2032
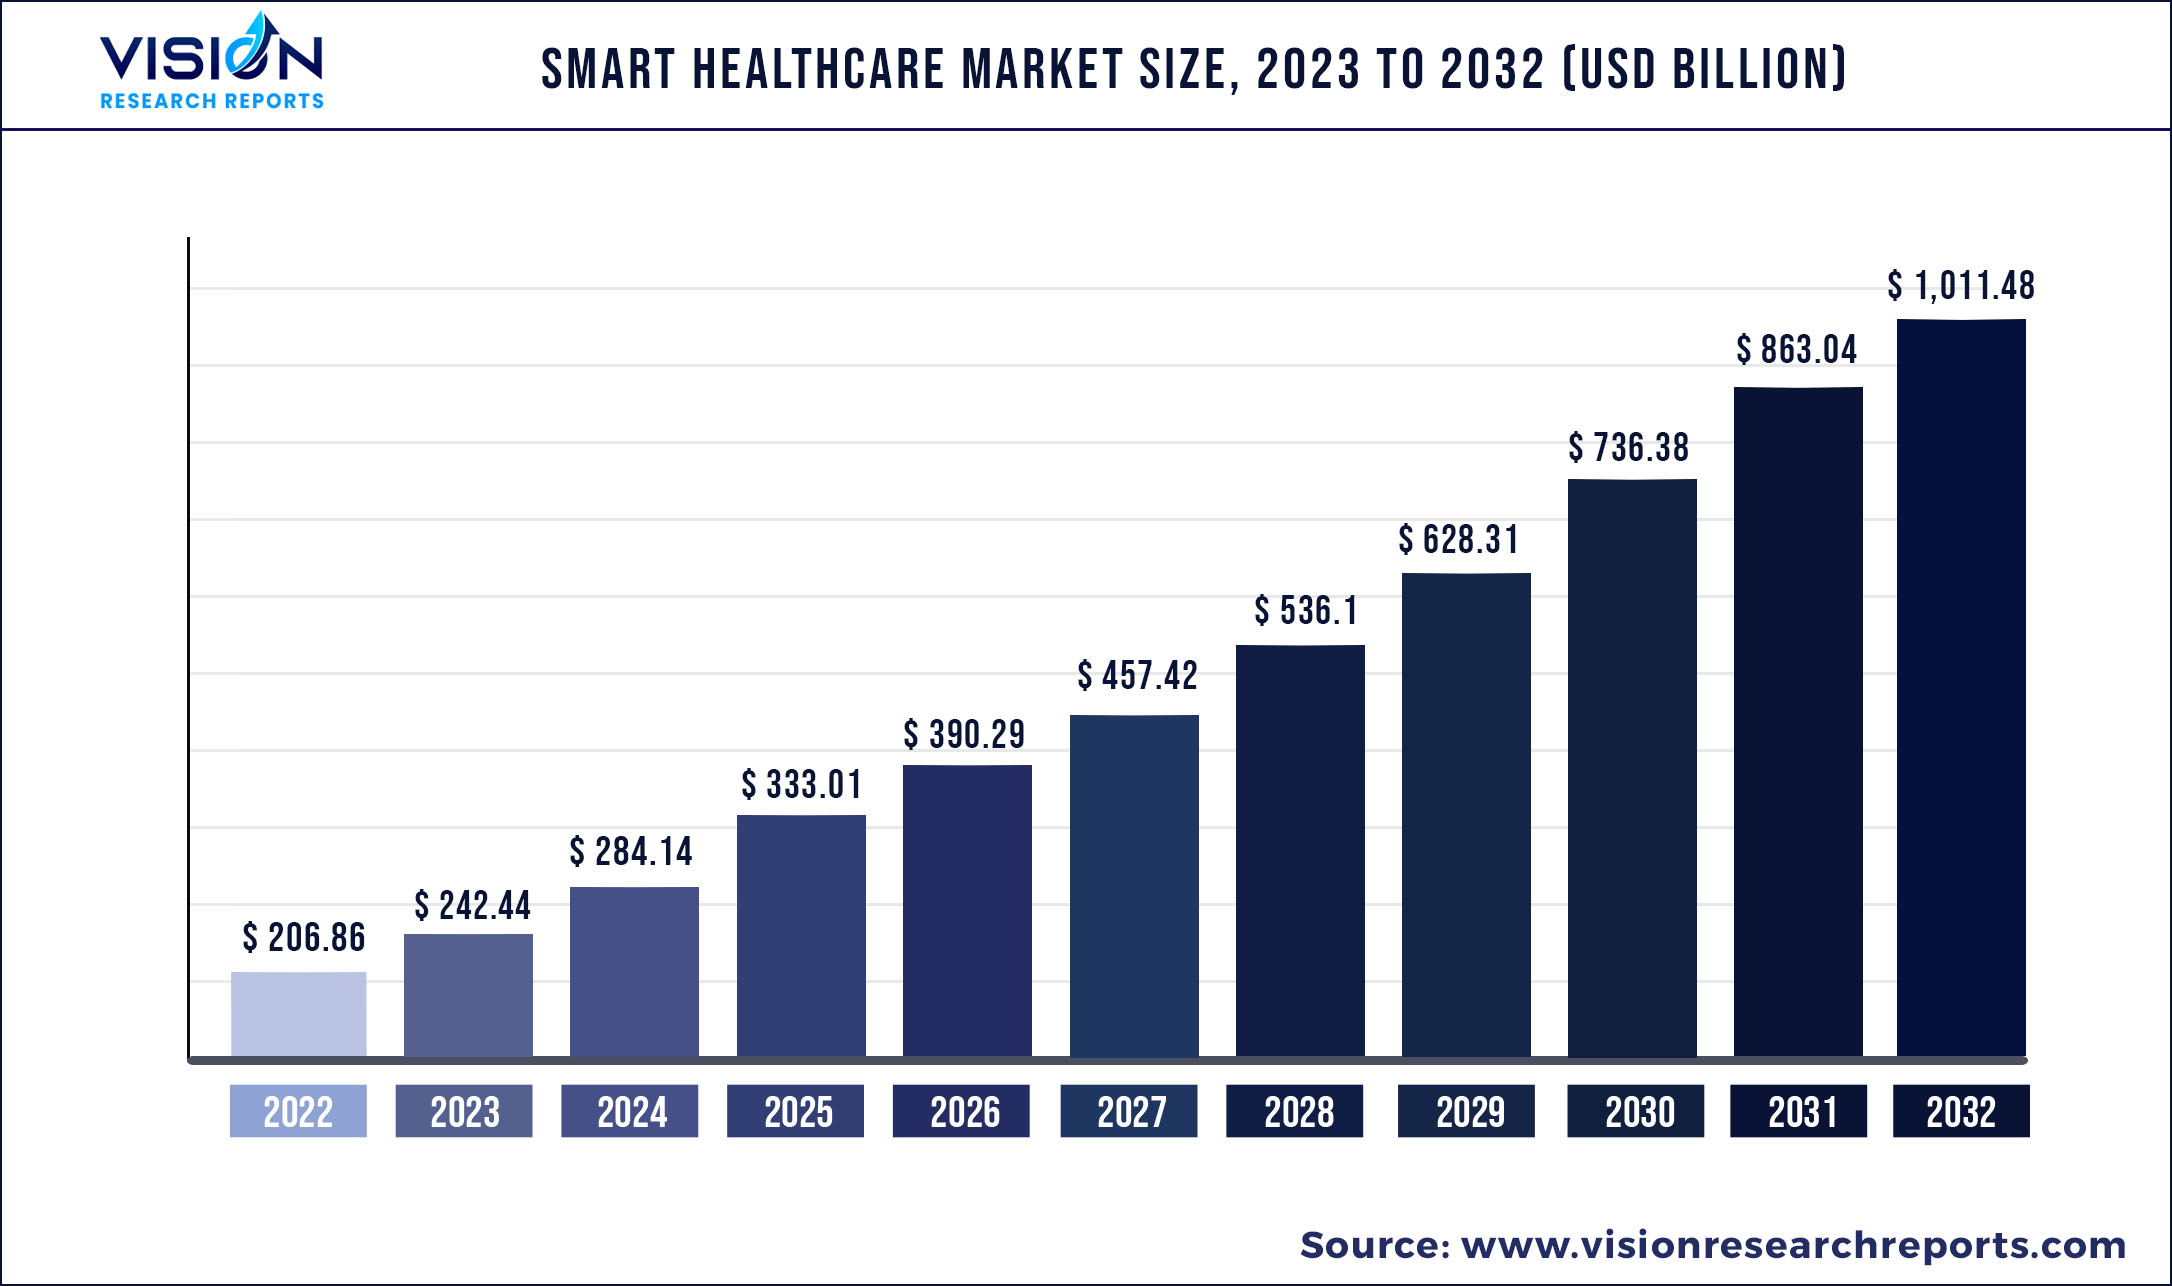
The global smart healthcare market was valued at USD 206.86 billion in 2022 and it is predicted to surpass around USD 1,011.48 billion by 2032 with a CAGR of 17.2% from 2023 to 2032.
Key Pointers
Report Scope of the Smart Healthcare Market
| Report Coverage | Details |
| Market Size in 2022 | USD 206.86 billion |
| Revenue Forecast by 2032 | USD 1,011.48 billion |
| Growth rate from 2023 to 2032 | CAGR of 17.2% |
| Base Year | 2022 |
| Forecast Period | 2023 to 2032 |
| Companies Covered | IBM; Cisco; GE Healthcare; Olympus Corporation; Brooks Automation; Given Imaging, Inc.; Stanley Innerspace; Solstice Medical LLC; Siemens Medical Solutions; Allscripts Healthcare Solutions; Samsung Electronics Corporation; AirStrip Technologies Inc.; Apple Inc.; AT&T Inc.; Logi-Tag; Cerner Corporation; Pepperl+Fuchs; Hurst Green Plastics Ltd.; Bollhoff Group; Wurth Group; McKesson Corporation; Brooks Automation; LogTag |
The rising adoption of mHealth, government initiatives to digitize healthcare, and the prevalence of chronic disorders are likely to accentuate the demand for smart healthcare systems. Digitalization has transformed the healthcare industry. The adoption of mHealth has increased substantially in the past few years, majorly owing to the rising usage of smartphones and digitization. As per a United Healthcare Consumer Sentiment Survey, in 2019, approximately 37.0% of Americans rely on the internet or mobile apps for consultations related to their health conditions.
With the COVID-19 advent, smart healthcare products noticed a sudden increased demand. Smart healthcare adoption has increased during the pandemic situation, and this adoption rate is further projected to grow in the post-COVID-19 scenario. Consequently, many businesses are expanding their products and services; for instance, in November 2020, Vera Smart Health invested around USD 20 billion to increase its services into home-based tests and diagnostics, remote health services, medication delivery, virtual care, and nutrition consultation services. Therefore, substantial demand for smart healthcare products is anticipated due to the COVID-19 emergency.
Rising participation from the industry players is expected to further drive the market for smart healthcare. For instance, in April 2020, Phillips introduced a new application for the care manager acuity-based scoring tools to scrutinize patient conditions to detect deterioration or any adverse trends related to COVID-19. Similarly, in October 2019, Teladoc Health launched Teladoc medical professionals for patients suffering from complicated mental and physical health conditions. This is intended to integrate expert medical services and physicians with their patients effortlessly. Such advancements are expected to drive the market for smart healthcare during the forecast period.
Supportive government programs are projected to bode well for the growth of the market for smart healthcare. For instance, in March 2020, the Quebec government in collaboration with the Canadian Medical Association (CMA) had decided to expand the access to telehealth services across different provinces of Canada such as Alberta, New Brunswick, British Columbia, Manitoba, Ontario, Newfoundland and, and others. Such attempts are expected to put the forefront of digital patient-oriented healthcare services globally.
Moreover, in March 2020, the NHS U.K. encouraged first-tier medical institutions to use telemedicine to reduce the COVID-19 spread. As of now, at primary care clinics, the U.K. records nearly 340 million files of annual medical consultations and only 1% of them are made through video calls. However, the NHS is planning to implement telemedicine services by reducing face-to-face consultation.
Smart Healthcare Market Segmentations:
| By Product | Regions covered |
|
RFID Kanban Systems RFID Smart Cabinets Electronic Health Records (EHR) Telemedicine mHealth Smart Pills Smart Syringes |
North America Europe Asia Pacific Latin America MiddleEast and Africa |
Chapter 1. Introduction
1.1.Research Objective
1.2.Scope of the Study
1.3.Definition
Chapter 2. Research Methodology
2.1.Research Approach
2.2.Data Sources
2.3.Assumptions & Limitations
Chapter 3. Executive Summary
3.1.Market Snapshot
Chapter 4. Market Variables and Scope
4.1.Introduction
4.2.Market Classification and Scope
4.3.Industry Value Chain Analysis
4.3.1. Raw Material Procurement Analysis
4.3.2. Sales and Distribution Channel Analysis
4.3.3. Downstream Buyer Analysis
Chapter 5.COVID 19 Impact on Smart Healthcare Market
5.1. COVID-19 Landscape: Smart Healthcare Industry Impact
5.2. COVID 19 - Impact Assessment for the Industry
5.3. COVID 19 Impact: Global Major Government Policy
5.4.Market Trends and Opportunities in the COVID-19 Landscape
Chapter 6. Market Dynamics Analysis and Trends
6.1.Market Dynamics
6.1.1. Market Drivers
6.1.2. Market Restraints
6.1.3. Market Opportunities
6.2.Porter’s Five Forces Analysis
6.2.1. Bargaining power of suppliers
6.2.2. Bargaining power of buyers
6.2.3. Threat of substitute
6.2.4. Threat of new entrants
6.2.5. Degree of competition
Chapter 7. Competitive Landscape
7.1.1. Company Market Share/Positioning Analysis
7.1.2. Key Strategies Adopted by Players
7.1.3. Vendor Landscape
7.1.3.1.List of Suppliers
7.1.3.2.List of Buyers
Chapter 8. Global Smart Healthcare Market, By Product
8.1.Smart Healthcare Market, by Product Type, 2023-2032
8.1.1. RFID Kanban Systems
8.1.1.1.Market Revenue and Forecast (2020-2032)
8.1.2. RFID Smart Cabinets
8.1.2.1.Market Revenue and Forecast (2020-2032)
8.1.3. Electronic Health Records (EHR)
8.1.3.1.Market Revenue and Forecast (2020-2032)
8.1.4. Telemedicine
8.1.4.1.Market Revenue and Forecast (2020-2032)
8.1.5. mHealth
8.1.5.1.Market Revenue and Forecast (2020-2032)
8.1.6. Smart Pills
8.1.6.1.Market Revenue and Forecast (2020-2032)
8.1.7. Smart Syringes
8.1.7.1.Market Revenue and Forecast (2020-2032)
Chapter 9. Global Smart Healthcare Market, Regional Estimates and Trend Forecast
9.1. North America
9.1.1. Market Revenue and Forecast, by Product (2020-2032)
9.1.2. U.S.
9.1.2.1. Market Revenue and Forecast, by Product (2020-2032)
9.1.3. Rest of North America
9.1.3.1. Market Revenue and Forecast, by Product (2020-2032)
9.2. Europe
9.2.1. Market Revenue and Forecast, by Product (2020-2032)
9.2.2. UK
9.2.2.1. Market Revenue and Forecast, by Product (2020-2032)
9.2.3. Germany
9.2.3.1. Market Revenue and Forecast, by Product (2020-2032)
9.2.4. France
9.2.4.1. Market Revenue and Forecast, by Product (2020-2032)
9.2.5. Rest of Europe
9.2.5.1. Market Revenue and Forecast, by Product (2020-2032)
9.3. APAC
9.3.1. Market Revenue and Forecast, by Product (2020-2032)
9.3.2. India
9.3.2.1. Market Revenue and Forecast, by Product (2020-2032)
9.3.3. China
9.3.3.1. Market Revenue and Forecast, by Product (2020-2032)
9.3.4. Japan
9.3.4.1. Market Revenue and Forecast, by Product (2020-2032)
9.3.5. Rest of APAC
9.3.5.1. Market Revenue and Forecast, by Product (2020-2032)
9.4. MEA
9.4.1. Market Revenue and Forecast, by Product (2020-2032)
9.4.2. GCC
9.4.2.1. Market Revenue and Forecast, by Product (2020-2032)
9.4.3. North Africa
9.4.3.1. Market Revenue and Forecast, by Product (2020-2032)
9.4.4. South Africa
9.4.4.1. Market Revenue and Forecast, by Product (2020-2032)
9.4.5. Rest of MEA
9.4.5.1. Market Revenue and Forecast, by Product (2020-2032)
9.5. Latin America
9.5.1. Market Revenue and Forecast, by Product (2020-2032)
9.5.2. Brazil
9.5.2.1. Market Revenue and Forecast, by Product (2020-2032)
9.5.3. Rest of LATAM
9.5.3.1. Market Revenue and Forecast, by Product (2020-2032)
Chapter 10.Company Profiles
10.1. AirStrip Technologies Inc.
10.1.1.Company Overview
10.1.2.Product Offerings
10.1.3.Financial Performance
10.1.4.Recent Initiatives
10.2. Allscripts Healthcare Solutions
10.2.1.Company Overview
10.2.2.Product Offerings
10.2.3.Financial Performance
10.2.4.Recent Initiatives
10.3. Apple Inc.
10.3.1.Company Overview
10.3.2.Product Offerings
10.3.3.Financial Performance
10.3.4.Recent Initiatives
10.4. AT&T Inc.
10.4.1.Company Overview
10.4.2.Product Offerings
10.4.3.Financial Performance
10.4.4.Recent Initiatives
10.5. Brooks Automation
10.5.1.Company Overview
10.5.2.Product Offerings
10.5.3.Financial Performance
10.5.4.Recent Initiatives
10.6. Cerner Corporation
10.6.1.Company Overview
10.6.2.Product Offerings
10.6.3.Financial Performance
10.6.4.Recent Initiatives
10.7. Cisco
10.7.1.Company Overview
10.7.2.Product Offerings
10.7.3.Financial Performance
10.7.4.Recent Initiatives
10.8. GE Healthcare
10.8.1.Company Overview
10.8.2.Product Offerings
10.8.3.Financial Performance
10.8.4.Recent Initiatives
10.9. Given Imaging, Inc.
10.9.1.Company Overview
10.9.2.Product Offerings
10.9.3.Financial Performance
10.9.4.Recent Initiatives
10.10. Hurst Green Plastics Ltd.
10.10.1. Company Overview
10.10.2. Product Offerings
10.10.3. Financial Performance
10.10.4. Recent Initiatives
Chapter 11.Research Methodology
11.1.Primary Research
11.2.Secondary Research
11.3.Assumptions
Chapter 12.Appendix
12.1. About Us
12.2. Glossary of Terms
 Cross-segment Market Size and Analysis for
Mentioned Segments
Additional Company Profiles (Upto 5 With No Cost)
Additional Countries (Apart From Mentioned Countries)
Country/Region-specific Report
Go To Market Strategy
Region Specific Market DynamicsRegion Level Market Share Import Export AnalysisProduction AnalysisOthers
Cross-segment Market Size and Analysis for
Mentioned Segments
Additional Company Profiles (Upto 5 With No Cost)
Additional Countries (Apart From Mentioned Countries)
Country/Region-specific Report
Go To Market Strategy
Region Specific Market DynamicsRegion Level Market Share Import Export AnalysisProduction AnalysisOthers