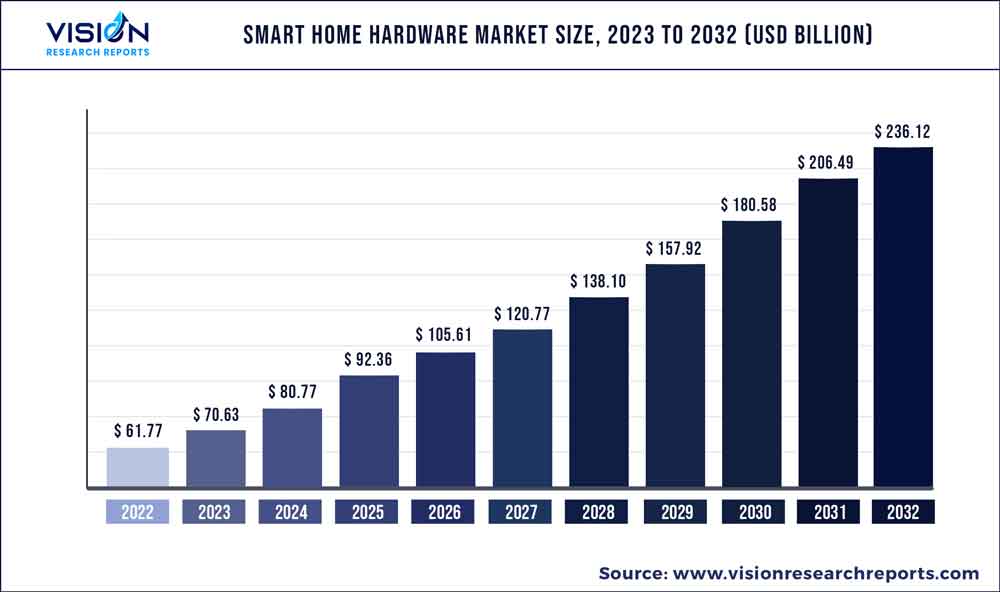
The global smart home hardware market size was estimated at around USD 61.77 billion in 2022 and it is projected to hit around USD 236.12 billion by 2032, growing at a CAGR of 14.35% from 2023 to 2032. The smart home hardware market in the United States was accounted for USD 19.8 billion in 2022.

Key Pointers
Report Scope of the Smart Home Hardware Market
| Report Coverage | Details |
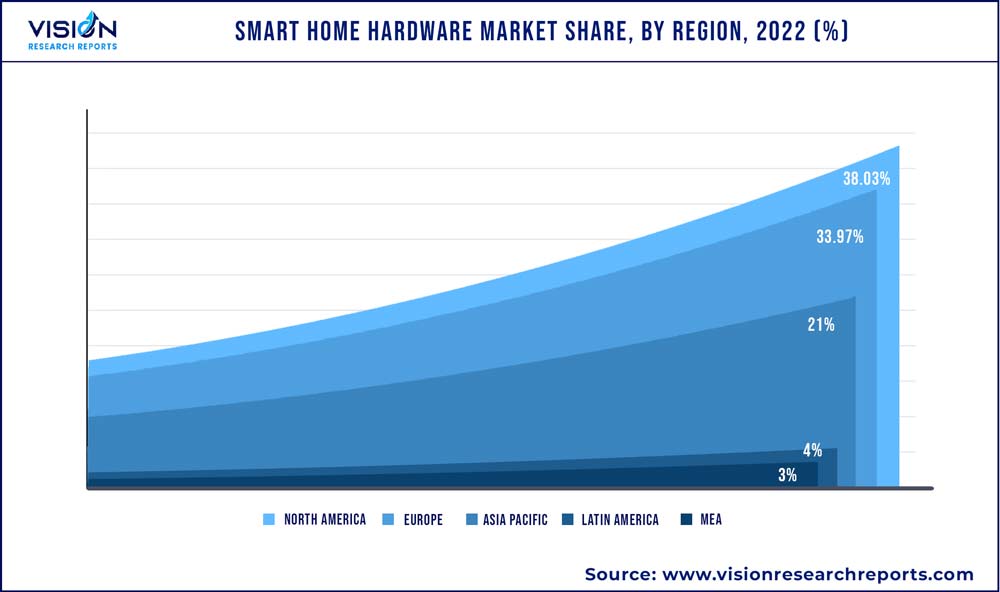
| Revenue Share of North America in 2022 | 38.03% |
| Revenue Forecast by 2032 | USD 236.12 billion |
| Growth Rate from 2023 to 2032 | CAGR of 14.35% |
| Base Year | 2022 |
| Forecast Period | 2023 to 2032 |
| Market Analysis (Terms Used) | Value (US$ Million/Billion) or (Volume/Units) |
| Companies Covered | Google LLC; Amazon.Com Inc.; Honeywell Corporation Inc.; Schneider Electric SE; Johnson Control Inc.; ABB Ltd.; Legrand; Panasonic Corporation; Samsung Electronics Co. Ltd.; General Electric Company |
The increasing availability of affordable smart home devices and the growing number of compatible devices are significant drivers of the smart home hardware industry. In the past, smart home devices were expensive and often required professional installation, which made them inaccessible to most homeowners. However, with advancements in technology and the introduction of new players in the market, the prices of smart home devices have significantly decreased, making them more affordable for the average homeowner.
Moreover, the growing number of compatible devices in the market has made it easier for homeowners to customize their smart home systems according to their needs and preferences. For example, homeowners can now choose from various smart home devices compatible with popular voice assistants like Amazon Alexa or Google Assistant, allowing them to control their devices through voice commands. The quick acceptance of modern technologies, such as the blockchain, Internet of Things (IoT), smart voice recognition, artificial intelligence (AI), and others, significantly impacted market growth. The technology equips smart home products to recognize the voice of users and give them personalized responses. An improved adoption rate of IoT in developing and developed regions has helped grow the smart home hardware industry. The capability of technologies to allow interconnectivity between devices has helped generate further market demand.
The Asia Pacific region has seen significant growth in the smart home hardware market in recent years. The region is growing due to countries such as China, India, and Japan, which drive demand for smart home products. The increasing popularity of smart home devices can be attributed to several factors, including rising disposable income, growing urbanization, and increasing awareness about the benefits of smart home technology. In addition, the proliferation of smartphones and other mobile devices has made it easier for consumers to control and monitor their homes remotely. Further, China is expected to grow at the highest CAGR during the forecast period, owing to the increasing adoption of home automation systems and the growing popularity of voice-activated assistants such as Alibaba.com; T-mall Genie, and Baidu's DuerOS.
Increased deployment of internet and digital gadgets post the COVID-19 outbreak, has led to significant growth in the demand for smart home devices. The increased disposable incomes among individuals due to decreased day-to-day expenses have led to rapid demand for home security solutions, including smart locks and cameras, to facilitate contactless deliveries during COVID-19. With people becoming more conscious about health during this period, increased demand for smart home healthcare solutions, like remote chronic health monitoring systems, has been witnessed. Also, with the changing lifestyle of individuals due to the work-from-home norms, there is a growing demand for smart speakers or hubs to track tasks & meetings and maximize productivity.
Type Insights
The smart appliances segment projected the highest revenue share of over 36.04% in 2022 and the segment is anticipated to hold the maximum share throughout the forecast period. The growth is due to increased household spending and the implementation of smart products in homes. As a result, the efficiency, operational costs, and time-saving benefits remain visible. Smart appliances such as refrigerators and dishwashers are equipped with features such as Wi-Fi and mobile connectivity, artificial intelligence integration, touchscreen controls, attached cameras inside to scan food types for refrigeration purposes, and more are enticing new customers to the market. A substantial mobile penetration rate and connectivity options such as mobile data or Wi-Fi contribute to the segment's demand.
The control & connectivity devices segment is predicted to foresee significant growth in the forecast years. These devices for smart homes have been rapidly evolving over the years. The strong growth is attributed to the features and capabilities offered, such as mobile connectivity, connectivity regardless of location, and more through protocols like ZigBee, Bluetooth, Wi-Fi, Z Wave, etc. Manufacturers prefer protocols that offer smooth communication and no harm to battery life and range. For instance, ZigBee operates on low latency and low-duty cycles for instant device communication, resulting in longer battery life.
Regional Insights
North America dominated the market in 2022, accounting for over 38.03% share of the global revenue. The growth is attributed to the growing adoption of smart home devices to reduce energy charges and maximize energy efficiency. The region is one of the largest markets for smart home devices, and it is expected to continue to grow in the coming years. Increasing awareness and interest in smart home technology, the growing popularity of voice-activated assistants like Amazon Alexa and Google Assistant, and the increasing availability of smart home devices that are easy to install and use have made it easier for people to control their smart home devices using voice commands.

Asia Pacific is anticipated to register the highest CAGR from 2023 to 2032. It is due to the improved standard of living and increased disposable income among individuals in the region. Rapid penetration of smartphones, the internet, and other digitally advanced equipment is expected to drive the market in the region. Furthermore, the increased demand for AI-based digital assistance, such as Siri and Alexa, significantly impacts market growth. The growing need for energy-saving and low-carbon-emission-oriented solutions propels the market in Asia Pacific.
Smart Home Hardware Market Segmentations:
By Type
By Regional
Chapter 1. Introduction
1.1.Research Objective
1.2.Scope of the Study
1.3.Definition
Chapter 2. Research Methodology
2.1.Research Approach
2.2.Data Sources
2.3.Assumptions & Limitations
Chapter 3. Executive Summary
3.1.Market Snapshot
Chapter 4. Market Variables and Scope
4.1.Introduction
4.2.Market Classification and Scope
4.3.Industry Value Chain Analysis
4.3.1. Raw Material Procurement Analysis
4.3.2. Sales and Distribution Channel Analysis
4.3.3. Downstream Buyer Analysis
Chapter 5.COVID 19 Impact on Smart Home Hardware Market
5.1. COVID-19 Landscape: Smart Home Hardware Industry Impact
5.2. COVID 19 - Impact Assessment for the Industry
5.3. COVID 19 Impact: Global Major Government Policy
5.4.Market Trends and Opportunities in the COVID-19 Landscape
Chapter 6. Market Dynamics Analysis and Trends
6.1.Market Dynamics
6.1.1. Market Drivers
6.1.2. Market Restraints
6.1.3. Market Opportunities
6.2.Porter’s Five Forces Analysis
6.2.1. Bargaining power of suppliers
6.2.2. Bargaining power of buyers
6.2.3. Threat of substitute
6.2.4. Threat of new entrants
6.2.5. Degree of competition
Chapter 7. Competitive Landscape
7.1.1. Company Market Share/Positioning Analysis
7.1.2. Key Strategies Adopted by Players
7.1.3. Vendor Landscape
7.1.3.1.List of Suppliers
7.1.3.2.List of Buyers
Chapter 8. Global Smart Home Hardware Market, By Type
8.1.Smart Home Hardware Market, by Type Type, 2023-2032
8.1.1. Control & Connectivity Devices
8.1.1.1.Market Revenue and Forecast (2020-2032)
8.1.2. Security & Surveillance Equipment
8.1.2.1.Market Revenue and Forecast (2020-2032)
8.1.3. Smart Appliances
8.1.3.1.Market Revenue and Forecast (2020-2032)
Chapter 9. Global Smart Home Hardware Market, Regional Estimates and Trend Forecast
9.1. North America
9.1.1. Market Revenue and Forecast, by Type (2020-2032)
9.1.2. U.S.
9.1.2.1. Market Revenue and Forecast, by Type (2020-2032)
9.1.3. Rest of North America
9.1.3.1. Market Revenue and Forecast, by Type (2020-2032)
9.2. Europe
9.2.1. Market Revenue and Forecast, by Type (2020-2032)
9.2.2. UK
9.2.2.1. Market Revenue and Forecast, by Type (2020-2032)
9.2.3. Germany
9.2.3.1. Market Revenue and Forecast, by Type (2020-2032)
9.2.4. France
9.2.4.1. Market Revenue and Forecast, by Type (2020-2032)
9.2.5. Rest of Europe
9.2.5.1. Market Revenue and Forecast, by Type (2020-2032)
9.3. APAC
9.3.1. Market Revenue and Forecast, by Type (2020-2032)
9.3.2. India
9.3.2.1. Market Revenue and Forecast, by Type (2020-2032)
9.3.3. China
9.3.3.1. Market Revenue and Forecast, by Type (2020-2032)
9.3.4. Japan
9.3.4.1. Market Revenue and Forecast, by Type (2020-2032)
9.3.5. Rest of APAC
9.3.5.1. Market Revenue and Forecast, by Type (2020-2032)
9.4. MEA
9.4.1. Market Revenue and Forecast, by Type (2020-2032)
9.4.2. GCC
9.4.2.1. Market Revenue and Forecast, by Type (2020-2032)
9.4.3. North Africa
9.4.3.1. Market Revenue and Forecast, by Type (2020-2032)
9.4.4. South Africa
9.4.4.1. Market Revenue and Forecast, by Type (2020-2032)
9.4.5. Rest of MEA
9.4.5.1. Market Revenue and Forecast, by Type (2020-2032)
9.5. Latin America
9.5.1. Market Revenue and Forecast, by Type (2020-2032)
9.5.2. Brazil
9.5.2.1. Market Revenue and Forecast, by Type (2020-2032)
9.5.3. Rest of LATAM
9.5.3.1. Market Revenue and Forecast, by Type (2020-2032)
Chapter 10.Company Profiles
10.1. Google LLC
10.1.1.Company Overview
10.1.2.Product Offerings
10.1.3.Financial Performance
10.1.4.Recent Initiatives
10.2. Amazon.Com Inc.
10.2.1.Company Overview
10.2.2.Product Offerings
10.2.3.Financial Performance
10.2.4.Recent Initiatives
10.3. Honeywell Corporation Inc.
10.3.1.Company Overview
10.3.2.Product Offerings
10.3.3.Financial Performance
10.3.4.Recent Initiatives
10.4. Schneider Electric SE
10.4.1.Company Overview
10.4.2.Product Offerings
10.4.3.Financial Performance
10.4.4.Recent Initiatives
10.5. Johnson Control Inc.
10.5.1.Company Overview
10.5.2.Product Offerings
10.5.3.Financial Performance
10.5.4.Recent Initiatives
10.6. ABB Ltd.
10.6.1.Company Overview
10.6.2.Product Offerings
10.6.3.Financial Performance
10.6.4.Recent Initiatives
10.7. Legrand
10.7.1.Company Overview
10.7.2.Product Offerings
10.7.3.Financial Performance
10.7.4.Recent Initiatives
10.8. Panasonic Corporation
10.8.1.Company Overview
10.8.2.Product Offerings
10.8.3.Financial Performance
10.8.4.Recent Initiatives
10.9. Samsung Electronics Co. Ltd.
10.9.1.Company Overview
10.9.2.Product Offerings
10.9.3.Financial Performance
10.9.4.Recent Initiatives
10.10. General Electric Company
10.10.1. Company Overview
10.10.2. Product Offerings
10.10.3. Financial Performance
10.10.4. Recent Initiatives
Chapter 11.Research Methodology
11.1.Primary Research
11.2.Secondary Research
11.3.Assumptions
Chapter 12.Appendix
12.1. About Us
12.2. Glossary of Terms
 Cross-segment Market Size and Analysis for
Mentioned Segments
 Additional Company Profiles (Upto 5 With No Cost)
 Additional Countries (Apart From Mentioned Countries)
 Country/Region-specific Report
 Go To Market Strategy
 Region Specific Market Dynamics
 Region Level Market Share
 Import Export Analysis
 Production Analysis
 Others