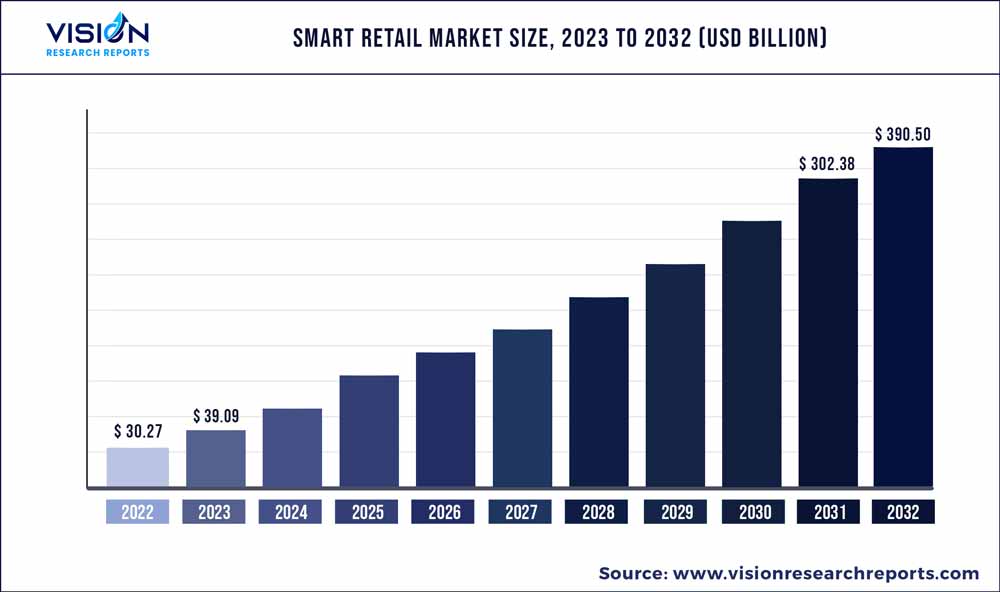
The global smart retail market was surpassed at USD 30.27 billion in 2022 and is expected to hit around USD 390.5 billion by 2032, growing at a CAGR of 29.14% from 2023 to 2032. The smart retail market in the United States was accounted for USD 8.7 billion in 2022.

Key Pointers
Report Scope of the Smart Retail Market
| Report Coverage | Details |
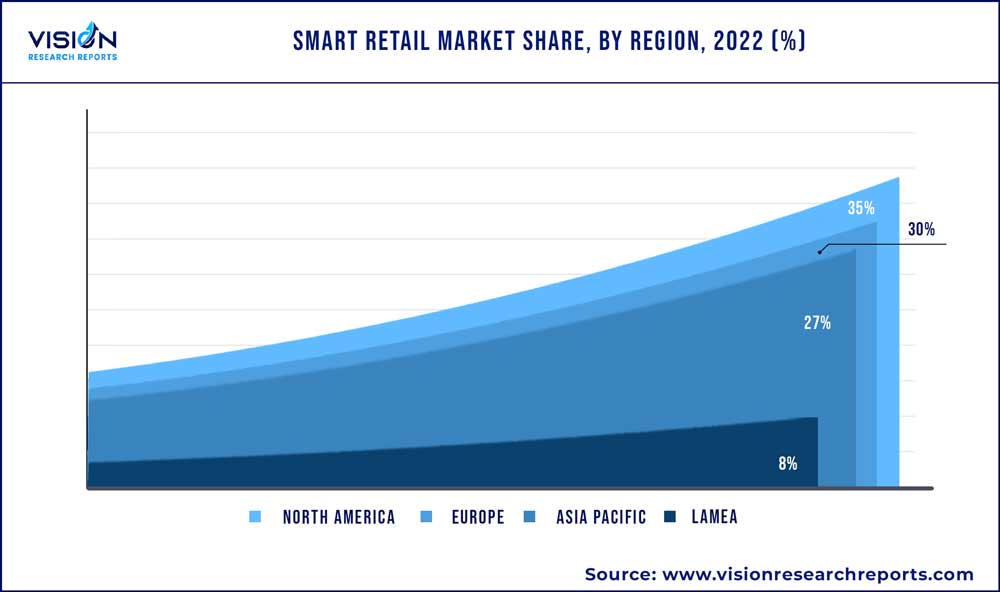
| Revenue Share of North America in 2022 | 35% |
| CAGR of North America from 2023 to 2032 | 30.74% |
| Revenue Forecast by 2032 | USD 390.5 billion |
| Growth Rate from 2023 to 2032 | CAGR of 29.14% |
| Base Year | 2022 |
| Forecast Period | 2023 to 2032 |
| Market Analysis (Terms Used) | Value (US$ Million/Billion) or (Volume/Units) |
| Companies Covered | Amazon.com, Inc.; Cisco Systems, Inc.; Google LLC; Honeywell International Inc.; Huawei Technologies Co., Ltd.; IBM Corporation; Ingenico; Fiserv, Inc.; Intel Corporation; LG Display Co., Ltd.; NCR Corporation; NVIDIA Corporation; NXP Semiconductors; PAX Global Technology Limited; Samsung Electronics; Verifone Systems |
The growing incorporation of technologies such as Artificial Intelligence (AI), Virtual Reality (VR), Augmented Reality (AR), and the Internet of Things (IoT) to enhance consumers’ shopping experience, facilitate accurate inventory management, and improve store operations is one of the significant trends escalating the market growth. AR is particularly transforming the retail industry by allowing brands to interact with consumers through their mobile devices. The adoption of AR in marketing helps in building consumer relationships, enhancing the customer experience, and subsequently driving sales. For instance, Airwalk, a shoe brand, uses AR and geolocation to create a virtual pop-up shop, thereby promoting the relaunch of Airwalk Jim. A significant increase in the number of retail stores across various geographies is also driving the demand for advanced technologies.
Smart retail is a cost-effective and profit-making process for consumers and retailers due to improved supply chain management. However, the impact of COVID-19 has been adverse on the supply chain of smart retail, hampering the movement of goods due to logistics and travel restrictions. Deliveries have been deferred for retailers as well as consumers. This effect on the supply chain stays temporary as things are gradually getting back to normal with safety measures. In the long term, a smart retail supply chain will play a vital role. The smart retailing industry, which had registered a healthy CAGR even before the pandemic, has grown steeply since the COVID-19 outburst. As the pandemic situation is uncertain and cannot be anticipated for the coming months, safety measures levied by regulatory bodies are varying rapidly. Contactless operations and social distancing are enabling consumers to access substitute retailing solutions; this is where smart retail plays a vital role in daily life.
Many retailers, especially SMEs, lack the commercial resources to finance advanced business platforms. There is a rising settlement in the industry that stores must continue to digitize with IoT devices and focus on offering better shopping experiences to stay competitive and attract customers back to stores. Apart from the pandemic situation, smart retail advancements are also assisting the industry in gaining higher demand, for instance, by buying finished goods through the voice process. This AI-based smart retail will ease the buying process and increase the adoption rate. Companies are now rising with situations and changing operations by adopting digital technology and smart retailing services. Smart retail industry players, from small to mega-vendors, are realizing the importance of smart retailing and implementing digital solutions for a better customer experience. Apart from large-scale smart retailing vendors such as Alibaba and Amazon, small-scale players also aim to tap into this opportunity. For instance, mobile manufacturer Vivo launched Vivo Smart Retail to help retailers see the demand for smartphones using its smart retail network in India. Moreover, Amazon and IKEA are using AR-Kit for visualizing their furniture at the user’s desired location.
In recent years, digital payment modes, such as debit cards, credit cards, prepaid cards, electronic wallets, and other digital platforms, are expected to witness significant traction over the forecast period. The shifting consumer preference to cashless transactions and the subsequent increase in the adoption of digital payment solutions across retail stores, including specialty stores, supermarkets, and departmental stores, are particularly expected to drive the growth of the market over the forecast period.
Digitalization can benefit retailers in the form of new customers and reduced operational costs, among other benefits. Digitalization can also be highly motivating for retailers’ employees. Subsequently, digitalization can help in augmenting revenues. Non-store retailing witnessed significant growth in 2020. Developments in technology, improved connectivity, the advent of innovative sensors, and the availability of seamless communication solutions are anticipated to aid online retail stores thereby contributing significantly to the growth of the market over the forecast period.
Solution Insights
The hardware segment accounted for the largest market share of 66% in 2022. Based on solution, the market is segmented into hardware and software. The growing application of Augmented Reality (AR) and Virtual Reality (VR) devices, point of sale (POS) systems, Bluetooth beacons, and Radio-frequency identification (RFID) systems to offer a seamless in-store shopping experience to customers is augmenting the growth of the segment.
The software segment is anticipated to grow at a CAGR of 30.72% during the forecast period. Increasing the adoption of analytics software by retailers across the world, to understand specific end-user’s needs and behavior to improve customer engagement and the shopping experience is one of the crucial factors stimulating the growth of the segment. The need to analyze the changing consumer preferences and put a strong emphasis on customer-centric marketing is also growing in line with the rising retail investment. This is anticipated to create immense opportunities for analytics in smart retailing.
Application Insights
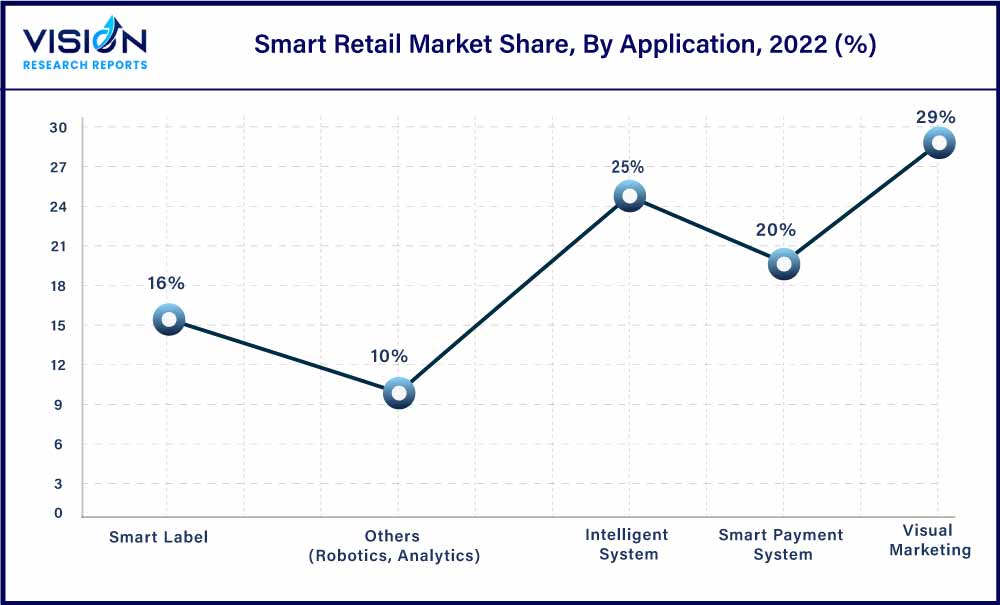
The virtual marketing segment accounted for a market share of 29% in 2022. Based on application, is segmented into visual marketing, smart label, smart payment system, intelligent system, and others (robotics, analytics). Retailers are also considering visual marketing through appealing storefronts, digital signage, interior displays, and state-of-the-art lighting as one of the essential requirements for a smart retail solution to engage customers. Moreover, social media marketing has particularly helped in attracting the millennial population. It has enabled retailers to focus on providing a smooth shopping experience with minimal interference from social media. Hence, in 2020 visual marketing accounted for the majority share of the market. Furthermore, the growth of the e-commerce industry has also opened several opportunities for brick-and-mortar stores. Such stores are utilizing visual marketing for their products and offerings in the form of product snapshots and videos to engage customers and gain traction on e-commerce websites.

The smart payment system segment is anticipated to grow at a CAGR of 30.15% during the forecast period. The smart payment system segment is projected to witness considerable growth over the forecast period. The surge can be attributed to the initiatives being followed to promote digital payments and the increasing need to enhance the customer experience. Besides, a significant increase in cashless transactions is driving the need for POS solutions, e-payment systems, mobile payment apps, and other payment systems. The notable growth in the usage of mobile wallets is also expected to drive the growth of the segment over the forecast period.
Regional Insights
North America held the major share of 35% of the target market in 2022. This region is anticipated to be the leading revenue contributor in the market throughout the forecast period. The growing demand for luxury goods and premium items and the rapidly-changing customer preferences for more convenient and less time-intensive retail experiences. The increasing adoption of digital technology across every application area is restructuring the U.S. economy. The post-pandemic effect has impacted the retail industry by digitally transforming businesses faster than previously planned.

Asia Pacific is anticipated to grow as the fastest-developing regional market at a CAGR of 30.74%. The growing application of smart retail solutions such as big data analytics, intelligent dressing mirrors, reception robots, and shopping guide robots in countries such as Japan and China is expected to drive regional market growth. Apart from big smart retailing players such as Alibaba and Amazon, smaller providers also plan to tap into this opportunity.
Smart Retail Market Segmentations:
By Solution
By Application
By Regional
Chapter 1. Introduction
1.1. Research Objective
1.2. Scope of the Study
1.3. Definition
Chapter 2. Research Methodology
2.1. Research Approach
2.2. Data Sources
2.3. Assumptions & Limitations
Chapter 3. Executive Summary
3.1. Market Snapshot
Chapter 4. Market Variables and Scope
4.1. Introduction
4.2. Market Classification and Scope
4.3. Industry Value Chain Analysis
4.3.1. Raw Material Procurement Analysis
4.3.2. Sales and Distribution Channel Analysis
4.3.3. Downstream Buyer Analysis
Chapter 5. COVID 19 Impact on Smart Retail Market
5.1. COVID-19 Landscape: Smart Retail Industry Impact
5.2. COVID 19 - Impact Assessment for the Industry
5.3. COVID 19 Impact: Global Major Government Policy
5.4. Market Trends and Opportunities in the COVID-19 Landscape
Chapter 6. Market Dynamics Analysis and Trends
6.1. Market Dynamics
6.1.1. Market Drivers
6.1.2. Market Restraints
6.1.3. Market Opportunities
6.2. Porter’s Five Forces Analysis
6.2.1. Bargaining power of suppliers
6.2.2. Bargaining power of buyers
6.2.3. Threat of substitute
6.2.4. Threat of new entrants
6.2.5. Degree of competition
Chapter 7. Competitive Landscape
7.1.1. Company Market Share/Positioning Analysis
7.1.2. Key Strategies Adopted by Players
7.1.3. Vendor Landscape
7.1.3.1. List of Suppliers
7.1.3.2. List of Buyers
Chapter 8. Global Smart Retail Market, By Solution
8.1. Smart Retail Market, by Solution, 2023-2032
8.1.1. Hardware
8.1.1.1. Market Revenue and Forecast (2020-2032)
8.1.2. Software
8.1.2.1. Market Revenue and Forecast (2020-2032)
Chapter 9. Global Smart Retail Market, By Application
9.1. Smart Retail Market, by Application, 2023-2032
9.1.1. Visual Marketing
9.1.1.1. Market Revenue and Forecast (2020-2032)
9.1.2. Smart Label
9.1.2.1. Market Revenue and Forecast (2020-2032)
9.1.3. Smart Payment System
9.1.3.1. Market Revenue and Forecast (2020-2032)
9.1.4. Intelligent System
9.1.4.1. Market Revenue and Forecast (2020-2032)
9.1.5. Others (Robotics, Analytics)
9.1.5.1. Market Revenue and Forecast (2020-2032)
Chapter 10. Global Smart Retail Market, Regional Estimates and Trend Forecast
10.1. North America
10.1.1. Market Revenue and Forecast, by Solution (2020-2032)
10.1.2. Market Revenue and Forecast, by Application (2020-2032)
10.1.3. U.S.
10.1.3.1. Market Revenue and Forecast, by Solution (2020-2032)
10.1.3.2. Market Revenue and Forecast, by Application (2020-2032)
10.1.4. Rest of North America
10.1.4.1. Market Revenue and Forecast, by Solution (2020-2032)
10.1.4.2. Market Revenue and Forecast, by Application (2020-2032)
10.2. Europe
10.2.1. Market Revenue and Forecast, by Solution (2020-2032)
10.2.2. Market Revenue and Forecast, by Application (2020-2032)
10.2.3. UK
10.2.3.1. Market Revenue and Forecast, by Solution (2020-2032)
10.2.3.2. Market Revenue and Forecast, by Application (2020-2032)
10.2.4. Germany
10.2.4.1. Market Revenue and Forecast, by Solution (2020-2032)
10.2.4.2. Market Revenue and Forecast, by Application (2020-2032)
10.2.5. France
10.2.5.1. Market Revenue and Forecast, by Solution (2020-2032)
10.2.5.2. Market Revenue and Forecast, by Application (2020-2032)
10.2.6. Rest of Europe
10.2.6.1. Market Revenue and Forecast, by Solution (2020-2032)
10.2.6.2. Market Revenue and Forecast, by Application (2020-2032)
10.3. APAC
10.3.1. Market Revenue and Forecast, by Solution (2020-2032)
10.3.2. Market Revenue and Forecast, by Application (2020-2032)
10.3.3. India
10.3.3.1. Market Revenue and Forecast, by Solution (2020-2032)
10.3.3.2. Market Revenue and Forecast, by Application (2020-2032)
10.3.4. China
10.3.4.1. Market Revenue and Forecast, by Solution (2020-2032)
10.3.4.2. Market Revenue and Forecast, by Application (2020-2032)
10.3.5. Japan
10.3.5.1. Market Revenue and Forecast, by Solution (2020-2032)
10.3.5.2. Market Revenue and Forecast, by Application (2020-2032)
10.3.6. Rest of APAC
10.3.6.1. Market Revenue and Forecast, by Solution (2020-2032)
10.3.6.2. Market Revenue and Forecast, by Application (2020-2032)
10.4. MEA
10.4.1. Market Revenue and Forecast, by Solution (2020-2032)
10.4.2. Market Revenue and Forecast, by Application (2020-2032)
10.4.3. GCC
10.4.3.1. Market Revenue and Forecast, by Solution (2020-2032)
10.4.3.2. Market Revenue and Forecast, by Application (2020-2032)
10.4.4. North Africa
10.4.4.1. Market Revenue and Forecast, by Solution (2020-2032)
10.4.4.2. Market Revenue and Forecast, by Application (2020-2032)
10.4.5. South Africa
10.4.5.1. Market Revenue and Forecast, by Solution (2020-2032)
10.4.5.2. Market Revenue and Forecast, by Application (2020-2032)
10.4.6. Rest of MEA
10.4.6.1. Market Revenue and Forecast, by Solution (2020-2032)
10.4.6.2. Market Revenue and Forecast, by Application (2020-2032)
10.5. Latin America
10.5.1. Market Revenue and Forecast, by Solution (2020-2032)
10.5.2. Market Revenue and Forecast, by Application (2020-2032)
10.5.3. Brazil
10.5.3.1. Market Revenue and Forecast, by Solution (2020-2032)
10.5.3.2. Market Revenue and Forecast, by Application (2020-2032)
10.5.4. Rest of LATAM
10.5.4.1. Market Revenue and Forecast, by Solution (2020-2032)
10.5.4.2. Market Revenue and Forecast, by Application (2020-2032)
Chapter 11. Company Profiles
11.1. Amazon.com, Inc.
11.1.1. Company Overview
11.1.2. Product Offerings
11.1.3. Financial Performance
11.1.4. Recent Initiatives
11.2. Cisco Systems, Inc.
11.2.1. Company Overview
11.2.2. Product Offerings
11.2.3. Financial Performance
11.2.4. Recent Initiatives
11.3. Google LLC
11.3.1. Company Overview
11.3.2. Product Offerings
11.3.3. Financial Performance
11.3.4. Recent Initiatives
11.4. Honeywell International Inc.
11.4.1. Company Overview
11.4.2. Product Offerings
11.4.3. Financial Performance
11.4.4. LTE Scientific
11.5. Huawei Technologies Co., Ltd
11.5.1. Company Overview
11.5.2. Product Offerings
11.5.3. Financial Performance
11.5.4. Recent Initiatives
11.6. IBM Corporation
11.6.1. Company Overview
11.6.2. Product Offerings
11.6.3. Financial Performance
11.6.4. Recent Initiatives
11.7. Ingenico
11.7.1. Company Overview
11.7.2. Product Offerings
11.7.3. Financial Performance
11.7.4. Recent Initiatives
11.8. Fiserv, Inc.
11.8.1. Company Overview
11.8.2. Product Offerings
11.8.3. Financial Performance
11.8.4. Recent Initiatives
11.9. Intel Corporation
11.9.1. Company Overview
11.9.2. Product Offerings
11.9.3. Financial Performance
11.9.4. Recent Initiatives
11.10. LG Display Co., Ltd.
11.10.1. Company Overview
11.10.2. Product Offerings
11.10.3. Financial Performance
11.10.4. Recent Initiatives
Chapter 12. Research Methodology
12.1. Primary Research
12.2. Secondary Research
12.3. Assumptions
Chapter 13. Appendix
13.1. About Us
13.2. Glossary of Terms
 Cross-segment Market Size and Analysis for
Mentioned Segments
 Additional Company Profiles (Upto 5 With No Cost)
 Additional Countries (Apart From Mentioned Countries)
 Country/Region-specific Report
 Go To Market Strategy
 Region Specific Market Dynamics
 Region Level Market Share
 Import Export Analysis
 Production Analysis
 Others