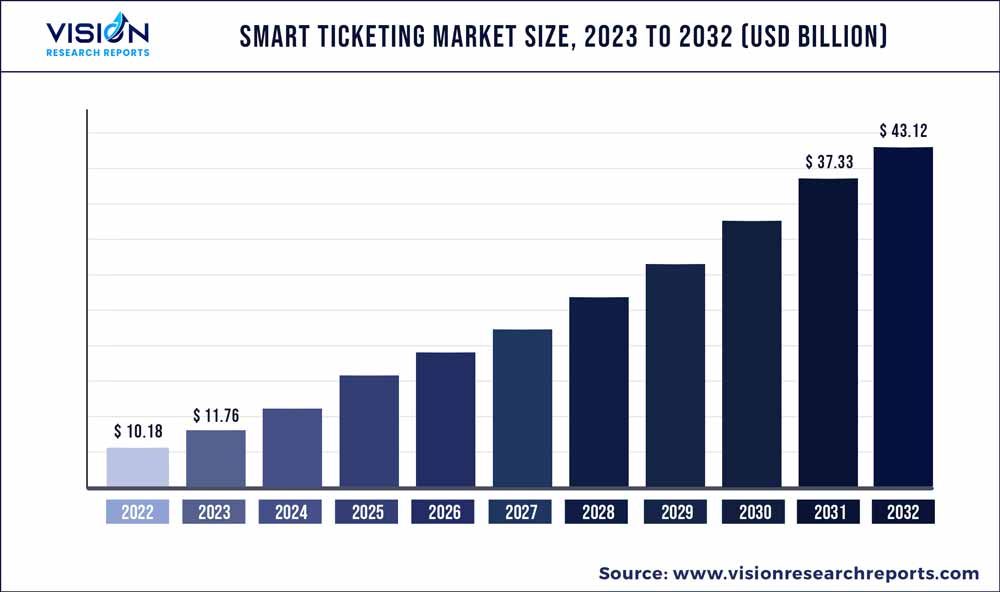
The global smart ticketing market was valued at USD 10.18 billion in 2022 and it is predicted to surpass around USD 43.12 billion by 2032 with a CAGR of 15.53% from 2023 to 2032. The smart ticketing market in the United States was accounted for USD 1.11 billion in 2022.

Key Pointers
Report Scope of the Smart Ticketing Market
| Report Coverage | Details |
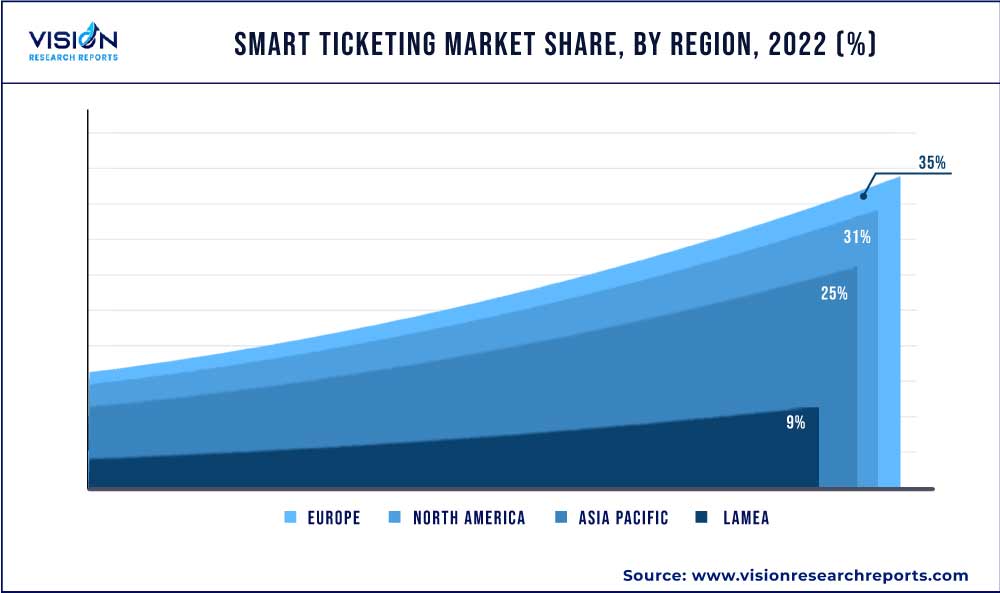
| Revenue Share of Europe in 2022 | 35% |
| Revenue Forecast by 2032 | USD 43.12 billion |
| Growth Rate from 2023 to 2032 | CAGR of 15.53 |
| Base Year | 2022 |
| Forecast Period | 2023 to 2032 |
| Market Analysis (Terms Used) | Value (US$ Million/Billion) or (Volume/Units) |
| Companies Covered | Confidex Ltd.; CPI Card Group Inc.; Cubic Corporation; Thales; Giesecke & Devrient GmbH; HID Global Corporation (ASSA ABLOY); Infineon Technologies AG; NXP Semiconductors; IDEMIA; Xerox Corporation |
The primary factor leading to the growth in adopting smart ticketing solutions is the increasing incorporation of emerging technologies. The introduction of innovative means for purchasing and paying for tickets, such as contactless payment systems, virtual tickets (E-tickets), and smart cards, enables smooth and efficient transit. In addition, the availability of multi-modal disbursement channels through online ticketing systems, smartphones, E-kiosks, and smart ticketing machines is supplementing effective crowd management and making smart ticketing systems preferable over traditional paper-based ticketing systems.
Moreover, changing customer preferences for digital channels to access transport services is driving market growth. Various benefits in the form of reduced waiting time compared to waiting in queues during peak hours, subsidized fares, real-time route updates, and a personalized mobility experience make a strong appeal among customers for online ticketing systems. Moreover, the advantages of smart ticketing solutions for transport operators include reduced maintenance costs, access to an integrated ticketing infrastructure, and cost-effective use of resources, such as employees, energy, and paper. Thus, the use of smart ticketing systems is expected to rise over the forecast period contributing to the growth of the overall market.
In addition to its application in transportation operations, smart ticketing solutions are also gaining traction to meet ticketing needs in the sporting and entertainment industry. Smart ticketing systems allow scalability when integrated with point-of-sale and self-service kiosks. Smart ticketing systems also provide real-time customer data and improve customer engagement and experience. For instance, in March 2023, Major League Soccer (MLS) selected Ticketmaster as its official ticketing partner through a multi-year agreement seeking to personalize the entire customer experience using next-generation interactive tools, such as 3D stadium views. The ability to leverage technology to connect to various smart & connected devices and provide a unified experience is also driving the market growth.
For instance, in September 2021, a French fairground known as Fabrikus World delegated the digital transformation of its theme park to CONNECT&GO, a global leader in Radio Frequency Identification (RFID). CONNECT&GO would help build an omnichannel ticketing platform, including online, physical ticketing offices, and cashless payments. The partnership also helped Fabrikus World launch its currency, Fabcoin, which would be available on chip cards. Data security concerns are one of the restraints hindering market growth. Smart ticketing systems are open-loop and typically require users to provide personal information, such as their name, contact details, and payment information. They also inherit risks of such data being accessed or misused if the system’s security measures need to be improved. Companies are upgrading to use technology, such as blockchain, to overcome these restraints.
Component Insights
The hardware segment dominated the market in 2022 and accounted for a revenue share of above 52%. The deployment of custom and readily available innovative hardware solutions enable transport operators to issue and read tickets via a single interface. The adoption of smart ticketing systems as a measure to transcend to a more digitally advanced ticketing infrastructure has been a driving factor for the growth of the hardware segment. Moreover, the need for upgrades to legacy transportation ticketing systems is expected to drive the growth of the hardware segment.
The service segment is anticipated to register significant growth over the forecast period. A comprehensive and straightforward ticketing system is essential to promote the use of public transportation systems. Smart ticketing companies increasingly emphasize supporting the integration and deployment services for the convenient use of smart ticketing systems. An illustration of a prominent service provided by smart ticketing companies is Mobility as a Service (MaaS), which enables end-to-end booking and payments.
Product Insights
The E-ticket segment dominated the market in 2022 and accounted for a more than 26% revenue share. The pandemic outbreak resulted in a surge in contactless payments and services across industries, including the transportation industry. For instance, in May 2023, VIA Metropolitan Transit enabled riders to purchase tickets through the Uber application and other means, such as the VIA goMobile+application. E-ticketing systems provide users with flexibility in payments for ticket purchases across transportation modes.
The smart parking system segment is expected to grow significantly over the forecast period. Rising emphasis on building smart cities and improving the reliability and productivity of urban infrastructure is expected to drive the smart parking segment growth. Smart ticketing solutions are being introduced for efficient traffic and parking management. For instance, in March 2023, Mobile Smart City installed pay-in-lane contactless equipment for entry and exit access control.
System Insights
The smart card segment dominated the market in 2022 and accounted for a more than 48% revenue share. The benefits associated with using smart cards, such as durability, efficiency, and convenience in travel, are expected to drive its growing adoption over the forecast period. Trainline, a UK-based online coach and rail ticket seller, reported that local travelers saved as much as 69% in travel costs in 2022. Moreover, numerous countries, such as Hong Kong, South Korea, and Japan, have multi-purpose smart cards that can also be used to purchase at retail stores and vending machines.
The near-field communication segment is anticipated to grow significantly over the forecast period. Near-field communication systems have proved vital in providing a frictionless ticketing experience. In addition, near-field communication transactions can be validated in 120 milliseconds. Innovative payment methods, such as tap-and-go through Quick Response (QR) codes, debit, and credit cards, have increased customer convenience in conducting many transactions, which are expected to bode well for market growth.
End-use Insights
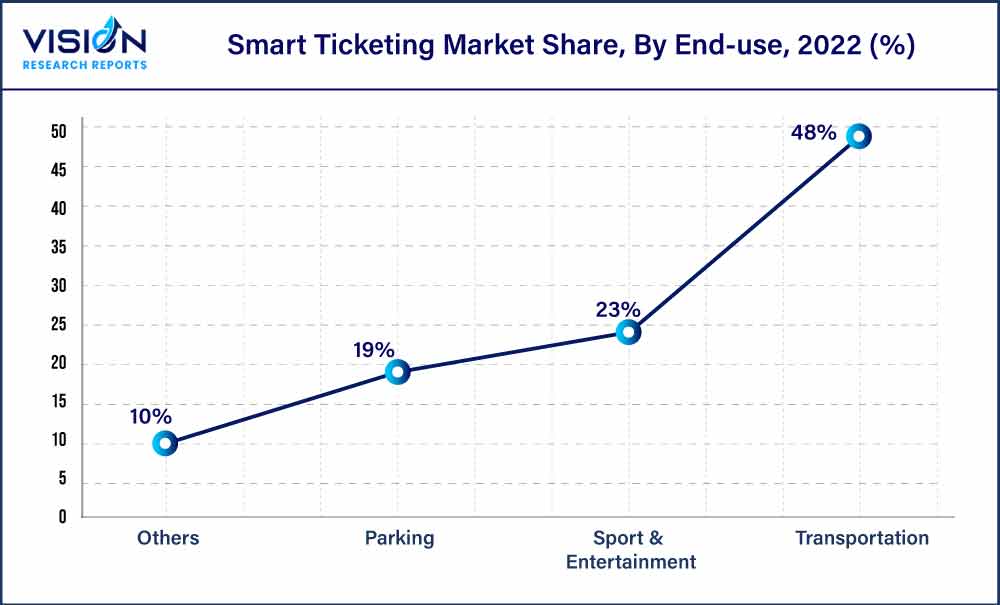
The transportation segment dominated the market in 2022 and accounted for a more than 48% revenue share. Smart ticketing systems are safe, and agile, and help in automated fare collection & resource management. The benefits of a streamlined travel and ticketing system are leading to its rising incorporation by various transportation departments. For instance, in February 2023, the Australian Capital Territory (ACT) Government partnered with NEC Corporation to build a next-generation ticketing solution.

The sport & entertainment segment is anticipated to grow fastest over the forecast period. The segment growth can be attributed to sporting stadiums and entertainment venues incorporating contactless ticketing systems. The latest technology, blockchain, is also being leveraged to make smart ticketing more efficient and secure. For instance, France is considering implementing a blockchain-based, Non-fungible Token ticketing system for the Olympic Games in 2024.
Regional Insights
Europe dominated the market in 2022 and accounted for a more than 35% revenue share. The growing emphasis of the European Commission to develop intelligent transportation systems and tackle the region’s congestion and emission problems is a primary factor driving the demand for smart ticketing systems. In February 2023, the Multimodal Passenger Mobility Forum was established to assist the European Commission in drafting policy initiatives targeting multimodal mobility. Moreover, the presence of prominent players, such as Thales and Giesecke & Devrient GmbH, bode well for the regional market growth.

Asia Pacific is expected to emerge as the fastest-growing regional market over the forecast period. The adoption of smart ticketing solutions is expected to rise in the Asia Pacific region due to the presence of highly populated countries, such as China and India. Growing regional digitization is also expected to bode well for the growth of the market. For instance, in April 2023, China launched a train ticketing system that integrates various ticket-selling platforms from over 140 nations into a unified mobile application.
Smart Ticketing Market Segmentations:
By Component
By Product
By System
By End-use
By Regional
Chapter 1. Introduction
1.1. Research Objective
1.2. Scope of the Study
1.3. Definition
Chapter 2. Research Methodology
2.1. Research Approach
2.2. Data Sources
2.3. Assumptions & Limitations
Chapter 3. Executive Summary
3.1. Market Snapshot
Chapter 4. Market Variables and Scope
4.1. Introduction
4.2. Market Classification and Scope
4.3. Industry Value Chain Analysis
4.3.1. Raw Material Procurement Analysis
4.3.2. Sales and Distribution Channel Analysis
4.3.3. Downstream Buyer Analysis
Chapter 5. COVID 19 Impact on Smart Ticketing Market
5.1. COVID-19 Landscape: Smart Ticketing Industry Impact
5.2. COVID 19 - Impact Assessment for the Industry
5.3. COVID 19 Impact: Global Major Government Policy
5.4. Market Trends and Opportunities in the COVID-19 Landscape
Chapter 6. Market Dynamics Analysis and Trends
6.1. Market Dynamics
6.1.1. Market Drivers
6.1.2. Market Restraints
6.1.3. Market Opportunities
6.2. Porter’s Five Forces Analysis
6.2.1. Bargaining power of suppliers
6.2.2. Bargaining power of buyers
6.2.3. Threat of substitute
6.2.4. Threat of new entrants
6.2.5. Degree of competition
Chapter 7. Competitive Landscape
7.1.1. Company Market Share/Positioning Analysis
7.1.2. Key Strategies Adopted by Players
7.1.3. Vendor Landscape
7.1.3.1. List of Suppliers
7.1.3.2. List of Buyers
Chapter 8. Global Smart Ticketing Market, By Component
8.1. Smart Ticketing Market, by Component, 2023-2032
8.1.1. Hardware
8.1.1.1. Market Revenue and Forecast (2020-2032)
8.1.2. Software
8.1.2.1. Market Revenue and Forecast (2020-2032)
8.1.3. Service
8.1.3.1. Market Revenue and Forecast (2020-2032)
Chapter 9. Global Smart Ticketing Market, By Product
9.1. Smart Ticketing Market, by Product, 2023-2032
9.1.1. E-kiosk
9.1.1.1. Market Revenue and Forecast (2020-2032)
9.1.2. E-ticket
9.1.2.1. Market Revenue and Forecast (2020-2032)
9.1.3. E-toll
9.1.3.1. Market Revenue and Forecast (2020-2032)
9.1.4. Request Tracker
9.1.4.1. Market Revenue and Forecast (2020-2032)
9.1.5. Smart Parking System
9.1.5.1. Market Revenue and Forecast (2020-2032)
9.1.6. Ticket Machine
9.1.6.1. Market Revenue and Forecast (2020-2032)
9.1.7. Ticket Validators
9.1.7.1. Market Revenue and Forecast (2020-2032)
9.1.8. Others
9.1.8.1. Market Revenue and Forecast (2020-2032)
Chapter 10. Global Smart Ticketing Market, By System
10.1. Smart Ticketing Market, by System, 2023-2032
10.1.1. Open Payment System
10.1.1.1. Market Revenue and Forecast (2020-2032)
10.1.2. Smart Card
10.1.2.1. Market Revenue and Forecast (2020-2032)
10.1.3. Near-field Communication
10.1.3.1. Market Revenue and Forecast (2020-2032)
Chapter 11. Global Smart Ticketing Market, By End-use
11.1. Smart Ticketing Market, by End-use, 2023-2032
11.1.1. Parking
11.1.1.1. Market Revenue and Forecast (2020-2032)
11.1.2. Sport & Entertainment
11.1.2.1. Market Revenue and Forecast (2020-2032)
11.1.3. Transportation
11.1.3.1. Market Revenue and Forecast (2020-2032)
11.1.4. Others
11.1.4.1. Market Revenue and Forecast (2020-2032)
Chapter 12. Global Smart Ticketing Market, Regional Estimates and Trend Forecast
12.1. North America
12.1.1. Market Revenue and Forecast, by Component (2020-2032)
12.1.2. Market Revenue and Forecast, by Product (2020-2032)
12.1.3. Market Revenue and Forecast, by System (2020-2032)
12.1.4. Market Revenue and Forecast, by End-use (2020-2032)
12.1.5. U.S.
12.1.5.1. Market Revenue and Forecast, by Component (2020-2032)
12.1.5.2. Market Revenue and Forecast, by Product (2020-2032)
12.1.5.3. Market Revenue and Forecast, by System (2020-2032)
12.1.5.4. Market Revenue and Forecast, by End-use (2020-2032)
12.1.6. Rest of North America
12.1.6.1. Market Revenue and Forecast, by Component (2020-2032)
12.1.6.2. Market Revenue and Forecast, by Product (2020-2032)
12.1.6.3. Market Revenue and Forecast, by System (2020-2032)
12.1.6.4. Market Revenue and Forecast, by End-use (2020-2032)
12.2. Europe
12.2.1. Market Revenue and Forecast, by Component (2020-2032)
12.2.2. Market Revenue and Forecast, by Product (2020-2032)
12.2.3. Market Revenue and Forecast, by System (2020-2032)
12.2.4. Market Revenue and Forecast, by End-use (2020-2032)
12.2.5. UK
12.2.5.1. Market Revenue and Forecast, by Component (2020-2032)
12.2.5.2. Market Revenue and Forecast, by Product (2020-2032)
12.2.5.3. Market Revenue and Forecast, by System (2020-2032)
12.2.5.4. Market Revenue and Forecast, by End-use (2020-2032)
12.2.6. Germany
12.2.6.1. Market Revenue and Forecast, by Component (2020-2032)
12.2.6.2. Market Revenue and Forecast, by Product (2020-2032)
12.2.6.3. Market Revenue and Forecast, by System (2020-2032)
12.2.6.4. Market Revenue and Forecast, by End-use (2020-2032)
12.2.7. France
12.2.7.1. Market Revenue and Forecast, by Component (2020-2032)
12.2.7.2. Market Revenue and Forecast, by Product (2020-2032)
12.2.7.3. Market Revenue and Forecast, by System (2020-2032)
12.2.7.4. Market Revenue and Forecast, by End-use (2020-2032)
12.2.8. Rest of Europe
12.2.8.1. Market Revenue and Forecast, by Component (2020-2032)
12.2.8.2. Market Revenue and Forecast, by Product (2020-2032)
12.2.8.3. Market Revenue and Forecast, by System (2020-2032)
12.2.8.4. Market Revenue and Forecast, by End-use (2020-2032)
12.3. APAC
12.3.1. Market Revenue and Forecast, by Component (2020-2032)
12.3.2. Market Revenue and Forecast, by Product (2020-2032)
12.3.3. Market Revenue and Forecast, by System (2020-2032)
12.3.4. Market Revenue and Forecast, by End-use (2020-2032)
12.3.5. India
12.3.5.1. Market Revenue and Forecast, by Component (2020-2032)
12.3.5.2. Market Revenue and Forecast, by Product (2020-2032)
12.3.5.3. Market Revenue and Forecast, by System (2020-2032)
12.3.5.4. Market Revenue and Forecast, by End-use (2020-2032)
12.3.6. China
12.3.6.1. Market Revenue and Forecast, by Component (2020-2032)
12.3.6.2. Market Revenue and Forecast, by Product (2020-2032)
12.3.6.3. Market Revenue and Forecast, by System (2020-2032)
12.3.6.4. Market Revenue and Forecast, by End-use (2020-2032)
12.3.7. Japan
12.3.7.1. Market Revenue and Forecast, by Component (2020-2032)
12.3.7.2. Market Revenue and Forecast, by Product (2020-2032)
12.3.7.3. Market Revenue and Forecast, by System (2020-2032)
12.3.7.4. Market Revenue and Forecast, by End-use (2020-2032)
12.3.8. Rest of APAC
12.3.8.1. Market Revenue and Forecast, by Component (2020-2032)
12.3.8.2. Market Revenue and Forecast, by Product (2020-2032)
12.3.8.3. Market Revenue and Forecast, by System (2020-2032)
12.3.8.4. Market Revenue and Forecast, by End-use (2020-2032)
12.4. MEA
12.4.1. Market Revenue and Forecast, by Component (2020-2032)
12.4.2. Market Revenue and Forecast, by Product (2020-2032)
12.4.3. Market Revenue and Forecast, by System (2020-2032)
12.4.4. Market Revenue and Forecast, by End-use (2020-2032)
12.4.5. GCC
12.4.5.1. Market Revenue and Forecast, by Component (2020-2032)
12.4.5.2. Market Revenue and Forecast, by Product (2020-2032)
12.4.5.3. Market Revenue and Forecast, by System (2020-2032)
12.4.5.4. Market Revenue and Forecast, by End-use (2020-2032)
12.4.6. North Africa
12.4.6.1. Market Revenue and Forecast, by Component (2020-2032)
12.4.6.2. Market Revenue and Forecast, by Product (2020-2032)
12.4.6.3. Market Revenue and Forecast, by System (2020-2032)
12.4.6.4. Market Revenue and Forecast, by End-use (2020-2032)
12.4.7. South Africa
12.4.7.1. Market Revenue and Forecast, by Component (2020-2032)
12.4.7.2. Market Revenue and Forecast, by Product (2020-2032)
12.4.7.3. Market Revenue and Forecast, by System (2020-2032)
12.4.7.4. Market Revenue and Forecast, by End-use (2020-2032)
12.4.8. Rest of MEA
12.4.8.1. Market Revenue and Forecast, by Component (2020-2032)
12.4.8.2. Market Revenue and Forecast, by Product (2020-2032)
12.4.8.3. Market Revenue and Forecast, by System (2020-2032)
12.4.8.4. Market Revenue and Forecast, by End-use (2020-2032)
12.5. Latin America
12.5.1. Market Revenue and Forecast, by Component (2020-2032)
12.5.2. Market Revenue and Forecast, by Product (2020-2032)
12.5.3. Market Revenue and Forecast, by System (2020-2032)
12.5.4. Market Revenue and Forecast, by End-use (2020-2032)
12.5.5. Brazil
12.5.5.1. Market Revenue and Forecast, by Component (2020-2032)
12.5.5.2. Market Revenue and Forecast, by Product (2020-2032)
12.5.5.3. Market Revenue and Forecast, by System (2020-2032)
12.5.5.4. Market Revenue and Forecast, by End-use (2020-2032)
12.5.6. Rest of LATAM
12.5.6.1. Market Revenue and Forecast, by Component (2020-2032)
12.5.6.2. Market Revenue and Forecast, by Product (2020-2032)
12.5.6.3. Market Revenue and Forecast, by System (2020-2032)
12.5.6.4. Market Revenue and Forecast, by End-use (2020-2032)
Chapter 13. Company Profiles
13.1. Confidex Ltd.
13.1.1. Company Overview
13.1.2. Product Offerings
13.1.3. Financial Performance
13.1.4. Recent Initiatives
13.2. CPI Card Group Inc.
13.2.1. Company Overview
13.2.2. Product Offerings
13.2.3. Financial Performance
13.2.4. Recent Initiatives
13.3. Cubic Corporation
13.3.1. Company Overview
13.3.2. Product Offerings
13.3.3. Financial Performance
13.3.4. Recent Initiatives
13.4. Thales
13.4.1. Company Overview
13.4.2. Product Offerings
13.4.3. Financial Performance
13.4.4. Recent Initiatives
13.5. Giesecke & Devrient GmbH
13.5.1. Company Overview
13.5.2. Product Offerings
13.5.3. Financial Performance
13.5.4. Recent Initiatives
13.6. HID Global Corporation (ASSA ABLOY)
13.6.1. Company Overview
13.6.2. Product Offerings
13.6.3. Financial Performance
13.6.4. Recent Initiatives
13.7. Infineon Technologies AG
13.7.1. Company Overview
13.7.2. Product Offerings
13.7.3. Financial Performance
13.7.4. Recent Initiatives
13.8. NXP Semiconductors
13.8.1. Company Overview
13.8.2. Product Offerings
13.8.3. Financial Performance
13.8.4. Recent Initiatives
13.9. IDEMIA
13.9.1. Company Overview
13.9.2. Product Offerings
13.9.3. Financial Performance
13.9.4. Recent Initiatives
13.10. Xerox Corporation
13.10.1. Company Overview
13.10.2. Product Offerings
13.10.3. Financial Performance
13.10.4. Recent Initiatives
Chapter 14. Research Methodology
14.1. Primary Research
14.2. Secondary Research
14.3. Assumptions
Chapter 15. Appendix
15.1. About Us
15.2. Glossary of Terms
 Cross-segment Market Size and Analysis for
Mentioned Segments
 Additional Company Profiles (Upto 5 With No Cost)
 Additional Countries (Apart From Mentioned Countries)
 Country/Region-specific Report
 Go To Market Strategy
 Region Specific Market Dynamics
 Region Level Market Share
 Import Export Analysis
 Production Analysis
 Others