Smart Transportation Market Size, Share | Report 2023-2032
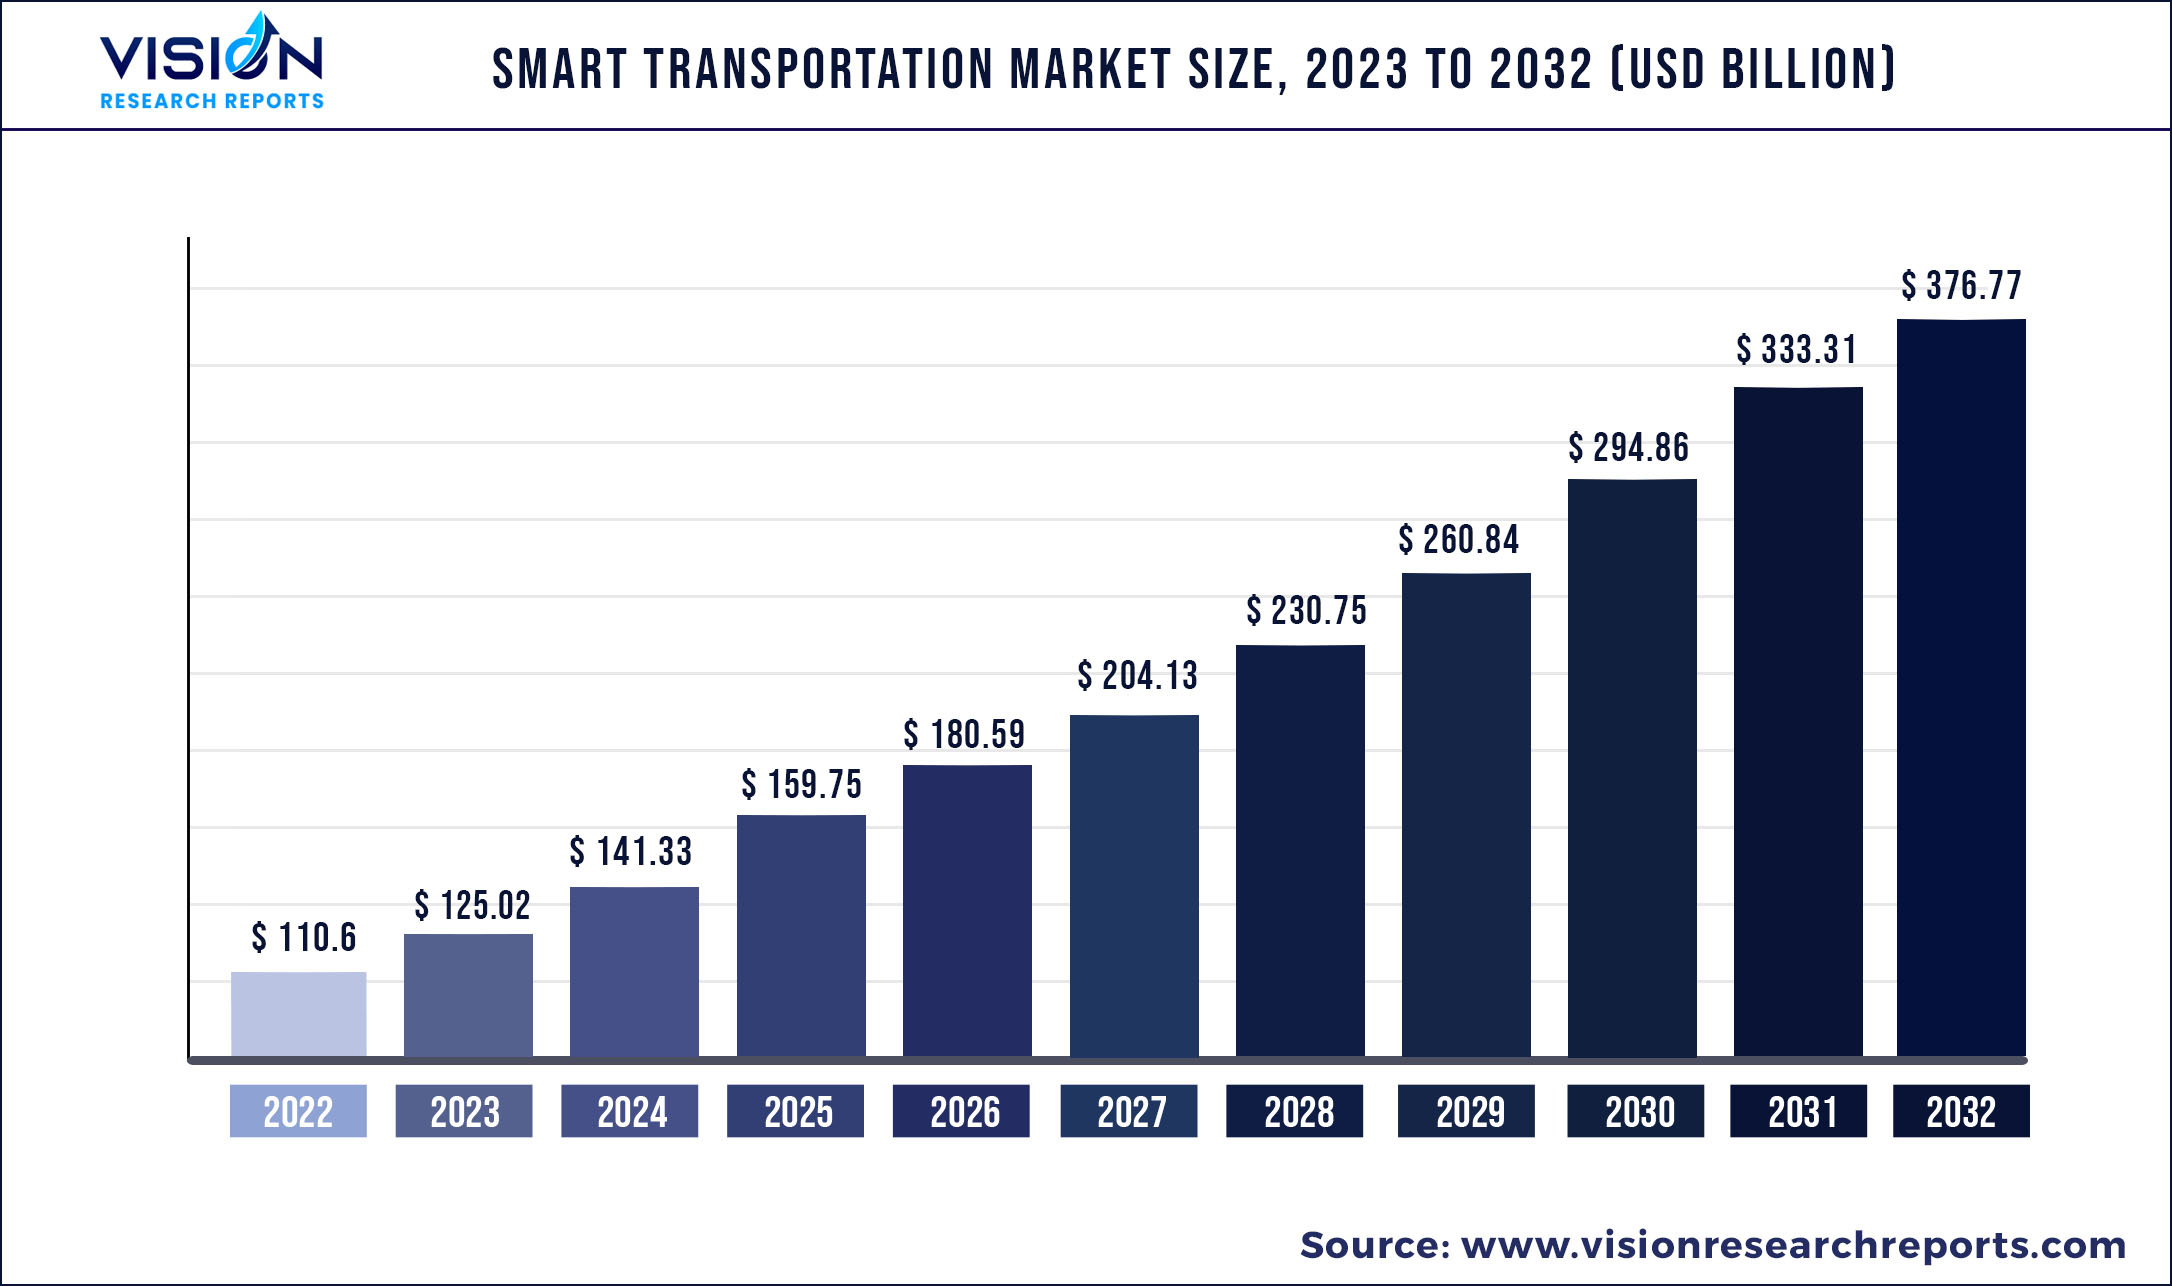
The global smart transportation market size was estimated at around USD 110.6 billion in 2022 and it is projected to hit around USD 376.77 billion by 2032, growing at a CAGR of 13.04% from 2023 to 2032.
Key Pointers
| Report Coverage | Details |
| Market Size in 2022 | USD 110.6 billion |
| Revenue Forecast by 2032 | USD 376.77 billion |
| Growth rate from 2023 to 2032 | CAGR of 13.04% |
| Base Year | 2022 |
| Forecast Period | 2023 to 2032 |
| Regions Covered | North America, Europe, Asia Pacific, Latin America, Middle East & Africa |
| Companies Covered | Accenture PLC; Alstom, SA; Cisco System, Inc.; Cubic Corporation; General Electric Company (GE); Indra Sistema S.A.; International Business Machines Corporation; Kapsch; LG CNS Corporation; Xerox Holdings Corporation |
The market growth is driven by growing advancements in urban projects, government initiatives aimed at reducing greenhouse gas emissions, and the increasing demand for technology integration in traffic control systems. Lack of good quality and safe public transportation, inadequate capacity to manage public transport, concerns about reduced road safety, poor traffic management, and parking problems are significant issues affecting most cities (including pedestrian walkways). Thus, demand for smart transportation systems is likely to witness significant growth in the near future. Factors such as urbanization, the increased acceptance of IoT-based technology, and the expansion of 5G-based connectivity make smart transportation infrastructure easier to execute.
In 2018-2019, to improve traffic management, boost safety, lessen maintenance costs, and enable more efficient use of transportation networks, the market experienced a tremendous expansion in the application of current technology in cars and transportation infrastructure. Furthermore, the introduction of autonomous vehicles, increased expenditures on smart city initiatives, the fall in vehicle ownership, and the expansion of mobility as a service (MaaS) will likely provide significant growth opportunities for players in the smart transportation industry.
For instance, in September 2022, Indra Sistema S.A. announced a partnership with Masmovil Group, a broadband service provider, to create an advanced ecosystem that will fuel the growth of smart 5G services and solutions for the transportation sector. The partnership aims to develop and test innovative solutions based on the 5G communications standard, promoting smarter, more connected, and sustainable mobility.
Several industries around the world were negatively impacted by the COVID-19 outbreak. Government-imposed national shutdowns and quarantines to stop the disease's spread had a significant impact on businesses all around the world, including the market for smart mobility. The transportation sector was significantly impacted by the COVID-19 pandemic.
Travel restrictions implemented to stop the transmission of disease hindered companies' capacity to move people. Total revenues, growth, and people’s income in the transportation sector reduced drastically, as a result. To enhance their offerings and regain consumer trust, travel organizations are keenly focused on data-driven decisions, as public transportation remains highly vulnerable to disease outbreaks. These factors are expected to boost the demand for private transportation services during the forecast period.
The prolonged downtime and substantial capital costs associated with rebuilding the current infrastructure will hinder industry growth over the forecast period. Smart transportation integrates a variety of elements, including hardware, application, and mobile network parts made by various manufacturers, leading to compatibility issues since there is no defined approach. Additionally, communication norms differ greatly across nations, which present difficulties for businesses looking to market their products internationally. However, it is anticipated that expanding demand in developing countries such as China, Brazil, and India would open up new opportunities.
Smart Transportation Market Segmentations:
| By Solution | By Service |
|
Ticketing Management System Parking Management System Integrated Supervision System Traffic Management System |
Cloud Services Business Services Professional Services |
Chapter 1. Introduction
1.1. Research Objective
1.2. Scope of the Study
1.3. Definition
Chapter 2. Research Methodology
2.1. Research Approach
2.2. Data Sources
2.3. Assumptions & Limitations
Chapter 3. Executive Summary
3.1. Market Snapshot
Chapter 4. Market Variables and Scope
4.1. Introduction
4.2. Market Classification and Scope
4.3. Industry Value Chain Analysis
4.3.1. Raw Material Procurement Analysis
4.3.2. Sales and Distribution Channel Analysis
4.3.3. Downstream Buyer Analysis
Chapter 5. COVID 19 Impact on Smart Transportation Market
5.1. COVID-19 Landscape: Smart Transportation Industry Impact
5.2. COVID 19 - Impact Assessment for the Industry
5.3. COVID 19 Impact: Global Major Government Policy
5.4. Market Trends and Opportunities in the COVID-19 Landscape
Chapter 6. Market Dynamics Analysis and Trends
6.1. Market Dynamics
6.1.1. Market Drivers
6.1.2. Market Restraints
6.1.3. Market Opportunities
6.2. Porter’s Five Forces Analysis
6.2.1. Bargaining power of suppliers
6.2.2. Bargaining power of buyers
6.2.3. Threat of substitute
6.2.4. Threat of new entrants
6.2.5. Degree of competition
Chapter 7. Competitive Landscape
7.1.1. Company Market Share/Positioning Analysis
7.1.2. Key Strategies Adopted by Players
7.1.3. Vendor Landscape
7.1.3.1. List of Suppliers
7.1.3.2. List of Buyers
Chapter 8. Global Smart Transportation Market, By Solution
8.1. Smart Transportation Market, by Solution, 2023-2032
8.1.1. Ticketing Management System
8.1.1.1. Market Revenue and Forecast (2020-2032)
8.1.2. Parking Management System
8.1.2.1. Market Revenue and Forecast (2020-2032)
8.1.3. Integrated Supervision System
8.1.3.1. Market Revenue and Forecast (2020-2032)
8.1.4. Traffic Management System
8.1.4.1. Market Revenue and Forecast (2020-2032)
Chapter 9. Global Smart Transportation Market, By Service
9.1. Smart Transportation Market, by Service, 2023-2032
9.1.1. Cloud Services
9.1.1.1. Market Revenue and Forecast (2020-2032)
9.1.2. Business Services
9.1.2.1. Market Revenue and Forecast (2020-2032)
9.1.3. Professional Services
9.1.3.1. Market Revenue and Forecast (2020-2032)
Chapter 10. Global Smart Transportation Market, Regional Estimates and Trend Forecast
10.1. North America
10.1.1. Market Revenue and Forecast, by Solution (2020-2032)
10.1.2. Market Revenue and Forecast, by Service (2020-2032)
10.1.3. U.S.
10.1.3.1. Market Revenue and Forecast, by Solution (2020-2032)
10.1.3.2. Market Revenue and Forecast, by Service (2020-2032)
10.1.4. Rest of North America
10.1.4.1. Market Revenue and Forecast, by Solution (2020-2032)
10.1.4.2. Market Revenue and Forecast, by Service (2020-2032)
10.2. Europe
10.2.1. Market Revenue and Forecast, by Solution (2020-2032)
10.2.2. Market Revenue and Forecast, by Service (2020-2032)
10.2.3. UK
10.2.3.1. Market Revenue and Forecast, by Solution (2020-2032)
10.2.3.2. Market Revenue and Forecast, by Service (2020-2032)
10.2.4. Germany
10.2.4.1. Market Revenue and Forecast, by Solution (2020-2032)
10.2.4.2. Market Revenue and Forecast, by Service (2020-2032)
10.2.5. France
10.2.5.1. Market Revenue and Forecast, by Solution (2020-2032)
10.2.5.2. Market Revenue and Forecast, by Service (2020-2032)
10.2.6. Rest of Europe
10.2.6.1. Market Revenue and Forecast, by Solution (2020-2032)
10.2.6.2. Market Revenue and Forecast, by Service (2020-2032)
10.3. APAC
10.3.1. Market Revenue and Forecast, by Solution (2020-2032)
10.3.2. Market Revenue and Forecast, by Service (2020-2032)
10.3.3. India
10.3.3.1. Market Revenue and Forecast, by Solution (2020-2032)
10.3.3.2. Market Revenue and Forecast, by Service (2020-2032)
10.3.4. China
10.3.4.1. Market Revenue and Forecast, by Solution (2020-2032)
10.3.4.2. Market Revenue and Forecast, by Service (2020-2032)
10.3.5. Japan
10.3.5.1. Market Revenue and Forecast, by Solution (2020-2032)
10.3.5.2. Market Revenue and Forecast, by Service (2020-2032)
10.3.6. Rest of APAC
10.3.6.1. Market Revenue and Forecast, by Solution (2020-2032)
10.3.6.2. Market Revenue and Forecast, by Service (2020-2032)
10.4. MEA
10.4.1. Market Revenue and Forecast, by Solution (2020-2032)
10.4.2. Market Revenue and Forecast, by Service (2020-2032)
10.4.3. GCC
10.4.3.1. Market Revenue and Forecast, by Solution (2020-2032)
10.4.3.2. Market Revenue and Forecast, by Service (2020-2032)
10.4.4. North Africa
10.4.4.1. Market Revenue and Forecast, by Solution (2020-2032)
10.4.4.2. Market Revenue and Forecast, by Service (2020-2032)
10.4.5. South Africa
10.4.5.1. Market Revenue and Forecast, by Solution (2020-2032)
10.4.5.2. Market Revenue and Forecast, by Service (2020-2032)
10.4.6. Rest of MEA
10.4.6.1. Market Revenue and Forecast, by Solution (2020-2032)
10.4.6.2. Market Revenue and Forecast, by Service (2020-2032)
10.5. Latin America
10.5.1. Market Revenue and Forecast, by Solution (2020-2032)
10.5.2. Market Revenue and Forecast, by Service (2020-2032)
10.5.3. Brazil
10.5.3.1. Market Revenue and Forecast, by Solution (2020-2032)
10.5.3.2. Market Revenue and Forecast, by Service (2020-2032)
10.5.4. Rest of LATAM
10.5.4.1. Market Revenue and Forecast, by Solution (2020-2032)
10.5.4.2. Market Revenue and Forecast, by Service (2020-2032)
Chapter 11. Company Profiles
11.1. Accenture PLC
11.1.1. Company Overview
11.1.2. Product Offerings
11.1.3. Financial Performance
11.1.4. Recent Initiatives
11.2. Alstom, SA
11.2.1. Company Overview
11.2.2. Product Offerings
11.2.3. Financial Performance
11.2.4. Recent Initiatives
11.3. Cisco System, Inc.
11.3.1. Company Overview
11.3.2. Product Offerings
11.3.3. Financial Performance
11.3.4. Recent Initiatives
11.4. Cubic Corporation
11.4.1. Company Overview
11.4.2. Product Offerings
11.4.3. Financial Performance
11.4.4. LTE Scientific
11.5. General Electric Company (GE)
11.5.1. Company Overview
11.5.2. Product Offerings
11.5.3. Financial Performance
11.5.4. Recent Initiatives
11.6. Indra Sistema S.A.
11.6.1. Company Overview
11.6.2. Product Offerings
11.6.3. Financial Performance
11.6.4. Recent Initiatives
11.7. International Business Machines Corporation
11.7.1. Company Overview
11.7.2. Product Offerings
11.7.3. Financial Performance
11.7.4. Recent Initiatives
11.8. Kapsch
11.8.1. Company Overview
11.8.2. Product Offerings
11.8.3. Financial Performance
11.8.4. Recent Initiatives
11.9. LG CNS Corporation
11.9.1. Company Overview
11.9.2. Product Offerings
11.9.3. Financial Performance
11.9.4. Recent Initiatives
11.10. Xerox Holdings Corporation
11.10.1. Company Overview
11.10.2. Product Offerings
11.10.3. Financial Performance
11.10.4. Recent Initiatives
Chapter 12. Research Methodology
12.1. Primary Research
12.2. Secondary Research
12.3. Assumptions
Chapter 13. Appendix
13.1. About Us
13.2. Glossary of Terms
 Cross-segment Market Size and Analysis for
Mentioned Segments
Additional Company Profiles (Upto 5 With No Cost)
Additional Countries (Apart From Mentioned Countries)
Country/Region-specific Report
Go To Market Strategy
Region Specific Market DynamicsRegion Level Market Share Import Export AnalysisProduction AnalysisOthers
Cross-segment Market Size and Analysis for
Mentioned Segments
Additional Company Profiles (Upto 5 With No Cost)
Additional Countries (Apart From Mentioned Countries)
Country/Region-specific Report
Go To Market Strategy
Region Specific Market DynamicsRegion Level Market Share Import Export AnalysisProduction AnalysisOthers