Spinal Muscular Atrophy Treatment Market Size, Share | Report 2023-2032
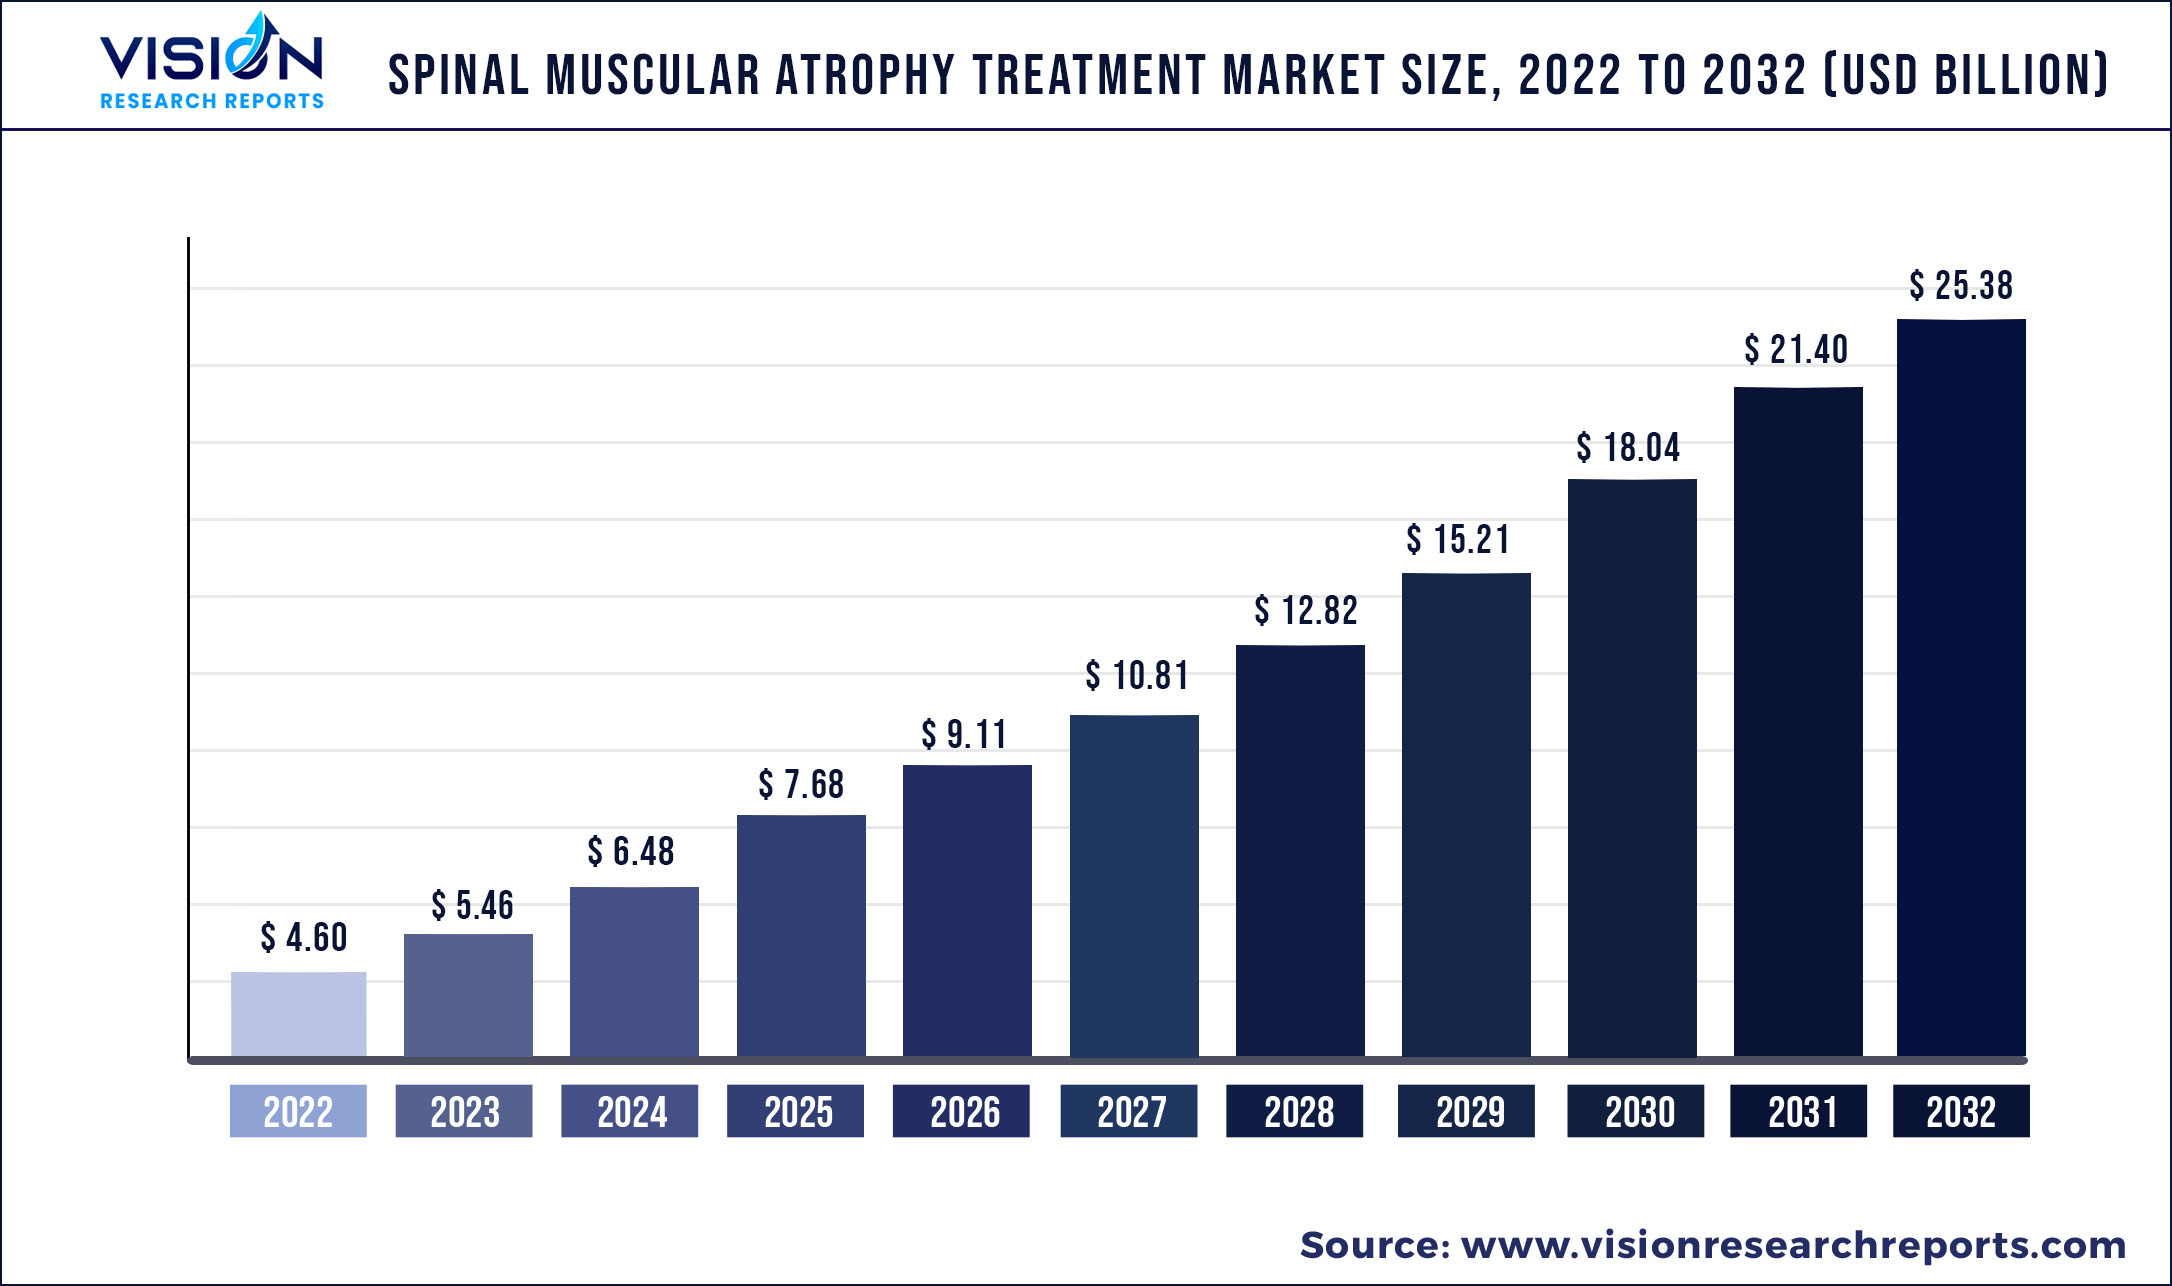
The global spinal muscular atrophy treatment market was valued at USD 4.60 billion in 2022 and it is predicted to surpass around USD 25.38 billion by 2032 with a CAGR of 18.62% from 2023 to 2032.
Key Pointers
| Report Coverage | Details |
| Market Size in 2022 | USD 4.60 billion |
| Revenue Forecast by 2032 | USD 25.38 billion |
| Growth rate from 2023 to 2032 | CAGR of 18.62% |
| Base Year | 2022 |
| Forecast Period | 2023 to 2032 |
| Regions Covered | North America, Europe, Asia Pacific, Latin America, Middle East & Africa |
| Companies Covered | Biogen; Novartis AG; Ionis Pharmaceuticals Inc.; Biohaven Pharmaceuticals; F. Hoffmann-La Roche Ltd; Cytokinetics; Scholar Rock, Inc.; PTC Therapeutics; NMD Pharma A/S |
The market is primarily driven by rising incidence of spinal muscular atrophy (SMA). According to the National Organization for Rare Disorders (NORD), spinal muscular atrophy (SMA) affects almost 1 in 10,000 people globally. Thus, rising prevalence of SMA and the approval for gene therapy for SMA treatment is one of the major factors in generating revenue for the market. A multidisciplinary standard therapy approach is used for the treatment of patients with SMA which includes, symptomatic therapy such as physical, occupational, and respiratory function monitoring and disease-modifying therapies. The U.S. Food and Drug Administration (FDA) approved world’s first disease modifying therapy, Spinraza. It has shown positive promising results with improved survival rates in patients. Thus, approval of new disease-modifying therapies is anticipated to drive market growth.
Moreover, rising awareness regarding novel therapies is a key factor that contributes largely to the market growth. For instance, in May 2021, Cure SMA organized the 2022 Annual SMA Conference in Anaheim to reunite the SMA community including researchers, patients and their caregivers, and clinicians. Under this conference, a wide variety of activities were performed including education workshops, keynote sessions for researchers, and social activities. Such conferences provide opportunities for manufacturers to connect and interact with SMA people and understand their unmet treatment needs.
The development of new products is challenging task for new players due to low success rate in clinical trials. According to the National Library of Medicine, the clinical trial success rate is 10% while developing new SMA drugs. For instance, in December 2020, F. Hoffmann-La Roche Ltd stopped clinical development program for Olesoxim, as the product failed to provide benefits to type 2 & 3 SMA patients. Thus, low success rate in clinical trials create uncertainty among new players to invest in new drug development, thereby, restraining market growth.
Spinal Muscular Atrophy Treatment Market Segmentations:
| By Type | By Treatment | By Drug | By Route of Administration |
|
Type 1 Type 2 Type 3 Type 4 |
Gene Therapy Drug |
Spinraza Zolgensma (AVXS-101) Evrysdi Others |
Oral Injection |
Chapter 1. Introduction
1.1. Research Objective
1.2. Scope of the Study
1.3. Definition
Chapter 2. Research Methodology
2.1. Research Approach
2.2. Data Sources
2.3. Assumptions & Limitations
Chapter 3. Executive Summary
3.1. Market Snapshot
Chapter 4. Market Variables and Scope
4.1. Introduction
4.2. Market Classification and Scope
4.3. Industry Value Chain Analysis
4.3.1. Raw Material Procurement Analysis
4.3.2. Sales and Distribution Channel Analysis
4.3.3. Downstream Buyer Analysis
Chapter 5. COVID 19 Impact on Spinal Muscular Atrophy Treatment Market
5.1. COVID-19 Landscape: Spinal Muscular Atrophy Treatment Industry Impact
5.2. COVID 19 - Impact Assessment for the Industry
5.3. COVID 19 Impact: Global Major Government Policy
5.4. Market Trends and Opportunities in the COVID-19 Landscape
Chapter 6. Market Dynamics Analysis and Trends
6.1. Market Dynamics
6.1.1. Market Drivers
6.1.2. Market Restraints
6.1.3. Market Opportunities
6.2. Porter’s Five Forces Analysis
6.2.1. Bargaining power of suppliers
6.2.2. Bargaining power of buyers
6.2.3. Threat of substitute
6.2.4. Threat of new entrants
6.2.5. Degree of competition
Chapter 7. Competitive Landscape
7.1.1. Company Market Share/Positioning Analysis
7.1.2. Key Strategies Adopted by Players
7.1.3. Vendor Landscape
7.1.3.1. List of Suppliers
7.1.3.2. List of Buyers
Chapter 8. Global Spinal Muscular Atrophy Treatment Market, By Type
8.1. Spinal Muscular Atrophy Treatment Market, by Type, 2023-2032
8.1.1. Type 1
8.1.1.1. Market Revenue and Forecast (2019-2032)
8.1.2. Type 2
8.1.2.1. Market Revenue and Forecast (2019-2032)
8.1.3. Type 3
8.1.3.1. Market Revenue and Forecast (2019-2032)
8.1.4. Type 4
8.1.4.1. Market Revenue and Forecast (2019-2032)
Chapter 9. Global Spinal Muscular Atrophy Treatment Market, By Treatment
9.1. Spinal Muscular Atrophy Treatment Market, by Treatment, 2023-2032
9.1.1. Gene Therapy
9.1.1.1. Market Revenue and Forecast (2019-2032)
9.1.2. Drug
9.1.2.1. Market Revenue and Forecast (2019-2032)
Chapter 10. Global Spinal Muscular Atrophy Treatment Market, By Drug
10.1. Spinal Muscular Atrophy Treatment Market, by Drug, 2023-2032
10.1.1. Spinraza
10.1.1.1. Market Revenue and Forecast (2019-2032)
10.1.2. Zolgensma (AVXS-101)
10.1.2.1. Market Revenue and Forecast (2019-2032)
10.1.3. Evrysdi
10.1.3.1. Market Revenue and Forecast (2019-2032)
10.1.4. Others
10.1.4.1. Market Revenue and Forecast (2019-2032)
Chapter 11. Global Spinal Muscular Atrophy Treatment Market, By Route of Administration
11.1. Spinal Muscular Atrophy Treatment Market, by Route of Administration, 2023-2032
11.1.1. Oral
11.1.1.1. Market Revenue and Forecast (2019-2032)
11.1.2. Injection
11.1.2.1. Market Revenue and Forecast (2019-2032)
Chapter 12. Global Spinal Muscular Atrophy Treatment Market, Regional Estimates and Trend Forecast
12.1. North America
12.1.1. Market Revenue and Forecast, by Type (2019-2032)
12.1.2. Market Revenue and Forecast, by Treatment (2019-2032)
12.1.3. Market Revenue and Forecast, by Drug (2019-2032)
12.1.4. Market Revenue and Forecast, by Route of Administration (2019-2032)
12.1.5. U.S.
12.1.5.1. Market Revenue and Forecast, by Type (2019-2032)
12.1.5.2. Market Revenue and Forecast, by Treatment (2019-2032)
12.1.5.3. Market Revenue and Forecast, by Drug (2019-2032)
12.1.5.4. Market Revenue and Forecast, by Route of Administration (2019-2032)
12.1.6. Rest of North America
12.1.6.1. Market Revenue and Forecast, by Type (2019-2032)
12.1.6.2. Market Revenue and Forecast, by Treatment (2019-2032)
12.1.6.3. Market Revenue and Forecast, by Drug (2019-2032)
12.1.6.4. Market Revenue and Forecast, by Route of Administration (2019-2032)
12.2. Europe
12.2.1. Market Revenue and Forecast, by Type (2019-2032)
12.2.2. Market Revenue and Forecast, by Treatment (2019-2032)
12.2.3. Market Revenue and Forecast, by Drug (2019-2032)
12.2.4. Market Revenue and Forecast, by Route of Administration (2019-2032)
12.2.5. UK
12.2.5.1. Market Revenue and Forecast, by Type (2019-2032)
12.2.5.2. Market Revenue and Forecast, by Treatment (2019-2032)
12.2.5.3. Market Revenue and Forecast, by Drug (2019-2032)
12.2.5.4. Market Revenue and Forecast, by Route of Administration (2019-2032)
12.2.6. Germany
12.2.6.1. Market Revenue and Forecast, by Type (2019-2032)
12.2.6.2. Market Revenue and Forecast, by Treatment (2019-2032)
12.2.6.3. Market Revenue and Forecast, by Drug (2019-2032)
12.2.6.4. Market Revenue and Forecast, by Route of Administration (2019-2032)
12.2.7. France
12.2.7.1. Market Revenue and Forecast, by Type (2019-2032)
12.2.7.2. Market Revenue and Forecast, by Treatment (2019-2032)
12.2.7.3. Market Revenue and Forecast, by Drug (2019-2032)
12.2.7.4. Market Revenue and Forecast, by Route of Administration (2019-2032)
12.2.8. Rest of Europe
12.2.8.1. Market Revenue and Forecast, by Type (2019-2032)
12.2.8.2. Market Revenue and Forecast, by Treatment (2019-2032)
12.2.8.3. Market Revenue and Forecast, by Drug (2019-2032)
12.2.8.4. Market Revenue and Forecast, by Route of Administration (2019-2032)
12.3. APAC
12.3.1. Market Revenue and Forecast, by Type (2019-2032)
12.3.2. Market Revenue and Forecast, by Treatment (2019-2032)
12.3.3. Market Revenue and Forecast, by Drug (2019-2032)
12.3.4. Market Revenue and Forecast, by Route of Administration (2019-2032)
12.3.5. India
12.3.5.1. Market Revenue and Forecast, by Type (2019-2032)
12.3.5.2. Market Revenue and Forecast, by Treatment (2019-2032)
12.3.5.3. Market Revenue and Forecast, by Drug (2019-2032)
12.3.5.4. Market Revenue and Forecast, by Route of Administration (2019-2032)
12.3.6. China
12.3.6.1. Market Revenue and Forecast, by Type (2019-2032)
12.3.6.2. Market Revenue and Forecast, by Treatment (2019-2032)
12.3.6.3. Market Revenue and Forecast, by Drug (2019-2032)
12.3.6.4. Market Revenue and Forecast, by Route of Administration (2019-2032)
12.3.7. Japan
12.3.7.1. Market Revenue and Forecast, by Type (2019-2032)
12.3.7.2. Market Revenue and Forecast, by Treatment (2019-2032)
12.3.7.3. Market Revenue and Forecast, by Drug (2019-2032)
12.3.7.4. Market Revenue and Forecast, by Route of Administration (2019-2032)
12.3.8. Rest of APAC
12.3.8.1. Market Revenue and Forecast, by Type (2019-2032)
12.3.8.2. Market Revenue and Forecast, by Treatment (2019-2032)
12.3.8.3. Market Revenue and Forecast, by Drug (2019-2032)
12.3.8.4. Market Revenue and Forecast, by Route of Administration (2019-2032)
12.4. MEA
12.4.1. Market Revenue and Forecast, by Type (2019-2032)
12.4.2. Market Revenue and Forecast, by Treatment (2019-2032)
12.4.3. Market Revenue and Forecast, by Drug (2019-2032)
12.4.4. Market Revenue and Forecast, by Route of Administration (2019-2032)
12.4.5. GCC
12.4.5.1. Market Revenue and Forecast, by Type (2019-2032)
12.4.5.2. Market Revenue and Forecast, by Treatment (2019-2032)
12.4.5.3. Market Revenue and Forecast, by Drug (2019-2032)
12.4.5.4. Market Revenue and Forecast, by Route of Administration (2019-2032)
12.4.6. North Africa
12.4.6.1. Market Revenue and Forecast, by Type (2019-2032)
12.4.6.2. Market Revenue and Forecast, by Treatment (2019-2032)
12.4.6.3. Market Revenue and Forecast, by Drug (2019-2032)
12.4.6.4. Market Revenue and Forecast, by Route of Administration (2019-2032)
12.4.7. South Africa
12.4.7.1. Market Revenue and Forecast, by Type (2019-2032)
12.4.7.2. Market Revenue and Forecast, by Treatment (2019-2032)
12.4.7.3. Market Revenue and Forecast, by Drug (2019-2032)
12.4.7.4. Market Revenue and Forecast, by Route of Administration (2019-2032)
12.4.8. Rest of MEA
12.4.8.1. Market Revenue and Forecast, by Type (2019-2032)
12.4.8.2. Market Revenue and Forecast, by Treatment (2019-2032)
12.4.8.3. Market Revenue and Forecast, by Drug (2019-2032)
12.4.8.4. Market Revenue and Forecast, by Route of Administration (2019-2032)
12.5. Latin America
12.5.1. Market Revenue and Forecast, by Type (2019-2032)
12.5.2. Market Revenue and Forecast, by Treatment (2019-2032)
12.5.3. Market Revenue and Forecast, by Drug (2019-2032)
12.5.4. Market Revenue and Forecast, by Route of Administration (2019-2032)
12.5.5. Brazil
12.5.5.1. Market Revenue and Forecast, by Type (2019-2032)
12.5.5.2. Market Revenue and Forecast, by Treatment (2019-2032)
12.5.5.3. Market Revenue and Forecast, by Drug (2019-2032)
12.5.5.4. Market Revenue and Forecast, by Route of Administration (2019-2032)
12.5.6. Rest of LATAM
12.5.6.1. Market Revenue and Forecast, by Type (2019-2032)
12.5.6.2. Market Revenue and Forecast, by Treatment (2019-2032)
12.5.6.3. Market Revenue and Forecast, by Drug (2019-2032)
12.5.6.4. Market Revenue and Forecast, by Route of Administration (2019-2032)
Chapter 13. Company Profiles
13.1. Biogen
13.1.1. Company Overview
13.1.2. Product Offerings
13.1.3. Financial Performance
13.1.4. Recent Initiatives
13.2. Novartis AG
13.2.1. Company Overview
13.2.2. Product Offerings
13.2.3. Financial Performance
13.2.4. Recent Initiatives
13.3. Ionis Pharmaceuticals Inc.
13.3.1. Company Overview
13.3.2. Product Offerings
13.3.3. Financial Performance
13.3.4. Recent Initiatives
13.4. Biohaven Pharmaceuticals
13.4.1. Company Overview
13.4.2. Product Offerings
13.4.3. Financial Performance
13.4.4. Recent Initiatives
13.5. F. Hoffmann-La Roche Ltd
13.5.1. Company Overview
13.5.2. Product Offerings
13.5.3. Financial Performance
13.5.4. Recent Initiatives
13.6. Cytokinetics
13.6.1. Company Overview
13.6.2. Product Offerings
13.6.3. Financial Performance
13.6.4. Recent Initiatives
13.7. Scholar Rock, Inc.
13.7.1. Company Overview
13.7.2. Product Offerings
13.7.3. Financial Performance
13.7.4. Recent Initiatives
13.8. PTC Therapeutics
13.8.1. Company Overview
13.8.2. Product Offerings
13.8.3. Financial Performance
13.8.4. Recent Initiatives
13.9. NMD Pharma A/S
13.9.1. Company Overview
13.9.2. Product Offerings
13.9.3. Financial Performance
13.9.4. Recent Initiatives
Chapter 14. Research Methodology
14.1. Primary Research
14.2. Secondary Research
14.3. Assumptions
Chapter 15. Appendix
15.1. About Us
15.2. Glossary of Terms
 Cross-segment Market Size and Analysis for
Mentioned Segments
Additional Company Profiles (Upto 5 With No Cost)
Additional Countries (Apart From Mentioned Countries)
Country/Region-specific Report
Go To Market Strategy
Region Specific Market DynamicsRegion Level Market Share Import Export AnalysisProduction AnalysisOthers
Cross-segment Market Size and Analysis for
Mentioned Segments
Additional Company Profiles (Upto 5 With No Cost)
Additional Countries (Apart From Mentioned Countries)
Country/Region-specific Report
Go To Market Strategy
Region Specific Market DynamicsRegion Level Market Share Import Export AnalysisProduction AnalysisOthers