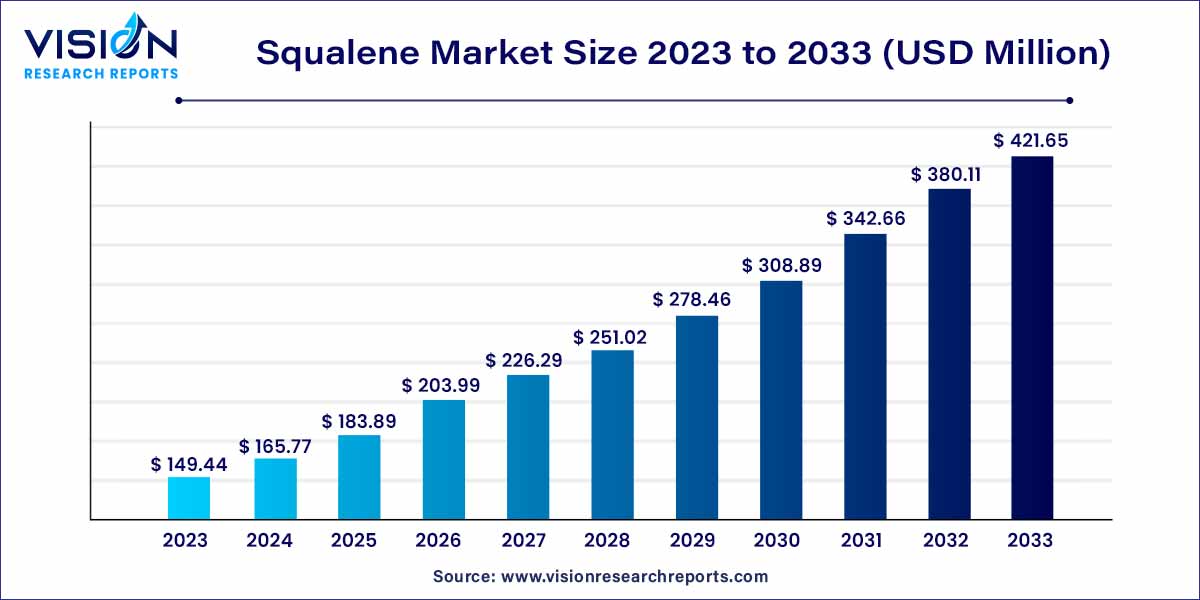
The global squalene market size was estimated at around USD 149.44 million in 2023 and it is projected to hit around USD 421.65 million by 2033, growing at a CAGR of 10.93% from 2024 to 2033.

The squalene market presents a compelling landscape within the global industry, characterized by its diverse applications and growing significance. Squalene, a natural organic compound sourced from various origins such as shark liver oil, olive oil, and amaranth seed, has witnessed increased attention due to its unique properties and versatile uses.
The growth trajectory of the squalene market is underpinned by several key factors that collectively contribute to its expanding prominence. Firstly, the increasing shift towards sustainable and cruelty-free practices has driven a notable transition in sourcing, with olive oil and amaranth seed emerging as eco-friendly alternatives to traditional shark liver oil. This shift not only addresses environmental concerns but also aligns with changing consumer preferences. Secondly, the widespread recognition of squalene's moisturizing and antioxidant properties has fueled its demand in the skincare, cosmetics, pharmaceutical, and nutraceutical industries. As consumers increasingly prioritize products with natural and beneficial ingredients, the market for squalene experiences a corresponding surge. Additionally, technological advancements in extraction methods have enhanced the efficiency of production, contributing to a more robust and accessible supply chain. The convergence of these factors positions the squalene market on a trajectory of sustained growth, with further potential driven by emerging trends such as the demand for plant-based alternatives and a continued emphasis on sustainable sourcing practices.
| Report Coverage | Details |
| Growth Rate from 2024 to 2033 | CAGR of 10.93% |
| Market Revenue by 2033 | USD 421.65 million |
| Revenue Share of Europe in 2023 | 33% |
| Base Year | 2023 |
| Forecast Period | 2024 to 2033 |
| Market Analysis (Terms Used) | Value (US$ Million/Billion) or (Volume/Units) |
Rising Demand for Natural Ingredients:
The squalene market is propelled by an escalating demand for natural and organic ingredients in various industries. As consumers become increasingly conscious of the products they use, the natural origin of squalene positions it as a preferred choice in sectors such as skincare, cosmetics, and pharmaceuticals.
Shift towards Sustainable Sourcing:
The market witnesses a significant driver in the form of a paradigm shift towards sustainable and eco-friendly sourcing practices. Alternatives like olive oil and amaranth seed, offering cruelty-free options, are gaining traction, addressing environmental concerns and aligning with ethical consumer preferences.
Competition from Synthetic Alternatives:
The market faces competition from synthetic alternatives, which, in some applications, may offer cost advantages and consistent quality. As technological advancements progress, the appeal of these alternatives may impact the market share of natural squalene.
Limited Extraction Efficiency from Plant Sources:
Extracting squalene from plant sources can present challenges in terms of efficiency and cost-effectiveness. Innovations in extraction technologies are essential to overcome these limitations and ensure a competitive edge in the market.
Expansion of Applications in the Cosmetic Industry:
The cosmetic industry offers a vast opportunity for the squalene market. With a growing emphasis on natural and sustainable ingredients in beauty products, there is potential for increased incorporation of squalene in a wide range of cosmetic formulations.
Health and Wellness Products:
The rising awareness of the health benefits associated with squalene opens avenues for its inclusion in health and wellness products. Nutraceutical supplements and functional foods can leverage the compound's antioxidant properties, creating opportunities for market expansion.
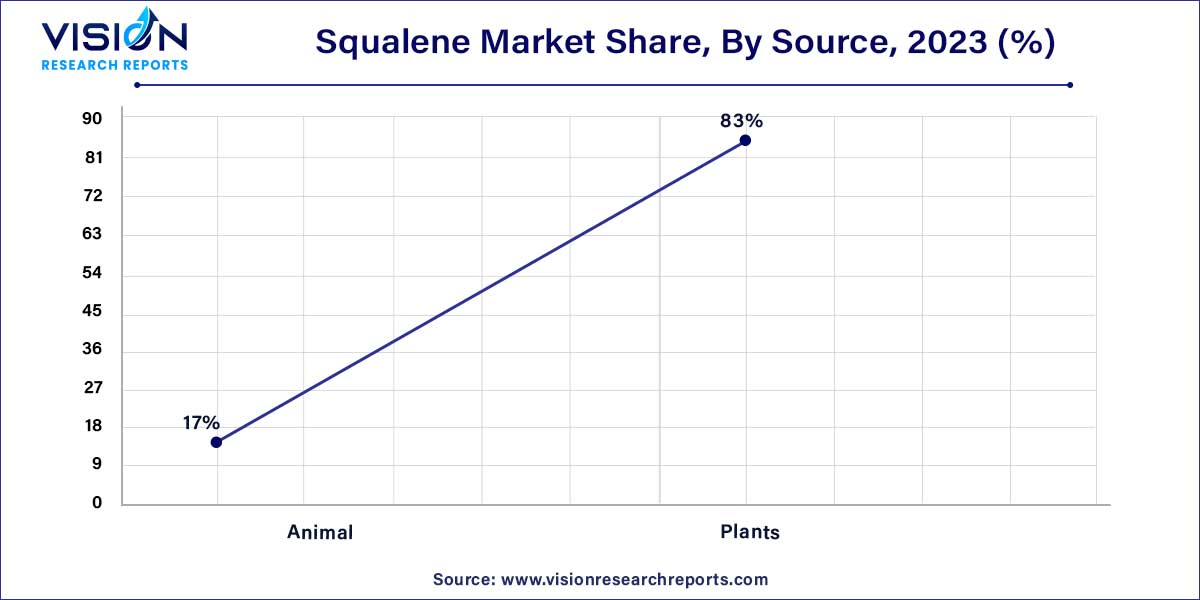
The plant segment dominated the market with a revenue share of 83% in 2023. This is attributed to the declining population of sharks, increasing awareness among people regarding animal welfare and protection, and regulatory frameworks imposed by various governments for the protection of marine animals.
Plants are alternatives to sharks for extraction of the product as they can be grown and harvested sustainably. For example, the monkey Jack, or Artocarpus lakucha is an Asian plant that produces 10%-20% of its product, equivalent to its dry weight capacity. The product can also be extracted from its leaves having high purity.

As per the International Olive Council (IOC) report, world olive oil production may reach 3,214, 500 tons, 2.9% more than the previous crop year due to high cultivation of olive trees in this region. Naturally, squalene is majorly found in olives, amaranth, and rice bran. The highest amounts of product are found in olives depending upon cultivator, extraction technology, and level of oil refining. Extra virgin unrefined olive oil contains higher concentrations of the product as compared to refined olive oils.
Shark squalene is obtained from liver oil of freshly preserved livers of numerous species of deeper water sharks as they have higher product content. It requires around 3000 sharks to extract just one ton of product, hence excessive catching of these animals led to a dramatic decline in population of certain species as around 2.7 million deep-sea sharks are poached every year due to wide application in the cosmetic industry.
Deep-sea shark liver oil has been a primary and highest concentration of naturally occurring source of product, owing to its properties such as healing wounds and fighting infections as it stimulates a key innate immune cell in wound healing and tissue repairing.
To protect these sharks and shift manufacturers to use plant-based product sources, several laws were imposed. In India, extraction, possession, or trade-in 10 elasmobranchs is completely prohibited as they are listed in India's Wildlife (Protection) Act, 1972.
The personal care and cosmetics segment led the market with a revenue share of 71% in 2023. The growth in this segment can be attributed to the usage of squalene in a variety of cosmetic products meant for skin care and hair care.
Squalene is used in a variety of cosmetic products meant for sun care, skincare, and hair care. Approximately 70-80% of the total product produced globally is consumed by the cosmetics industry. Multinational cosmetic companies such as L’Oréal, Unilever, and St. Botanica have already started to shift from shark liver oil-based to plant-based products for use in their personal care products and cosmetics owing to its exceptional properties, along with less extinction risk posed by them to sharks.
In 2021, L’Oréal acquired U.S.-based ‘Youth to the people’, which has branches in Canada, the U.S., Australia, and some European countries. The brand offers skincare products developed from plant extracts. This acquisition helped L’Oréal use plant-based products in its cosmetic products rather than shark-based.
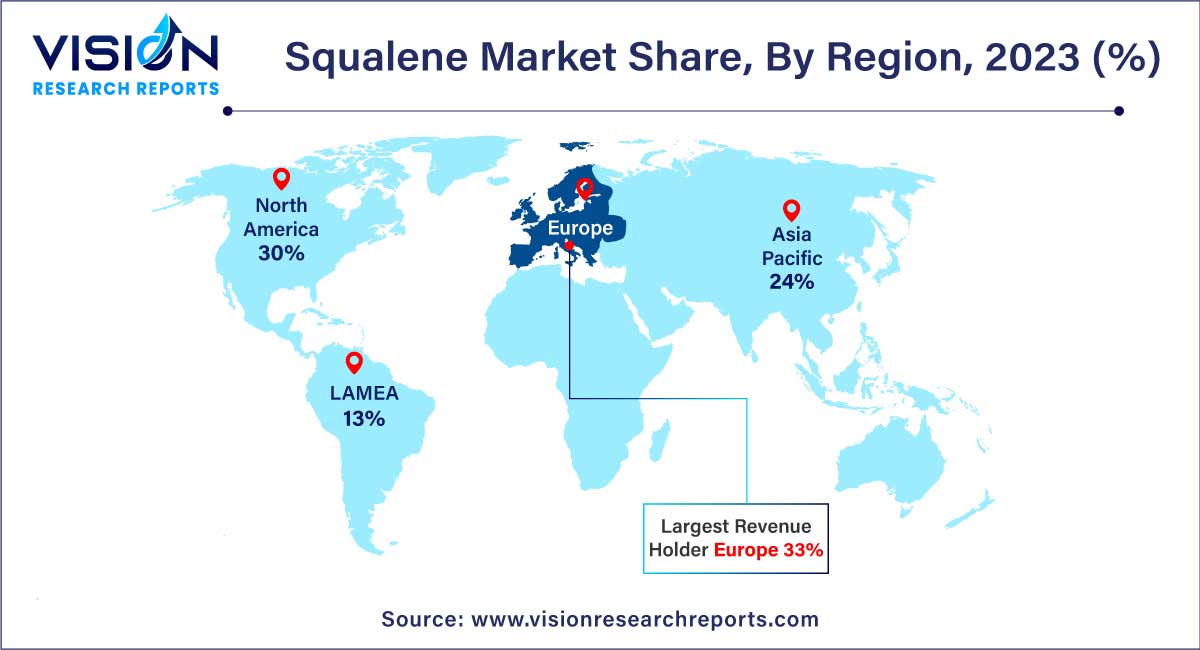
Europe dominated the market with a revenue share of 33% in 2023, followed by Asia Pacific region. This is attributed to large-scale production of olive oil, which is a major plant-based source of product, and increased demand for the product from major economies such as Germany, France, UK, Italy, and Spain, in the region.

The growth of the market in Asia Pacific can be attributed to easy availability of raw materials, cheap labor, low costs of setting up manufacturing units, and expansion of industries such as personal care products and cosmetics, pharmaceuticals, nutraceuticals, and food & beverages in regions that utilize squalene.
By Source
By End-use
By Regional
Chapter 1. Introduction
1.1. Research Objective
1.2. Scope of the Study
1.3. Definition
Chapter 2. Research Methodology
2.1. Research Approach
2.2. Data Sources
2.3. Assumptions & Limitations
Chapter 3. Executive Summary
3.1. Market Snapshot
Chapter 4. Market Variables and Scope
4.1. Introduction
4.2. Market Classification and Scope
4.3. Industry Value Chain Analysis
4.3.1. Raw Material Procurement Analysis
4.3.2. Sales and Distribution Channel Analysis
4.3.3. Downstream Buyer Analysis
Chapter 5. COVID 19 Impact on Squalene Market
5.1. COVID-19 Landscape: Squalene Industry Impact
5.2. COVID 19 - Impact Assessment for the Industry
5.3. COVID 19 Impact: Global Major Government Policy
5.4. Market Trends and Opportunities in the COVID-19 Landscape
Chapter 6. Market Dynamics Analysis and Trends
6.1. Market Dynamics
6.1.1. Market Drivers
6.1.2. Market Restraints
6.1.3. Market Opportunities
6.2. Porter’s Five Forces Analysis
6.2.1. Bargaining power of suppliers
6.2.2. Bargaining power of buyers
6.2.3. Threat of substitute
6.2.4. Threat of new entrants
6.2.5. Degree of competition
Chapter 7. Competitive Landscape
7.1.1. Company Market Share/Positioning Analysis
7.1.2. Key Strategies Adopted by Players
7.1.3. Vendor Landscape
7.1.3.1. List of Suppliers
7.1.3.2. List of Buyers
Chapter 8. Global Squalene Market, By Source
8.1. Squalene Market, by Source, 2024-2033
8.1.1. Animal
8.1.1.1. Market Revenue and Forecast (2021-2033)
8.1.2. Plants
8.1.2.1. Market Revenue and Forecast (2021-2033)
Chapter 9. Global Squalene Market, By End-use
9.1. Squalene Market, by End-use, 2024-2033
9.1.1. Pharmaceuticals
9.1.1.1. Market Revenue and Forecast (2021-2033)
9.1.2. Personal Care & Cosmetics
9.1.2.1. Market Revenue and Forecast (2021-2033)
9.1.3. Nutraceuticals
9.1.3.1. Market Revenue and Forecast (2021-2033)
9.1.4. Food & Beverages
9.1.4.1. Market Revenue and Forecast (2021-2033)
9.1.5. Others
9.1.5.1. Market Revenue and Forecast (2021-2033)
Chapter 10. Global Squalene Market, Regional Estimates and Trend Forecast
10.1. North America
10.1.1. Market Revenue and Forecast, by Source (2021-2033)
10.1.2. Market Revenue and Forecast, by End-use (2021-2033)
10.1.3. U.S.
10.1.3.1. Market Revenue and Forecast, by Source (2021-2033)
10.1.3.2. Market Revenue and Forecast, by End-use (2021-2033)
10.1.4. Rest of North America
10.1.4.1. Market Revenue and Forecast, by Source (2021-2033)
10.1.4.2. Market Revenue and Forecast, by End-use (2021-2033)
10.2. Europe
10.2.1. Market Revenue and Forecast, by Source (2021-2033)
10.2.2. Market Revenue and Forecast, by End-use (2021-2033)
10.2.3. UK
10.2.3.1. Market Revenue and Forecast, by Source (2021-2033)
10.2.3.2. Market Revenue and Forecast, by End-use (2021-2033)
10.2.4. Germany
10.2.4.1. Market Revenue and Forecast, by Source (2021-2033)
10.2.4.2. Market Revenue and Forecast, by End-use (2021-2033)
10.2.5. France
10.2.5.1. Market Revenue and Forecast, by Source (2021-2033)
10.2.5.2. Market Revenue and Forecast, by End-use (2021-2033)
10.2.6. Rest of Europe
10.2.6.1. Market Revenue and Forecast, by Source (2021-2033)
10.2.6.2. Market Revenue and Forecast, by End-use (2021-2033)
10.3. APAC
10.3.1. Market Revenue and Forecast, by Source (2021-2033)
10.3.2. Market Revenue and Forecast, by End-use (2021-2033)
10.3.3. India
10.3.3.1. Market Revenue and Forecast, by Source (2021-2033)
10.3.3.2. Market Revenue and Forecast, by End-use (2021-2033)
10.3.4. China
10.3.4.1. Market Revenue and Forecast, by Source (2021-2033)
10.3.4.2. Market Revenue and Forecast, by End-use (2021-2033)
10.3.5. Japan
10.3.5.1. Market Revenue and Forecast, by Source (2021-2033)
10.3.5.2. Market Revenue and Forecast, by End-use (2021-2033)
10.3.6. Rest of APAC
10.3.6.1. Market Revenue and Forecast, by Source (2021-2033)
10.3.6.2. Market Revenue and Forecast, by End-use (2021-2033)
10.4. MEA
10.4.1. Market Revenue and Forecast, by Source (2021-2033)
10.4.2. Market Revenue and Forecast, by End-use (2021-2033)
10.4.3. GCC
10.4.3.1. Market Revenue and Forecast, by Source (2021-2033)
10.4.3.2. Market Revenue and Forecast, by End-use (2021-2033)
10.4.4. North Africa
10.4.4.1. Market Revenue and Forecast, by Source (2021-2033)
10.4.4.2. Market Revenue and Forecast, by End-use (2021-2033)
10.4.5. South Africa
10.4.5.1. Market Revenue and Forecast, by Source (2021-2033)
10.4.5.2. Market Revenue and Forecast, by End-use (2021-2033)
10.4.6. Rest of MEA
10.4.6.1. Market Revenue and Forecast, by Source (2021-2033)
10.4.6.2. Market Revenue and Forecast, by End-use (2021-2033)
10.5. Latin America
10.5.1. Market Revenue and Forecast, by Source (2021-2033)
10.5.2. Market Revenue and Forecast, by End-use (2021-2033)
10.5.3. Brazil
10.5.3.1. Market Revenue and Forecast, by Source (2021-2033)
10.5.3.2. Market Revenue and Forecast, by End-use (2021-2033)
10.5.4. Rest of LATAM
10.5.4.1. Market Revenue and Forecast, by Source (2021-2033)
10.5.4.2. Market Revenue and Forecast, by End-use (2021-2033)
Chapter 11. Company Profiles
11.1. Amyris, Inc.
11.1.1. Company Overview
11.1.2. Product Offerings
11.1.3. Financial Performance
11.1.4. Recent Initiatives
11.2. Sophim SAS
11.2.1. Company Overview
11.2.2. Product Offerings
11.2.3. Financial Performance
11.2.4. Recent Initiatives
11.3. Henry Lamotte Oils GmbH
11.3.1. Company Overview
11.3.2. Product Offerings
11.3.3. Financial Performance
11.3.4. Recent Initiatives
11.4. efpbiotek
11.4.1. Company Overview
11.4.2. Product Offerings
11.4.3. Financial Performance
11.4.4. LTE Scientific
11.5. Vestan Limited
11.5.1. Company Overview
11.5.2. Product Offerings
11.5.3. Financial Performance
11.5.4. Recent Initiatives
11.6. Kuraray Co., Ltd.
11.6.1. Company Overview
11.6.2. Product Offerings
11.6.3. Financial Performance
11.6.4. Recent Initiatives
11.7. Croda International Plc
11.7.1. Company Overview
11.7.2. Product Offerings
11.7.3. Financial Performance
11.7.4. Recent Initiatives
11.8. AASHA BIOCHEM
11.8.1. Company Overview
11.8.2. Product Offerings
11.8.3. Financial Performance
11.8.4. Recent Initiatives
11.9. Arbee
11.9.1. Company Overview
11.9.2. Product Offerings
11.9.3. Financial Performance
11.9.4. Recent Initiatives
11.10. Oleicfat, s.l.
11.10.1. Company Overview
11.10.2. Product Offerings
11.10.3. Financial Performance
11.10.4. Recent Initiatives
Chapter 12. Research Methodology
12.1. Primary Research
12.2. Secondary Research
12.3. Assumptions
Chapter 13. Appendix
13.1. About Us
13.2. Glossary of Terms
 Cross-segment Market Size and Analysis for
Mentioned Segments
 Additional Company Profiles (Upto 5 With No Cost)
 Additional Countries (Apart From Mentioned Countries)
 Country/Region-specific Report
 Go To Market Strategy
 Region Specific Market Dynamics
 Region Level Market Share
 Import Export Analysis
 Production Analysis
 Others