Supply Chain Analytics Market Size, Share | Report 2023-2032
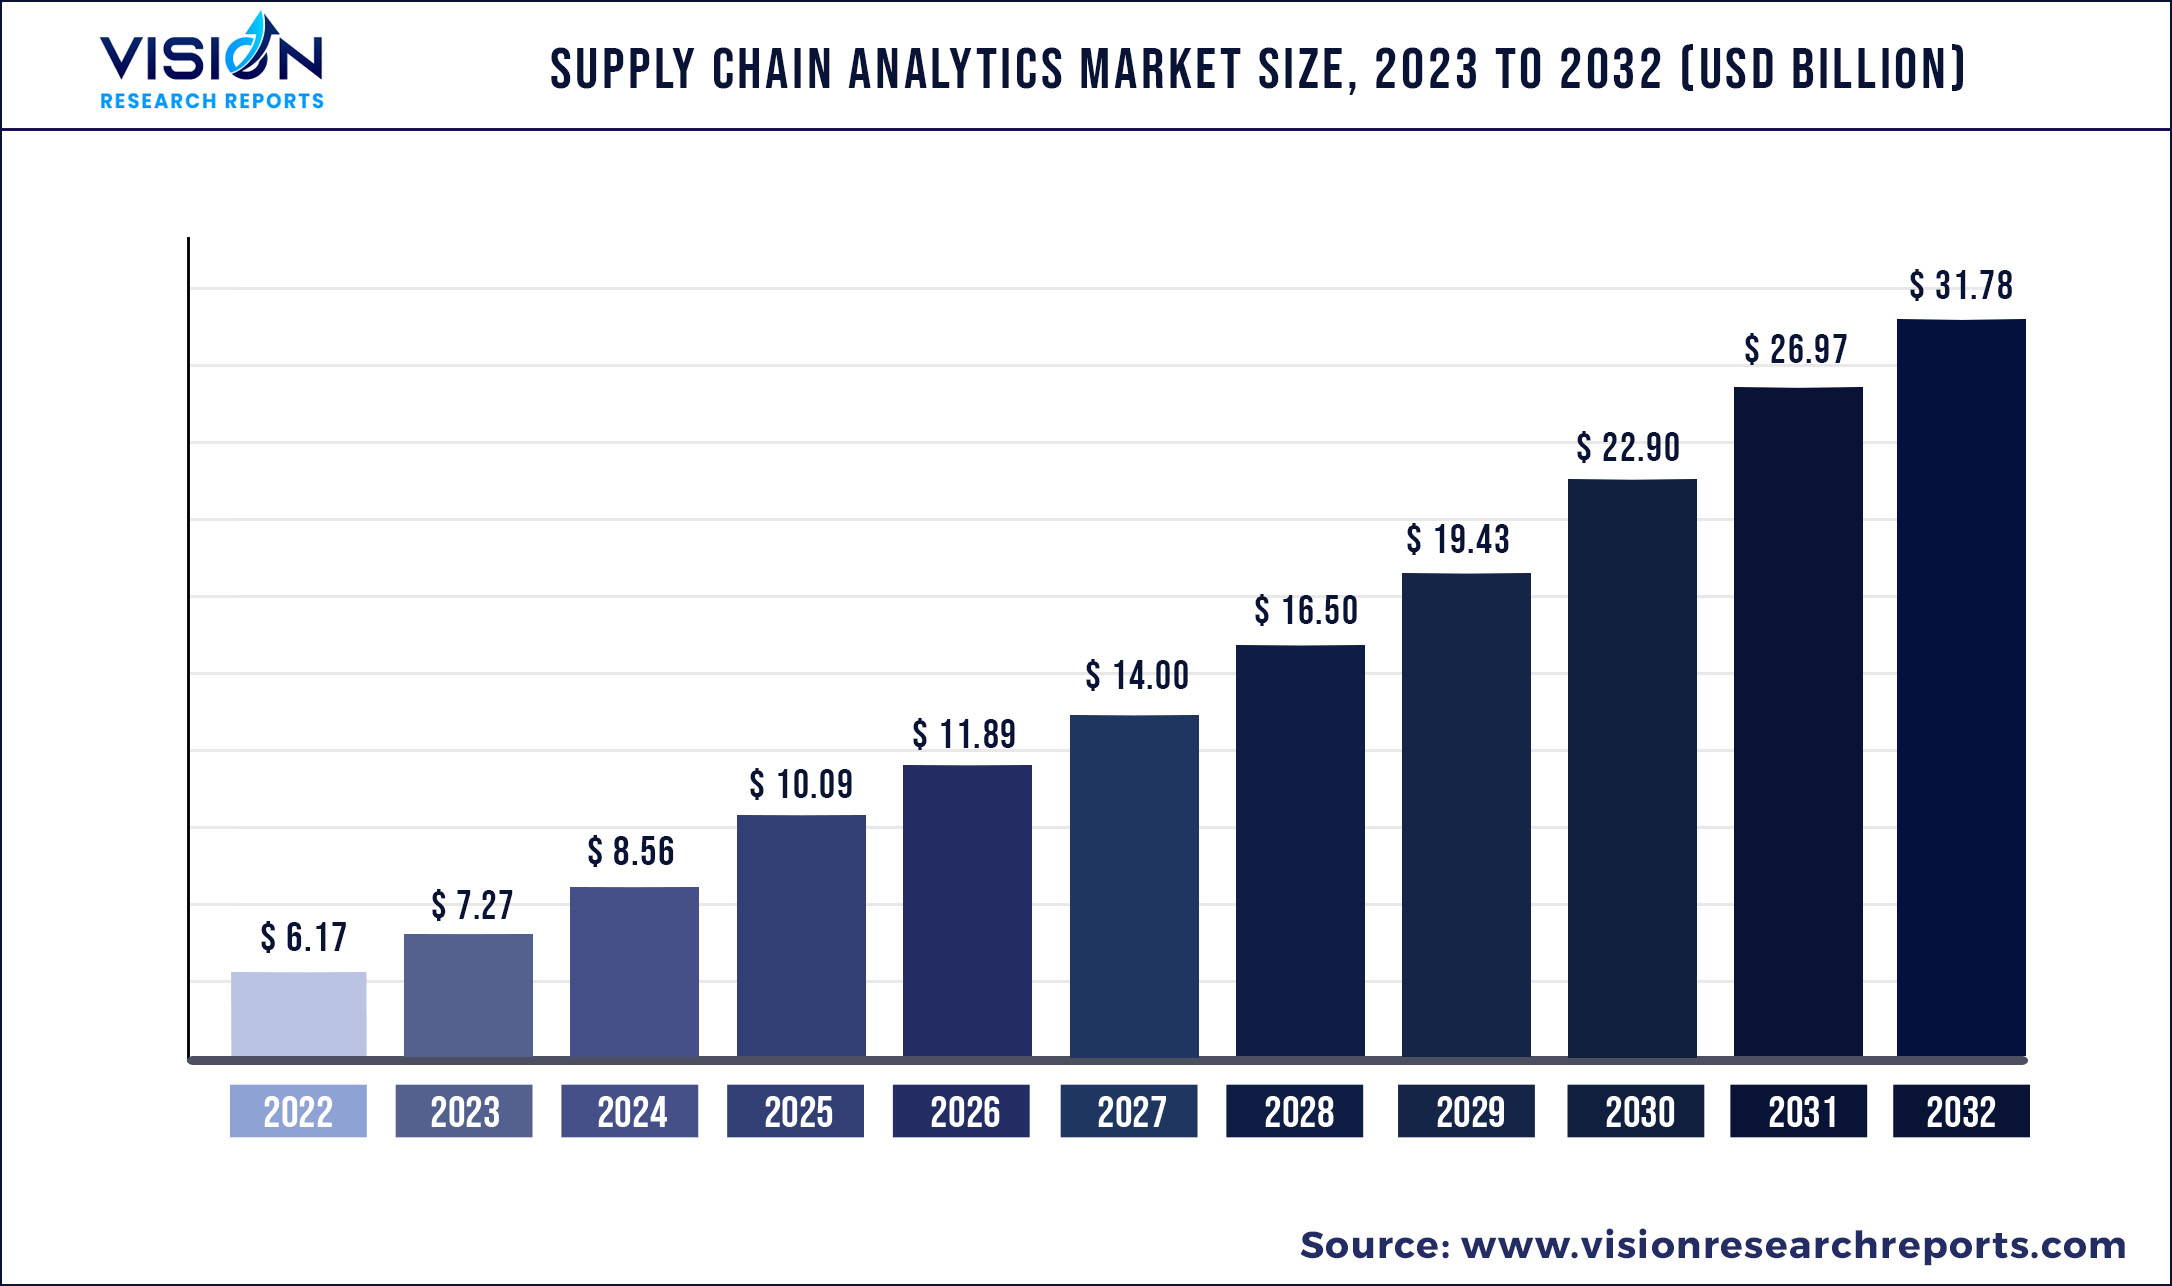
The global supply chain analytics market was valued at USD 6.17 billion in 2022 and it is predicted to surpass around USD 31.78 billion by 2032 with a CAGR of 17.81% from 2023 to 2032.
Key Pointers
| Report Coverage | Details |
| Market Size in 2022 | USD 6.17 billion |
| Revenue Forecast by 2032 | USD 31.78 billion |
| Growth rate from 2023 to 2032 | CAGR of 17.81% |
| Base Year | 2022 |
| Forecast Period | 2023 to 2032 |
| Regions Covered | North America, Europe, Asia Pacific, Latin America, Middle East & Africa |
| Companies Covered | Accenture PLC; Aera Technology; Birst, Inc.; Capgemini SA; Genpact Limited; International Business Machines Corporation; JDA Software Group; Inc., Kinaxis; Lockheed Martin Corporation; Maersk Group; Manhattan Associates, Inc. |
The supply chain analytics market is growing in demand due to increased awareness of the benefits of supply chain analytics (SCA) solutions, such as forecasting accuracy, supply chain optimization, waste minimization, and meaningful synthesis of business data. The increasing number of small & medium enterprises and their increasing expenditure on implementing analytics to hold a strong position in the market and compete against other market players are expected to boost the market growth in the forecast period.
The COVID-19 pandemic has long-term influenced economies worldwide, forcing corporate leaders to act and continue their operations. The epidemic underscored the importance of supply chain solutions for long-term economic viability. During these uncertain times, supply chain analytics-enabled organizations to identify processes that needed immediate attention or products/items that were likely to run out soon, allowing them to manage the demand-supply gap better than before. Furthermore, SCA vendors in the market are working actively and offering solutions to minimize the negative impacts of the pandemic on global supply chains.
Supply chain analytics also helps businesses improve their ability to make decisions regarding technology adoption, organizational infrastructure, strategic relationships, and enterprise resource management. Additionally, SCA solutions encourage strategic decision-making and help businesses strengthen their market position, maximize return on investment, and speed up growth by utilizing the learned insights. Supply chain analytics software enables collaborative engagement and access to different data sources while providing comprehensive insights. These advantages allow an organization to improve its response time by anticipating changes in its production timeline and process.
SCA helps organizations get a broader view of supply chain activities, allowing them to efficiently manage any issues that may impact the profitability or sustainability of the business. Mobile-based solutions help companies track inefficient supplier networks, elevated warehousing costs, and incorrect forecasts, among others. Analytics solutions also play a pivotal role in analyzing business operations that may help improve inventory management and subsequently help reduce associated cost components that may hinder business growth. In recent times, a surge in the adoption of mobile-based solutions is expected to create avenues for industry growth.
Unethical activities and increasing incidences of cyber threats could raise concerns among businesses and may challenge the adoption of SCA solutions to a certain extent. Although the prospects of tech inclusion in supply chain operations look bright, industry incumbents are still concerned about possible security/data breaches. These concerns may be unfavorable for future growth. However, by selling secure products, SCA solution providers have been working tirelessly to reduce the effect of these breaches. These initiatives may help the supply chain analytics market grow at a healthy rate in the coming years.
Supply Chain Analytics Market Segmentations:
| By Solution | By Service | By Deployment | By Enterprise Size | By End-use |
|
Logistics Analytics Manufacturing Analytics Planning & Procurement Sales & Operations Analytics Visualization & Reporting |
Professional Support & Maintenance |
Cloud On-premise |
Large Enterprise Small & Medium Enterprises |
Retail & Consumer Goods Healthcare Manufacturing Transportation Aerospace & Defense High Technology Products Others |
Chapter 1. Introduction
1.1. Research Objective
1.2. Scope of the Study
1.3. Definition
Chapter 2. Research Methodology
2.1. Research Approach
2.2. Data Sources
2.3. Assumptions & Limitations
Chapter 3. Executive Summary
3.1. Market Snapshot
Chapter 4. Market Variables and Scope
4.1. Introduction
4.2. Market Classification and Scope
4.3. Industry Value Chain Analysis
4.3.1. Raw Material Procurement Analysis
4.3.2. Sales and Distribution Channel Analysis
4.3.3. Downstream Buyer Analysis
Chapter 5. COVID 19 Impact on Supply Chain Analytics Market
5.1. COVID-19 Landscape: Supply Chain Analytics Industry Impact
5.2. COVID 19 - Impact Assessment for the Industry
5.3. COVID 19 Impact: Global Major Government Policy
5.4. Market Trends and Opportunities in the COVID-19 Landscape
Chapter 6. Market Dynamics Analysis and Trends
6.1. Market Dynamics
6.1.1. Market Drivers
6.1.2. Market Restraints
6.1.3. Market Opportunities
6.2. Porter’s Five Forces Analysis
6.2.1. Bargaining power of suppliers
6.2.2. Bargaining power of buyers
6.2.3. Threat of substitute
6.2.4. Threat of new entrants
6.2.5. Degree of competition
Chapter 7. Competitive Landscape
7.1.1. Company Market Share/Positioning Analysis
7.1.2. Key Strategies Adopted by Players
7.1.3. Vendor Landscape
7.1.3.1. List of Suppliers
7.1.3.2. List of Buyers
Chapter 8. Global Supply Chain Analytics Market, By Solution
8.1. Supply Chain Analytics Market, by Solution, 2023-2032
8.1.1. Logistics Analytics
8.1.1.1. Market Revenue and Forecast (2020-2032)
8.1.2. Manufacturing Analytics
8.1.2.1. Market Revenue and Forecast (2020-2032)
8.1.3. Planning & Procurement
8.1.3.1. Market Revenue and Forecast (2020-2032)
8.1.4. Sales & Operations Analytics
8.1.4.1. Market Revenue and Forecast (2020-2032)
8.1.5. Visualization & Reporting
8.1.5.1. Market Revenue and Forecast (2020-2032)
Chapter 9. Global Supply Chain Analytics Market, By Service
9.1. Supply Chain Analytics Market, by Service, 2023-2032
9.1.1. Professional
9.1.1.1. Market Revenue and Forecast (2020-2032)
9.1.2. Support & Maintenance
9.1.2.1. Market Revenue and Forecast (2020-2032)
Chapter 10. Global Supply Chain Analytics Market, By Deployment
10.1. Supply Chain Analytics Market, by Deployment, 2023-2032
10.1.1. Cloud
10.1.1.1. Market Revenue and Forecast (2020-2032)
10.1.2. On-premise
10.1.2.1. Market Revenue and Forecast (2020-2032)
Chapter 11. Global Supply Chain Analytics Market, By Enterprise Size
11.1. Supply Chain Analytics Market, by Enterprise Size, 2023-2032
11.1.1. Large Enterprise
11.1.1.1. Market Revenue and Forecast (2020-2032)
11.1.2. Small & Medium Enterprises
11.1.2.1. Market Revenue and Forecast (2020-2032)
Chapter 12. Global Supply Chain Analytics Market, By End-use
12.1. Supply Chain Analytics Market, by End-use, 2023-2032
12.1.1. Retail & Consumer Goods
12.1.1.1. Market Revenue and Forecast (2020-2032)
12.1.2. Healthcare
12.1.2.1. Market Revenue and Forecast (2020-2032)
12.1.3. Manufacturing
12.1.3.1. Market Revenue and Forecast (2020-2032)
12.1.4. Transportation
12.1.4.1. Market Revenue and Forecast (2020-2032)
12.1.5. Aerospace & Defense
12.1.5.1. Market Revenue and Forecast (2020-2032)
12.1.6. High Technology Products
12.1.6.1. Market Revenue and Forecast (2020-2032)
12.1.7. Others
12.1.7.1. Market Revenue and Forecast (2020-2032)
Chapter 13. Global Supply Chain Analytics Market, Regional Estimates and Trend Forecast
13.1. North America
13.1.1. Market Revenue and Forecast, by Solution (2020-2032)
13.1.2. Market Revenue and Forecast, by Service (2020-2032)
13.1.3. Market Revenue and Forecast, by Deployment (2020-2032)
13.1.4. Market Revenue and Forecast, by Enterprise Size (2020-2032)
13.1.5. Market Revenue and Forecast, by End-use (2020-2032)
13.1.6. U.S.
13.1.6.1. Market Revenue and Forecast, by Solution (2020-2032)
13.1.6.2. Market Revenue and Forecast, by Service (2020-2032)
13.1.6.3. Market Revenue and Forecast, by Deployment (2020-2032)
13.1.6.4. Market Revenue and Forecast, by Enterprise Size (2020-2032)
13.1.7. Market Revenue and Forecast, by End-use (2020-2032)
13.1.8. Rest of North America
13.1.8.1. Market Revenue and Forecast, by Solution (2020-2032)
13.1.8.2. Market Revenue and Forecast, by Service (2020-2032)
13.1.8.3. Market Revenue and Forecast, by Deployment (2020-2032)
13.1.8.4. Market Revenue and Forecast, by Enterprise Size (2020-2032)
13.1.8.5. Market Revenue and Forecast, by End-use (2020-2032)
13.2. Europe
13.2.1. Market Revenue and Forecast, by Solution (2020-2032)
13.2.2. Market Revenue and Forecast, by Service (2020-2032)
13.2.3. Market Revenue and Forecast, by Deployment (2020-2032)
13.2.4. Market Revenue and Forecast, by Enterprise Size (2020-2032)
13.2.5. Market Revenue and Forecast, by End-use (2020-2032)
13.2.6. UK
13.2.6.1. Market Revenue and Forecast, by Solution (2020-2032)
13.2.6.2. Market Revenue and Forecast, by Service (2020-2032)
13.2.6.3. Market Revenue and Forecast, by Deployment (2020-2032)
13.2.7. Market Revenue and Forecast, by Enterprise Size (2020-2032)
13.2.8. Market Revenue and Forecast, by End-use (2020-2032)
13.2.9. Germany
13.2.9.1. Market Revenue and Forecast, by Solution (2020-2032)
13.2.9.2. Market Revenue and Forecast, by Service (2020-2032)
13.2.9.3. Market Revenue and Forecast, by Deployment (2020-2032)
13.2.10. Market Revenue and Forecast, by Enterprise Size (2020-2032)
13.2.11. Market Revenue and Forecast, by End-use (2020-2032)
13.2.12. France
13.2.12.1. Market Revenue and Forecast, by Solution (2020-2032)
13.2.12.2. Market Revenue and Forecast, by Service (2020-2032)
13.2.12.3. Market Revenue and Forecast, by Deployment (2020-2032)
13.2.12.4. Market Revenue and Forecast, by Enterprise Size (2020-2032)
13.2.13. Market Revenue and Forecast, by End-use (2020-2032)
13.2.14. Rest of Europe
13.2.14.1. Market Revenue and Forecast, by Solution (2020-2032)
13.2.14.2. Market Revenue and Forecast, by Service (2020-2032)
13.2.14.3. Market Revenue and Forecast, by Deployment (2020-2032)
13.2.14.4. Market Revenue and Forecast, by Enterprise Size (2020-2032)
13.2.15. Market Revenue and Forecast, by End-use (2020-2032)
13.3. APAC
13.3.1. Market Revenue and Forecast, by Solution (2020-2032)
13.3.2. Market Revenue and Forecast, by Service (2020-2032)
13.3.3. Market Revenue and Forecast, by Deployment (2020-2032)
13.3.4. Market Revenue and Forecast, by Enterprise Size (2020-2032)
13.3.5. Market Revenue and Forecast, by End-use (2020-2032)
13.3.6. India
13.3.6.1. Market Revenue and Forecast, by Solution (2020-2032)
13.3.6.2. Market Revenue and Forecast, by Service (2020-2032)
13.3.6.3. Market Revenue and Forecast, by Deployment (2020-2032)
13.3.6.4. Market Revenue and Forecast, by Enterprise Size (2020-2032)
13.3.7. Market Revenue and Forecast, by End-use (2020-2032)
13.3.8. China
13.3.8.1. Market Revenue and Forecast, by Solution (2020-2032)
13.3.8.2. Market Revenue and Forecast, by Service (2020-2032)
13.3.8.3. Market Revenue and Forecast, by Deployment (2020-2032)
13.3.8.4. Market Revenue and Forecast, by Enterprise Size (2020-2032)
13.3.9. Market Revenue and Forecast, by End-use (2020-2032)
13.3.10. Japan
13.3.10.1. Market Revenue and Forecast, by Solution (2020-2032)
13.3.10.2. Market Revenue and Forecast, by Service (2020-2032)
13.3.10.3. Market Revenue and Forecast, by Deployment (2020-2032)
13.3.10.4. Market Revenue and Forecast, by Enterprise Size (2020-2032)
13.3.10.5. Market Revenue and Forecast, by End-use (2020-2032)
13.3.11. Rest of APAC
13.3.11.1. Market Revenue and Forecast, by Solution (2020-2032)
13.3.11.2. Market Revenue and Forecast, by Service (2020-2032)
13.3.11.3. Market Revenue and Forecast, by Deployment (2020-2032)
13.3.11.4. Market Revenue and Forecast, by Enterprise Size (2020-2032)
13.3.11.5. Market Revenue and Forecast, by End-use (2020-2032)
13.4. MEA
13.4.1. Market Revenue and Forecast, by Solution (2020-2032)
13.4.2. Market Revenue and Forecast, by Service (2020-2032)
13.4.3. Market Revenue and Forecast, by Deployment (2020-2032)
13.4.4. Market Revenue and Forecast, by Enterprise Size (2020-2032)
13.4.5. Market Revenue and Forecast, by End-use (2020-2032)
13.4.6. GCC
13.4.6.1. Market Revenue and Forecast, by Solution (2020-2032)
13.4.6.2. Market Revenue and Forecast, by Service (2020-2032)
13.4.6.3. Market Revenue and Forecast, by Deployment (2020-2032)
13.4.6.4. Market Revenue and Forecast, by Enterprise Size (2020-2032)
13.4.7. Market Revenue and Forecast, by End-use (2020-2032)
13.4.8. North Africa
13.4.8.1. Market Revenue and Forecast, by Solution (2020-2032)
13.4.8.2. Market Revenue and Forecast, by Service (2020-2032)
13.4.8.3. Market Revenue and Forecast, by Deployment (2020-2032)
13.4.8.4. Market Revenue and Forecast, by Enterprise Size (2020-2032)
13.4.9. Market Revenue and Forecast, by End-use (2020-2032)
13.4.10. South Africa
13.4.10.1. Market Revenue and Forecast, by Solution (2020-2032)
13.4.10.2. Market Revenue and Forecast, by Service (2020-2032)
13.4.10.3. Market Revenue and Forecast, by Deployment (2020-2032)
13.4.10.4. Market Revenue and Forecast, by Enterprise Size (2020-2032)
13.4.10.5. Market Revenue and Forecast, by End-use (2020-2032)
13.4.11. Rest of MEA
13.4.11.1. Market Revenue and Forecast, by Solution (2020-2032)
13.4.11.2. Market Revenue and Forecast, by Service (2020-2032)
13.4.11.3. Market Revenue and Forecast, by Deployment (2020-2032)
13.4.11.4. Market Revenue and Forecast, by Enterprise Size (2020-2032)
13.4.11.5. Market Revenue and Forecast, by End-use (2020-2032)
13.5. Latin America
13.5.1. Market Revenue and Forecast, by Solution (2020-2032)
13.5.2. Market Revenue and Forecast, by Service (2020-2032)
13.5.3. Market Revenue and Forecast, by Deployment (2020-2032)
13.5.4. Market Revenue and Forecast, by Enterprise Size (2020-2032)
13.5.5. Market Revenue and Forecast, by End-use (2020-2032)
13.5.6. Brazil
13.5.6.1. Market Revenue and Forecast, by Solution (2020-2032)
13.5.6.2. Market Revenue and Forecast, by Service (2020-2032)
13.5.6.3. Market Revenue and Forecast, by Deployment (2020-2032)
13.5.6.4. Market Revenue and Forecast, by Enterprise Size (2020-2032)
13.5.7. Market Revenue and Forecast, by End-use (2020-2032)
13.5.8. Rest of LATAM
13.5.8.1. Market Revenue and Forecast, by Solution (2020-2032)
13.5.8.2. Market Revenue and Forecast, by Service (2020-2032)
13.5.8.3. Market Revenue and Forecast, by Deployment (2020-2032)
13.5.8.4. Market Revenue and Forecast, by Enterprise Size (2020-2032)
13.5.8.5. Market Revenue and Forecast, by End-use (2020-2032)
Chapter 14. Company Profiles
14.1. Accenture PLC
14.1.1. Company Overview
14.1.2. Product Offerings
14.1.3. Financial Performance
14.1.4. Recent Initiatives
14.2. Aera Technology
14.2.1. Company Overview
14.2.2. Product Offerings
14.2.3. Financial Performance
14.2.4. Recent Initiatives
14.3. Birst, Inc.
14.3.1. Company Overview
14.3.2. Product Offerings
14.3.3. Financial Performance
14.3.4. Recent Initiatives
14.4. Capgemini SA
14.4.1. Company Overview
14.4.2. Product Offerings
14.4.3. Financial Performance
14.4.4. Recent Initiatives
14.5. Genpact Limited
14.5.1. Company Overview
14.5.2. Product Offerings
14.5.3. Financial Performance
14.5.4. Recent Initiatives
14.6. International Business Machines Corporation
14.6.1. Company Overview
14.6.2. Product Offerings
14.6.3. Financial Performance
14.6.4. Recent Initiatives
14.7. JDA Software Group; Inc.
14.7.1. Company Overview
14.7.2. Product Offerings
14.7.3. Financial Performance
14.7.4. Recent Initiatives
14.8. Kinaxis
14.8.1. Company Overview
14.8.2. Product Offerings
14.8.3. Financial Performance
14.8.4. Recent Initiatives
14.9. Lockheed Martin Corporation
14.9.1. Company Overview
14.9.2. Product Offerings
14.9.3. Financial Performance
14.9.4. Recent Initiatives
14.10. Maersk Group
14.10.1. Company Overview
14.10.2. Product Offerings
14.10.3. Financial Performance
14.10.4. Recent Initiatives
Chapter 15. Research Methodology
15.1. Primary Research
15.2. Secondary Research
15.3. Assumptions
Chapter 16. Appendix
16.1. About Us
16.2. Glossary of Terms
 Cross-segment Market Size and Analysis for
Mentioned Segments
Additional Company Profiles (Upto 5 With No Cost)
Additional Countries (Apart From Mentioned Countries)
Country/Region-specific Report
Go To Market Strategy
Region Specific Market DynamicsRegion Level Market Share Import Export AnalysisProduction AnalysisOthers
Cross-segment Market Size and Analysis for
Mentioned Segments
Additional Company Profiles (Upto 5 With No Cost)
Additional Countries (Apart From Mentioned Countries)
Country/Region-specific Report
Go To Market Strategy
Region Specific Market DynamicsRegion Level Market Share Import Export AnalysisProduction AnalysisOthers