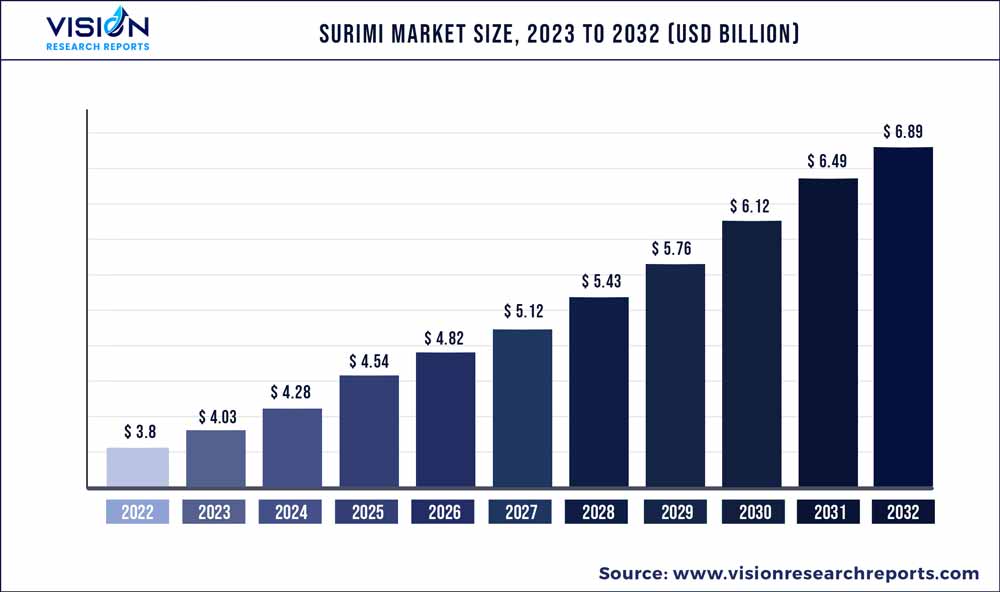
The global surimi market was valued at USD 3.8 billion in 2022 and it is predicted to surpass around USD 6.89 billion by 2032 with a CAGR of 6.13% from 2023 to 2032.
Key Pointers
Report Scope of the Surimi Market
| Report Coverage | Details |
| Market Size in 2022 | USD 3.8 billion |
| Revenue Forecast by 2032 | USD 6.89 billion |
| Growth rate from 2023 to 2032 | CAGR of 6.13% |
| Base Year | 2022 |
| Forecast Period | 2023 to 2032 |
| Market Analysis (Terms Used) | Value (US$ Million/Billion) or (Volume/Units) |
| Regions Covered | North America, Europe, Asia Pacific, Latin America, Middle East & Africa |
| Companies Covered | HAI THANH CO., LTD; MEENA Brand Surimi; APITOON GROUP; Starfish Co., Ltd.; Java Seafood; PT. INDO SEAFOOD; Southern Marine; SEAPRIMEXCO; Zhejiang Longsheng Aquatic Products Co.,Ltd.; and PT.Indonesia Bahari Lestari |
One major driver propelling the market expansion over the forecast period is the rising demand for surimi as a less expensive substitute for seafood in various parts of the world. The demand for seafood-based items is rising quickly, which has led to a rise in the price of surimi because it is a key ingredient in many Asian meals.
The tropical segment held the larger market size in 2022 and is further expected to remain the dominant segment during the forecast period Tropical surimi is a more cost-effective option for people seeking an economical way to enjoy seafood because it is less expensive than other varieties of seafood. Tropical surimi uses underutilized fish species that are plentiful in tropical areas, making it a more sustainable option than typical seafood. Thus the availability of tropical fish in abundance is contributing to the higher share of the segment.
The frozen segment dominated the market by holding a major share in 2022. Frozen surimi has a longer shelf life than fresh seafood, making it a practical choice for customers who don't have access to fresh seafood or who prefer to stock up on frozen goods for future use. This can be credited to the segment's rise. Furthermore, consumers have wider access to frozen surimi because it is more widely available than fresh seafood in many areas which is contributing to the segment growth.
Asia Pacific accounted for the largest share of the market The affordability, adaptability, and flavor of surimi contribute to its widespread consumption in the Asia Pacific region. Seafood is a common food and an important component of the local cuisine in many Asian countries. Owing to such factors the region is expected to remain the leading market for surimi. Moreover, the popularity of surimi has been extensively growing in the region owing to its increasing marketing and promotion which is further surging the growth of the market. Various steps are adopted by the major players including partnerships, mergers & acquisitions, global expansion, and others to gain more share of the market.
Source Insights
The tropical segment dominated the market with a share of approximately 70.02% in 2022 and is expected to remain the leading segment in the forecast period. Various tropical fish included in the tropical segment include big eye snapper, lizardfish, threadfin bream, goatfish, and others. Big eye snapper, lizardfish, threadfin bream, and goatfish hold more than 90% of the tropical segment. Tropical surimi is a more affordable alternative to other types of seafood, making it an attractive option for consumers who are looking for a cost-effective way to enjoy seafood. In addition, tropical surimi is a more sustainable option compared to traditional seafood because it utilizes underutilized fish source that are abundant in tropical regions. This reduces the pressure on the overfished sources and supports the conservation of marine biodiversity.
The cold water segment is expected to grow with a CAGR of 6.72% over the forecast period from 2023 to 2032. The cold water segment is further sub-segmented into Alaska Pollock, Pacific Whiting, and others. The rapid growth of the segment can be attributed to advancements in technology and fishing practices that have made it easier to access and catch these fish sources. Improved fishing gear and methods, such as longline fishing and bottom trawling, have made it possible to target these fish in deeper waters. Moreover, the increasing interest in sustainable seafood production has led to a focus on cold-water fisheries as they are often more resilient to overfishing compared to the tropical source. This has resulted in increased investment in the development of sustainable aquaculture practices for a cold water source.
Form Insights
The frozen segment dominated the market and held a share of over 70.01% in 2022 and is expected to register a faster CAGR of 6.43% in the forecast period from 2023 to 2032. The growth of the segment can be attributed to the fact that frozen surimi offers a longer shelf life than fresh seafood, making it a convenient option for consumers who do not have access to fresh seafood or who prefer to stock up on frozen products for future use. In addition, frozen surimi is more widely available than fresh seafood in many regions, making it a more accessible option for consumers. Moreover, advances in freezing and packaging technology have helped to maintain the quality and taste of frozen surimi products thus contributing to the segment growth in the coming years.
The fresh segment is expected to expand at a considerable CAGR of 5.52% in the forecast period. The growth of the segment is attributed to the higher quality products compared to frozen surimi due to its shorter shelf life and less processing. This has led to increased demand among consumers who prioritize freshness and quality in their food choices. Moreover, the increasing interest in healthy and sustainable diets has led to a growing demand for fresh surimi, which is a low-fat and low-calorie source of protein that can be used in a variety of dishes. Furthermore, advancements in transportation and logistics have made it easier to transport fresh surimi over longer distances, expanding its availability in more regions.
Distribution Channel Insights
The B2B segment held a higher share of over 50.3% of the global market in 2022 and is expected to register a considerable CAGR during the forecast period. The higher share of the segment is attributed to the wide usage of surimi in various industries including food services, animal feed, food processing, and others. Surimi is a popular ingredient used in restaurants and food services due to its versatility and cost-effectiveness. It can be used in a wide range of seafood dishes, such as sushi, seafood salads, and soups, and it is typically less expensive than fresh seafood options, making it an attractive choice for budget-conscious establishments. Additionally, surimi byproducts, such as fish meal, are commonly used as a source of protein in animal feed for pets, livestock, and aquaculture in the animal feed industry. Surimi byproducts are a cost-effective alternative to other protein sources, and they also offer several nutritional benefits.
The B2C segment is expected to expand with a faster CAGR of 6.51% over the forecast period from 2023 to 2032. The B2C segment is further fragmented into hypermarkets & supermarkets, convenience stores, online, and others. The hypermarkets & supermarkets segment held a significant share of around 30% in 2022. This is attributed to a larger selection of products compared to other retail outlets, and frozen surimi is often included in their frozen seafood section. Moreover, the online segment is expected to grow with the fastest CAGR of 8.1% over the forecast period.
The growth of the segment is due to the increasing preference of consumers buying online owing to the convenience of ordering groceries and other goods online. Frozen surimi is a product that can be easily shipped and stored in a frozen state, making it a good fit for online retailers. Furthermore, online retailers often have a wider selection of products compared to physical stores and can source frozen surimi from a variety of suppliers. This has led to an increase in the availability of frozen surimi through online channels.
Regional Insights
Asia Pacific held the highest share of over 50.04% of the global market in 2022 and is anticipated to remain the leading region in the forecast period. The region is also anticipated to expand at the fastest CAGR of 6.61% over the forecast period. Surimi is highly consumed in the Asia Pacific region due to its affordability, versatility, and flavor. In many parts of Asia, seafood is a staple food and a major part of the local cuisine. In addition, surimi has been promoted and marketed extensively in the Asia Pacific region by the seafood industry, leading to its widespread popularity. Surimi-based products like fish balls, crab sticks, and kamaboko are commonly consumed as snacks or added to dishes as a protein source.
Europe held a significant share of the market and is expected to grow with a significant CAGR of 6.02% over the forecast period. The growing demand for healthy and sustainable protein sources has been observed in the region and surimi is seen as a healthy and low-fat alternative to other types of meat and seafood. Moreover, the seafood industry in Europe has also been promoting surimi-based products as a convenient and affordable alternative to fresh seafood. Furthermore, the popularity of Asian cuisine in Europe has led to greater awareness and appreciation of surimi-based products, such as crab sticks and fish balls thus driving the market.
Surimi Market Segmentations:
By Source
By Form
By Distribution Channel
By Regional
Chapter 1. Introduction
1.1. Research Objective
1.2. Scope of the Study
1.3. Definition
Chapter 2. Research Methodology
2.1. Research Approach
2.2. Data Sources
2.3. Assumptions & Limitations
Chapter 3. Executive Summary
3.1. Market Snapshot
Chapter 4. Market Variables and Scope
4.1. Introduction
4.2. Market Classification and Scope
4.3. Industry Value Chain Analysis
4.3.1. Raw Material Procurement Analysis
4.3.2. Sales and Distribution Source Analysis
4.3.3. Downstream Buyer Analysis
Chapter 5. COVID 19 Impact on Surimi Market
5.1. COVID-19 Landscape: Surimi Industry Impact
5.2. COVID 19 - Impact Assessment for the Industry
5.3. COVID 19 Impact: Global Major Government Policy
5.4. Market Trends and Opportunities in the COVID-19 Landscape
Chapter 6. Market Dynamics Analysis and Trends
6.1. Market Dynamics
6.1.1. Market Drivers
6.1.2. Market Restraints
6.1.3. Market Opportunities
6.2. Porter’s Five Forces Analysis
6.2.1. Bargaining power of suppliers
6.2.2. Bargaining power of buyers
6.2.3. Threat of substitute
6.2.4. Threat of new entrants
6.2.5. Degree of competition
Chapter 7. Competitive Landscape
7.1.1. Company Market Share/Positioning Analysis
7.1.2. Key Strategies Adopted by Players
7.1.3. Vendor Landscape
7.1.3.1. List of Suppliers
7.1.3.2. List of Buyers
Chapter 8. Global Surimi Market, By Source
8.1. Surimi Market, by Source, 2023-2032
8.1.1 Tropical
8.1.1.1. Market Revenue and Forecast (2020-2032)
8.1.2. Cold Water
8.1.2.1. Market Revenue and Forecast (2020-2032)
Chapter 9. Global Surimi Market, By Form
9.1. Surimi Market, by Form, 2023-2032
9.1.1. Frozen
9.1.1.1. Market Revenue and Forecast (2020-2032)
9.1.2. Fresh
9.1.2.1. Market Revenue and Forecast (2020-2032)
Chapter 10. Global Surimi Market, By Distribution Channel
10.1. Surimi Market, by Distribution Channel, 2023-2032
10.1.1. B2B
10.1.1.1. Market Revenue and Forecast (2020-2032)
10.1.2. B2C
10.1.2.1. Market Revenue and Forecast (2020-2032)
Chapter 11. Global Surimi Market, Regional Estimates and Trend Forecast
11.1. North America
11.1.1. Market Revenue and Forecast, by Source (2020-2032)
11.1.2. Market Revenue and Forecast, by Form (2020-2032)
11.1.3. Market Revenue and Forecast, by Distribution Channel (2020-2032)
11.1.4. U.S.
11.1.4.1. Market Revenue and Forecast, by Source (2020-2032)
11.1.4.2. Market Revenue and Forecast, by Form (2020-2032)
11.1.4.3. Market Revenue and Forecast, by Distribution Channel (2020-2032)
11.1.5. Rest of North America
11.1.5.1. Market Revenue and Forecast, by Source (2020-2032)
11.1.5.2. Market Revenue and Forecast, by Form (2020-2032)
11.1.5.3. Market Revenue and Forecast, by Distribution Channel (2020-2032)
11.2. Europe
11.2.1. Market Revenue and Forecast, by Source (2020-2032)
11.2.2. Market Revenue and Forecast, by Form (2020-2032)
11.2.3. Market Revenue and Forecast, by Distribution Channel (2020-2032)
11.2.4. UK
11.2.4.1. Market Revenue and Forecast, by Source (2020-2032)
11.2.4.2. Market Revenue and Forecast, by Form (2020-2032)
11.2.4.3. Market Revenue and Forecast, by Distribution Channel (2020-2032)
11.2.5. Germany
11.2.5.1. Market Revenue and Forecast, by Source (2020-2032)
11.2.5.2. Market Revenue and Forecast, by Form (2020-2032)
11.2.5.3. Market Revenue and Forecast, by Distribution Channel (2020-2032)
11.2.6. France
11.2.6.1. Market Revenue and Forecast, by Source (2020-2032)
11.2.6.2. Market Revenue and Forecast, by Form (2020-2032)
11.2.6.3. Market Revenue and Forecast, by Distribution Channel (2020-2032)
11.2.7. Rest of Europe
11.2.7.1. Market Revenue and Forecast, by Source (2020-2032)
11.2.7.2. Market Revenue and Forecast, by Form (2020-2032)
11.2.7.3. Market Revenue and Forecast, by Distribution Channel (2020-2032)
11.3. APAC
11.3.1. Market Revenue and Forecast, by Source (2020-2032)
11.3.2. Market Revenue and Forecast, by Form (2020-2032)
11.3.3. Market Revenue and Forecast, by Distribution Channel (2020-2032)
11.3.4. India
11.3.4.1. Market Revenue and Forecast, by Source (2020-2032)
11.3.4.2. Market Revenue and Forecast, by Form (2020-2032)
11.3.4.3. Market Revenue and Forecast, by Distribution Channel (2020-2032)
11.3.5. China
11.3.5.1. Market Revenue and Forecast, by Source (2020-2032)
11.3.5.2. Market Revenue and Forecast, by Form (2020-2032)
11.3.5.3. Market Revenue and Forecast, by Distribution Channel (2020-2032)
11.3.6. Japan
11.3.6.1. Market Revenue and Forecast, by Source (2020-2032)
11.3.6.2. Market Revenue and Forecast, by Form (2020-2032)
11.3.6.3. Market Revenue and Forecast, by Distribution Channel (2020-2032)
11.3.7. Rest of APAC
11.3.7.1. Market Revenue and Forecast, by Source (2020-2032)
11.3.7.2. Market Revenue and Forecast, by Form (2020-2032)
11.3.7.3. Market Revenue and Forecast, by Distribution Channel (2020-2032)
11.4. MEA
11.4.1. Market Revenue and Forecast, by Source (2020-2032)
11.4.2. Market Revenue and Forecast, by Form (2020-2032)
11.4.3. Market Revenue and Forecast, by Distribution Channel (2020-2032)
11.4.4. GCC
11.4.4.1. Market Revenue and Forecast, by Source (2020-2032)
11.4.4.2. Market Revenue and Forecast, by Form (2020-2032)
11.4.4.3. Market Revenue and Forecast, by Distribution Channel (2020-2032)
11.4.5. North Africa
11.4.5.1. Market Revenue and Forecast, by Source (2020-2032)
11.4.5.2. Market Revenue and Forecast, by Form (2020-2032)
11.4.5.3. Market Revenue and Forecast, by Distribution Channel (2020-2032)
11.4.6. South Africa
11.4.6.1. Market Revenue and Forecast, by Source (2020-2032)
11.4.6.2. Market Revenue and Forecast, by Form (2020-2032)
11.4.6.3. Market Revenue and Forecast, by Distribution Channel (2020-2032)
11.4.7. Rest of MEA
11.4.7.1. Market Revenue and Forecast, by Source (2020-2032)
11.4.7.2. Market Revenue and Forecast, by Form (2020-2032)
11.4.7.3. Market Revenue and Forecast, by Distribution Channel (2020-2032)
11.5. Latin America
11.5.1. Market Revenue and Forecast, by Source (2020-2032)
11.5.2. Market Revenue and Forecast, by Form (2020-2032)
11.5.3. Market Revenue and Forecast, by Distribution Channel (2020-2032)
11.5.4. Brazil
11.5.4.1. Market Revenue and Forecast, by Source (2020-2032)
11.5.4.2. Market Revenue and Forecast, by Form (2020-2032)
11.5.4.3. Market Revenue and Forecast, by Distribution Channel (2020-2032)
11.5.5. Rest of LATAM
11.5.5.1. Market Revenue and Forecast, by Source (2020-2032)
11.5.5.2. Market Revenue and Forecast, by Form (2020-2032)
11.5.5.3. Market Revenue and Forecast, by Distribution Channel (2020-2032)
Chapter 12. Company Profiles
12.1. HAI THANH CO., LTD
12.1.1. Company Overview
12.1.2. Product Offerings
12.1.3. Financial Performance
12.1.4. Recent Initiatives
12.2. MEENA Brand Surimi
12.2.1. Company Overview
12.2.2. Product Offerings
12.2.3. Financial Performance
12.2.4. Recent Initiatives
12.3. APITOON GROUP
12.3.1. Company Overview
12.3.2. Product Offerings
12.3.3. Financial Performance
12.3.4. Recent Initiatives
12.4. Starfish Co., Ltd.
12.4.1. Company Overview
12.4.2. Product Offerings
12.4.3. Financial Performance
12.4.4. Recent Initiatives
12.5. Java Seafood
12.5.1. Company Overview
12.5.2. Product Offerings
12.5.3. Financial Performance
12.5.4. Recent Initiatives
12.6. PT. INDO SEAFOOD
12.6.1. Company Overview
12.6.2. Product Offerings
12.6.3. Financial Performance
12.6.4. Recent Initiatives
12.7. Southern Marine
12.7.1. Company Overview
12.7.2. Product Offerings
12.7.3. Financial Performance
12.7.4. Recent Initiatives
12.8. SEAPRIMEXCO
12.8.1. Company Overview
12.8.2. Product Offerings
12.8.3. Financial Performance
12.8.4. Recent Initiatives
12.9. Zhejiang Longsheng Aquatic Products Co.,Ltd.
12.9.1. Company Overview
12.9.2. Product Offerings
12.9.3. Financial Performance
12.9.4. Recent Initiatives
12.10. PT.Indonesia Bahari Lestari
12.10.1. Company Overview
12.10.2. Product Offerings
12.10.3. Financial Performance
12.10.4. Recent Initiatives
Chapter 13. Research Methodology
13.1. Primary Research
13.2. Secondary Research
13.3. Assumptions
Chapter 14. Appendix
14.1. About Us
14.2. Glossary of Terms
 Cross-segment Market Size and Analysis for
Mentioned Segments
Additional Company Profiles (Upto 5 With No Cost)
Additional Countries (Apart From Mentioned Countries)
Country/Region-specific Report
Go To Market Strategy
Region Specific Market DynamicsRegion Level Market Share Import Export AnalysisProduction AnalysisOthers
Cross-segment Market Size and Analysis for
Mentioned Segments
Additional Company Profiles (Upto 5 With No Cost)
Additional Countries (Apart From Mentioned Countries)
Country/Region-specific Report
Go To Market Strategy
Region Specific Market DynamicsRegion Level Market Share Import Export AnalysisProduction AnalysisOthers