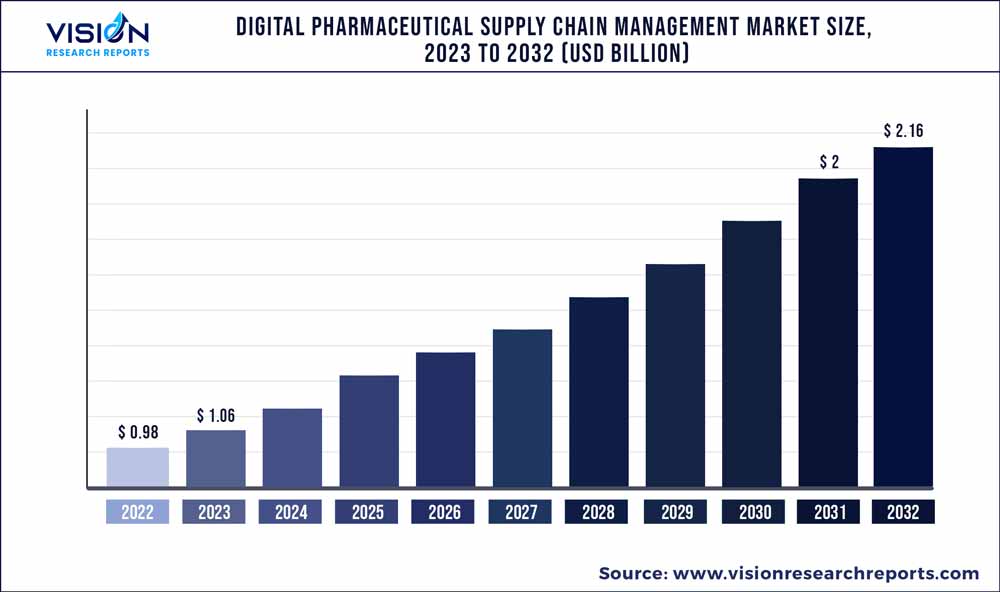
The global digital pharmaceutical supply chain management market was estimated at USD 0.98 billion in 2022 and it is expected to surpass around USD 2.16 billion by 2032, poised to grow at a CAGR of 8.23% from 2023 to 2032. The digital pharmaceutical supply chain management market in the United States was accounted for USD 243.9 million in 2022.

Key Pointers
Report Scope of the Digital Pharmaceutical Supply Chain Management Market
| Report Coverage | Details |
| Revenue Share of North America in 2022 | 33% |
| CAGR of Asia Pacific from 2023 to 2032 | 9.58% |
| Revenue Forecast by 2032 | USD 2.16 billion |
| Growth Rate from 2023 to 2032 | CAGR of 8.23% |
| Base Year | 2022 |
| Forecast Period | 2023 to 2032 |
| Market Analysis (Terms Used) | Value (US$ Million/Billion) or (Volume/Units) |
| Companies Covered |
McKesson Corporation; Mediceo Corporation; Palantir Technologies, Inc; Jump Technologies, Inc.;InterSystems Corporation;Tecsys; Oracle; SAP; Infor; Terso Solutions; CenTrak (HALMA plc); Biolog-id; TraceLink |
It is expected to reach USD 1.84 billion by 2032. Government initiatives to improve medical supply, increased investment in next-generation technologies such as digital twin technology and control towers, and the adoption of virtual control towers and dashboards to enhance visibility, analytics, and execution tools are some of the factors driving the demand for digital supply chain management solutions across the healthcare industry, including pharmaceuticals. Furthermore, the demand for digital pharmaceutical supply chain management is fuelled by the necessity to ensure precise and timely delivery of medical supplies, leading to a notable surge in digitization usage.
AI-based solutions have revolutionized the pharmaceutical supply chain by providing actionable insights that lead to better visibility, service quality, and an improved customer experience. Logistics management platforms support pharmaceutical companies in facilitating immediate deliveries seamlessly, resulting in enhanced logistics efficiency through automation and digitalization. This became increasingly important during the peak of COVID-19, as consumers depended heavily on e-commerce and online retailers for essential products.
Applications of the digitalized system such as artificial intelligence-powered technologies in the pharmaceutical supply chain can support companies in overcoming various challenges. For instance, companies can analyze data from numerous sources to find trends and anomalies using artificial intelligence techniques, which enables more precise demand forecasting and better inventory control. One noteworthy example is Merck KGaA's adoption of a data-driven strategy to enhance demand forecasting in their supply chain operations. Merck dramatically increased the forecast accuracy for 90% of its goods by widely implementing this method. Aera's AI algorithms use information from Merck's business resource planning system to provide quick and accurate demand forecasting that takes location and volume into account.
The growing adoption of mobile-based healthcare SCM solutions among manufacturers and providers is expected to boost market growth over the forecast period. Mobile apps have become an essential part of SCM solutions. SCM for logistic companies in developed countries, along with emerging ones, has become easier owing to GPS-enabled mobile applications. These apps use mobile devices and sensors for tracking vehicles, thereby providing better visibility of the entire SCM.
Furthermore, there are several healthcare SCM apps available. For instance, Prodigo Solutions offer various products and applications to optimize the functionality & usability of supply chain management. Prodigo Marketplace is an ordering platform with a seamless user interface, allowing the user to easily search & purchase products at the right price. Prodigo Xchange allows health systems to ensure full security of health data and the lowest cost per transaction, simultaneously offering enhanced visibility of supply chain performance. The other healthcare SCM apps are Premier Connect and Descartes.
Product Insights
Based on product, the market is segmented into software, hardware, and services. The software segment held the largest market share of 40% in 2022, owing to its applications in the digital pharmaceutical supply chain management market. Software is also expected to be the fastest-growing segment over the forecast period. The increasing adoption of software, such as SaaS, which can offer next-generation cloud computing applications including supply chain management & enterprise resource planning, is among the key factors boosting the market.
Based on the software module the software product segment of the market is segmented into planning & analytics, procurement, manufacturing, logistics, and inventory management. The manufacturing software module segment dominated the market with a market share of 41.6% in 2022.
Several market players are attempting to put demand-friendly strategic plans into action. The development of new products and high R&D investments are some of the strategies being implemented by players. For instance, in March 2023, Arkieva, a company specializing in integrated scheduling and planning software for CPG, wholesaler, & manufacturing operations, announced the launch of Arkieva+, a self-service SaaS solution. It was designed to cater to the supply chain management and planning needs of companies & businesses with annual revenue of less than USD 250 million.
Services accounted for the second-fastest segment in terms of growth, owing to advancements and rising demand for services such as support & maintenance, consulting, and education & training. The development of a range of platforms for monitoring, diagnosis, and wellness & prevention of diseases is another key factor boosting the market. The growing trend of implementing software upgrades to incorporate a more diverse array of healthcare applications is further contributing to segment growth.
Mode Of Delivery Insights
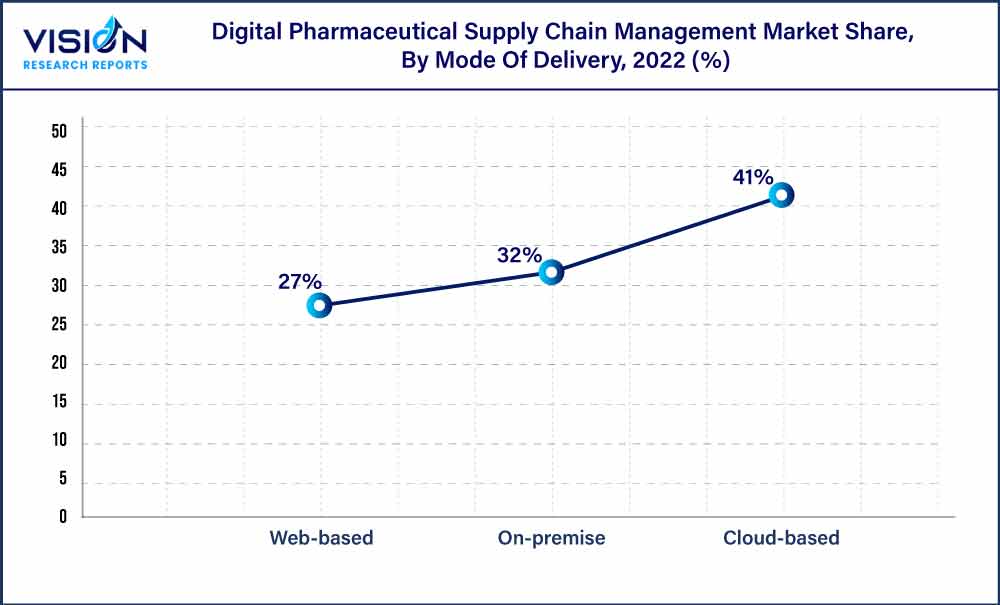
Based on the mode of delivery, the market is segmented into cloud-based, web-based and on -premises segments. The cloud-based segment dominated the market with a share of 41% in 2022. Cloud-based deployment is also expected to be the fastest-growing segment over the forecast period. Its growth can be attributed to rising demand for user-friendly technology, cost-effectiveness, and increasing adoption. Growing penetration of cloud computing among healthcare providers for maintaining inventory and procurement information is expected to further drive the segment.

The on-premise segment is anticipated to show at a CAGR of 7.88% from 2023 to 2032. On-premise deployment is commonly adopted by several medium- & small-scale enterprises through in-house data centers and security infrastructure. Previously, the majority of healthcare centers were dependent on-premise deployment; however, with the advent of cloud-based technology, several organizations are opting for cloud-based deployment.
Moreover, various challenges faced by organizations during the deployment of on-premise solutions are effective implementation & governance, constant policy & process challenges, staff recruitment, and training & retention.
Regional Insights
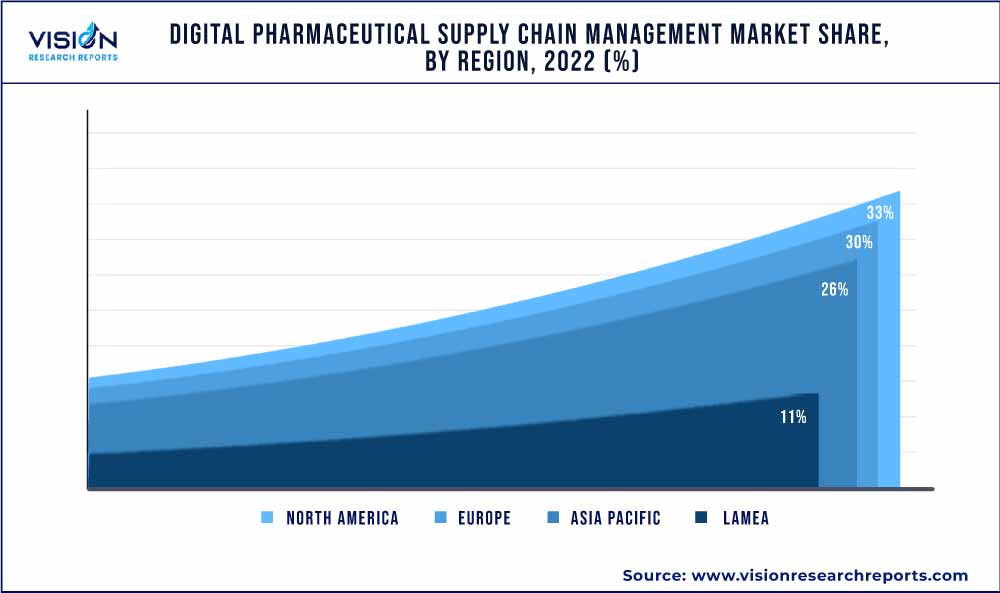
In 2022, North America dominated the digital pharmaceutical supply chain management market with a share of 33% due to its adoption of technological advances that reduce supply chain management costs, the need for improved digital supply chain efficiencies, and the integration of machine learning and artificial intelligence (AI) to better analyze and predict supply chain management outcomes.

Furthermore, the market is supported by several factors such as the rising patient burden in the U.S., the increasing prevalence of chronic diseases, regulatory requirements, and the implementation of various strategies to enhance pharmaceutical supply chain management. The growing adoption of scanning technologies, such as barcodes and RFID, to curb counterfeited drugs has aided in tracking the drugs. Manufacturers in the U.S. have started using edible barcodes in combating the counterfeit drug trade. Furthermore, the adoption of these scanning technologies among healthcare providers and distributors is boosting the market in the region by tracking and tracing the visibility of the product.
The Asia Pacific region is expected to witness the fastest growth at a CAGR of 9.58% over the forecast period owing to mobile-based healthcare supply chain management solutions and increased implementation of technologically advanced solutions in Asian countries such as India, China, and Japan. The growing adoption of GS1 standards in the region to track the visibility of pharmaceutical products is expected to further boost the market in the region. According to the WHO, Asia Pacific holds the biggest share of the trade in counterfeit medicines. The pharmaceutical industry has adopted technologies, such as barcodes and RFID to track products and gain information about products for curbing the counterfeiting of drugs.
Digital Pharmaceutical Supply Chain Management Market Segmentations:
By Product
By Mode Of Delivery
By Software Modules
By Regional
Chapter 1. Introduction
1.1. Research Objective
1.2. Scope of the Study
1.3. Definition
Chapter 2. Research Methodology
2.1. Research Approach
2.2. Data Sources
2.3. Assumptions & Limitations
Chapter 3. Executive Summary
3.1. Market Snapshot
Chapter 4. Market Variables and Scope
4.1. Introduction
4.2. Market Classification and Scope
4.3. Industry Value Chain Analysis
4.3.1. Raw Material Procurement Analysis
4.3.2. Sales and Distribution Product Analysis
4.3.3. Downstream Buyer Analysis
Chapter 5. COVID 19 Impact on Digital Pharmaceutical Supply Chain Management Market
5.1. COVID-19 Landscape: Digital Pharmaceutical Supply Chain Management Industry Impact
5.2. COVID 19 - Impact Assessment for the Industry
5.3. COVID 19 Impact: Global Major Government Policy
5.4. Market Trends and Opportunities in the COVID-19 Landscape
Chapter 6. Market Dynamics Analysis and Trends
6.1. Market Dynamics
6.1.1. Market Drivers
6.1.2. Market Restraints
6.1.3. Market Opportunities
6.2. Porter’s Five Forces Analysis
6.2.1. Bargaining power of suppliers
6.2.2. Bargaining power of buyers
6.2.3. Threat of substitute
6.2.4. Threat of new entrants
6.2.5. Degree of competition
Chapter 7. Competitive Landscape
7.1.1. Company Market Share/Positioning Analysis
7.1.2. Key Strategies Adopted by Players
7.1.3. Vendor Landscape
7.1.3.1. List of Suppliers
7.1.3.2. List of Buyers
Chapter 8. Global Digital Pharmaceutical Supply Chain Management Market, By Product
8.1. Digital Pharmaceutical Supply Chain Management Market, by Product, 2023-2032
8.1.1 Software
8.1.1.1. Market Revenue and Forecast (2020-2032)
8.1.2. Hardware
8.1.2.1. Market Revenue and Forecast (2020-2032)
8.1.3. Services
8.1.3.1. Market Revenue and Forecast (2020-2032)
Chapter 9. Global Digital Pharmaceutical Supply Chain Management Market, By Mode Of Delivery
9.1. Digital Pharmaceutical Supply Chain Management Market, by Mode Of Delivery, 2023-2032
9.1.1. On-premise
9.1.1.1. Market Revenue and Forecast (2020-2032)
9.1.2. Cloud-based
9.1.2.1. Market Revenue and Forecast (2020-2032)
9.1.3. Web-based
9.1.3.1. Market Revenue and Forecast (2020-2032)
Chapter 10. Global Digital Pharmaceutical Supply Chain Management Market, By Software
10.1. Digital Pharmaceutical Supply Chain Management Market, by Software, 2023-2032
10.1.1. Planning & Analytics
10.1.1.1. Market Revenue and Forecast (2020-2032)
10.1.2. Procurement
10.1.2.1. Market Revenue and Forecast (2020-2032)
10.1.3. Manufacturing
10.1.3.1. Market Revenue and Forecast (2020-2032)
10.1.4. Logistics
10.1.4.1. Market Revenue and Forecast (2020-2032)
10.1.5. Inventory Management
10.1.5.1. Market Revenue and Forecast (2020-2032)
Chapter 11. Global Digital Pharmaceutical Supply Chain Management Market, Regional Estimates and Trend Forecast
11.1. North America
11.1.1. Market Revenue and Forecast, by Product (2020-2032)
11.1.2. Market Revenue and Forecast, by Mode Of Delivery (2020-2032)
11.1.3. Market Revenue and Forecast, by Software (2020-2032)
11.1.4. U.S.
11.1.4.1. Market Revenue and Forecast, by Product (2020-2032)
11.1.4.2. Market Revenue and Forecast, by Mode Of Delivery (2020-2032)
11.1.4.3. Market Revenue and Forecast, by Software (2020-2032)
11.1.5. Rest of North America
11.1.5.1. Market Revenue and Forecast, by Product (2020-2032)
11.1.5.2. Market Revenue and Forecast, by Mode Of Delivery (2020-2032)
11.1.5.3. Market Revenue and Forecast, by Software (2020-2032)
11.2. Europe
11.2.1. Market Revenue and Forecast, by Product (2020-2032)
11.2.2. Market Revenue and Forecast, by Mode Of Delivery (2020-2032)
11.2.3. Market Revenue and Forecast, by Software (2020-2032)
11.2.4. UK
11.2.4.1. Market Revenue and Forecast, by Product (2020-2032)
11.2.4.2. Market Revenue and Forecast, by Mode Of Delivery (2020-2032)
11.2.4.3. Market Revenue and Forecast, by Software (2020-2032)
11.2.5. Germany
11.2.5.1. Market Revenue and Forecast, by Product (2020-2032)
11.2.5.2. Market Revenue and Forecast, by Mode Of Delivery (2020-2032)
11.2.5.3. Market Revenue and Forecast, by Software (2020-2032)
11.2.6. France
11.2.6.1. Market Revenue and Forecast, by Product (2020-2032)
11.2.6.2. Market Revenue and Forecast, by Mode Of Delivery (2020-2032)
11.2.6.3. Market Revenue and Forecast, by Software (2020-2032)
11.2.7. Rest of Europe
11.2.7.1. Market Revenue and Forecast, by Product (2020-2032)
11.2.7.2. Market Revenue and Forecast, by Mode Of Delivery (2020-2032)
11.2.7.3. Market Revenue and Forecast, by Software (2020-2032)
11.3. APAC
11.3.1. Market Revenue and Forecast, by Product (2020-2032)
11.3.2. Market Revenue and Forecast, by Mode Of Delivery (2020-2032)
11.3.3. Market Revenue and Forecast, by Software (2020-2032)
11.3.4. India
11.3.4.1. Market Revenue and Forecast, by Product (2020-2032)
11.3.4.2. Market Revenue and Forecast, by Mode Of Delivery (2020-2032)
11.3.4.3. Market Revenue and Forecast, by Software (2020-2032)
11.3.5. China
11.3.5.1. Market Revenue and Forecast, by Product (2020-2032)
11.3.5.2. Market Revenue and Forecast, by Mode Of Delivery (2020-2032)
11.3.5.3. Market Revenue and Forecast, by Software (2020-2032)
11.3.6. Japan
11.3.6.1. Market Revenue and Forecast, by Product (2020-2032)
11.3.6.2. Market Revenue and Forecast, by Mode Of Delivery (2020-2032)
11.3.6.3. Market Revenue and Forecast, by Software (2020-2032)
11.3.7. Rest of APAC
11.3.7.1. Market Revenue and Forecast, by Product (2020-2032)
11.3.7.2. Market Revenue and Forecast, by Mode Of Delivery (2020-2032)
11.3.7.3. Market Revenue and Forecast, by Software (2020-2032)
11.4. MEA
11.4.1. Market Revenue and Forecast, by Product (2020-2032)
11.4.2. Market Revenue and Forecast, by Mode Of Delivery (2020-2032)
11.4.3. Market Revenue and Forecast, by Software (2020-2032)
11.4.4. GCC
11.4.4.1. Market Revenue and Forecast, by Product (2020-2032)
11.4.4.2. Market Revenue and Forecast, by Mode Of Delivery (2020-2032)
11.4.4.3. Market Revenue and Forecast, by Software (2020-2032)
11.4.5. North Africa
11.4.5.1. Market Revenue and Forecast, by Product (2020-2032)
11.4.5.2. Market Revenue and Forecast, by Mode Of Delivery (2020-2032)
11.4.5.3. Market Revenue and Forecast, by Software (2020-2032)
11.4.6. South Africa
11.4.6.1. Market Revenue and Forecast, by Product (2020-2032)
11.4.6.2. Market Revenue and Forecast, by Mode Of Delivery (2020-2032)
11.4.6.3. Market Revenue and Forecast, by Software (2020-2032)
11.4.7. Rest of MEA
11.4.7.1. Market Revenue and Forecast, by Product (2020-2032)
11.4.7.2. Market Revenue and Forecast, by Mode Of Delivery (2020-2032)
11.4.7.3. Market Revenue and Forecast, by Software (2020-2032)
11.5. Latin America
11.5.1. Market Revenue and Forecast, by Product (2020-2032)
11.5.2. Market Revenue and Forecast, by Mode Of Delivery (2020-2032)
11.5.3. Market Revenue and Forecast, by Software (2020-2032)
11.5.4. Brazil
11.5.4.1. Market Revenue and Forecast, by Product (2020-2032)
11.5.4.2. Market Revenue and Forecast, by Mode Of Delivery (2020-2032)
11.5.4.3. Market Revenue and Forecast, by Software (2020-2032)
11.5.5. Rest of LATAM
11.5.5.1. Market Revenue and Forecast, by Product (2020-2032)
11.5.5.2. Market Revenue and Forecast, by Mode Of Delivery (2020-2032)
11.5.5.3. Market Revenue and Forecast, by Software (2020-2032)
Chapter 12. Company Profiles
12.1. McKesson Corporation
12.1.1. Company Overview
12.1.2. Product Offerings
12.1.3. Financial Performance
12.1.4. Recent Initiatives
12.2. Mediceo Corporation.
12.2.1. Company Overview
12.2.2. Product Offerings
12.2.3. Financial Performance
12.2.4. Recent Initiatives
12.3. Palantir Technologies, Inc
12.3.1. Company Overview
12.3.2. Product Offerings
12.3.3. Financial Performance
12.3.4. Recent Initiatives
12.4. Jump Technologies, Inc.
12.4.1. Company Overview
12.4.2. Product Offerings
12.4.3. Financial Performance
12.4.4. Recent Initiatives
12.5. InterSystems Corporation
12.5.1. Company Overview
12.5.2. Product Offerings
12.5.3. Financial Performance
12.5.4. Recent Initiatives
12.6. Tecsys
12.6.1. Company Overview
12.6.2. Product Offerings
12.6.3. Financial Performance
12.6.4. Recent Initiatives
12.7. Oracle.
12.7.1. Company Overview
12.7.2. Product Offerings
12.7.3. Financial Performance
12.7.4. Recent Initiatives
12.8. SAP
12.8.1. Company Overview
12.8.2. Product Offerings
12.8.3. Financial Performance
12.8.4. Recent Initiatives
12.9. Infor.
12.9.1. Company Overview
12.9.2. Product Offerings
12.9.3. Financial Performance
12.9.4. Recent Initiatives
12.10. Terso Solutions
12.10.1. Company Overview
12.10.2. Product Offerings
12.10.3. Financial Performance
12.10.4. Recent Initiatives
Chapter 13. Research Methodology
13.1. Primary Research
13.2. Secondary Research
13.3. Assumptions
Chapter 14. Appendix
14.1. About Us
14.2. Glossary of Terms
 Cross-segment Market Size and Analysis for
Mentioned Segments
 Additional Company Profiles (Upto 5 With No Cost)
 Additional Countries (Apart From Mentioned Countries)
 Country/Region-specific Report
 Go To Market Strategy
 Region Specific Market Dynamics
 Region Level Market Share
 Import Export Analysis
 Production Analysis
 Others