Telecom API Market Size, Share, Trends, Growth, Revenue, Forecast 2022-2032
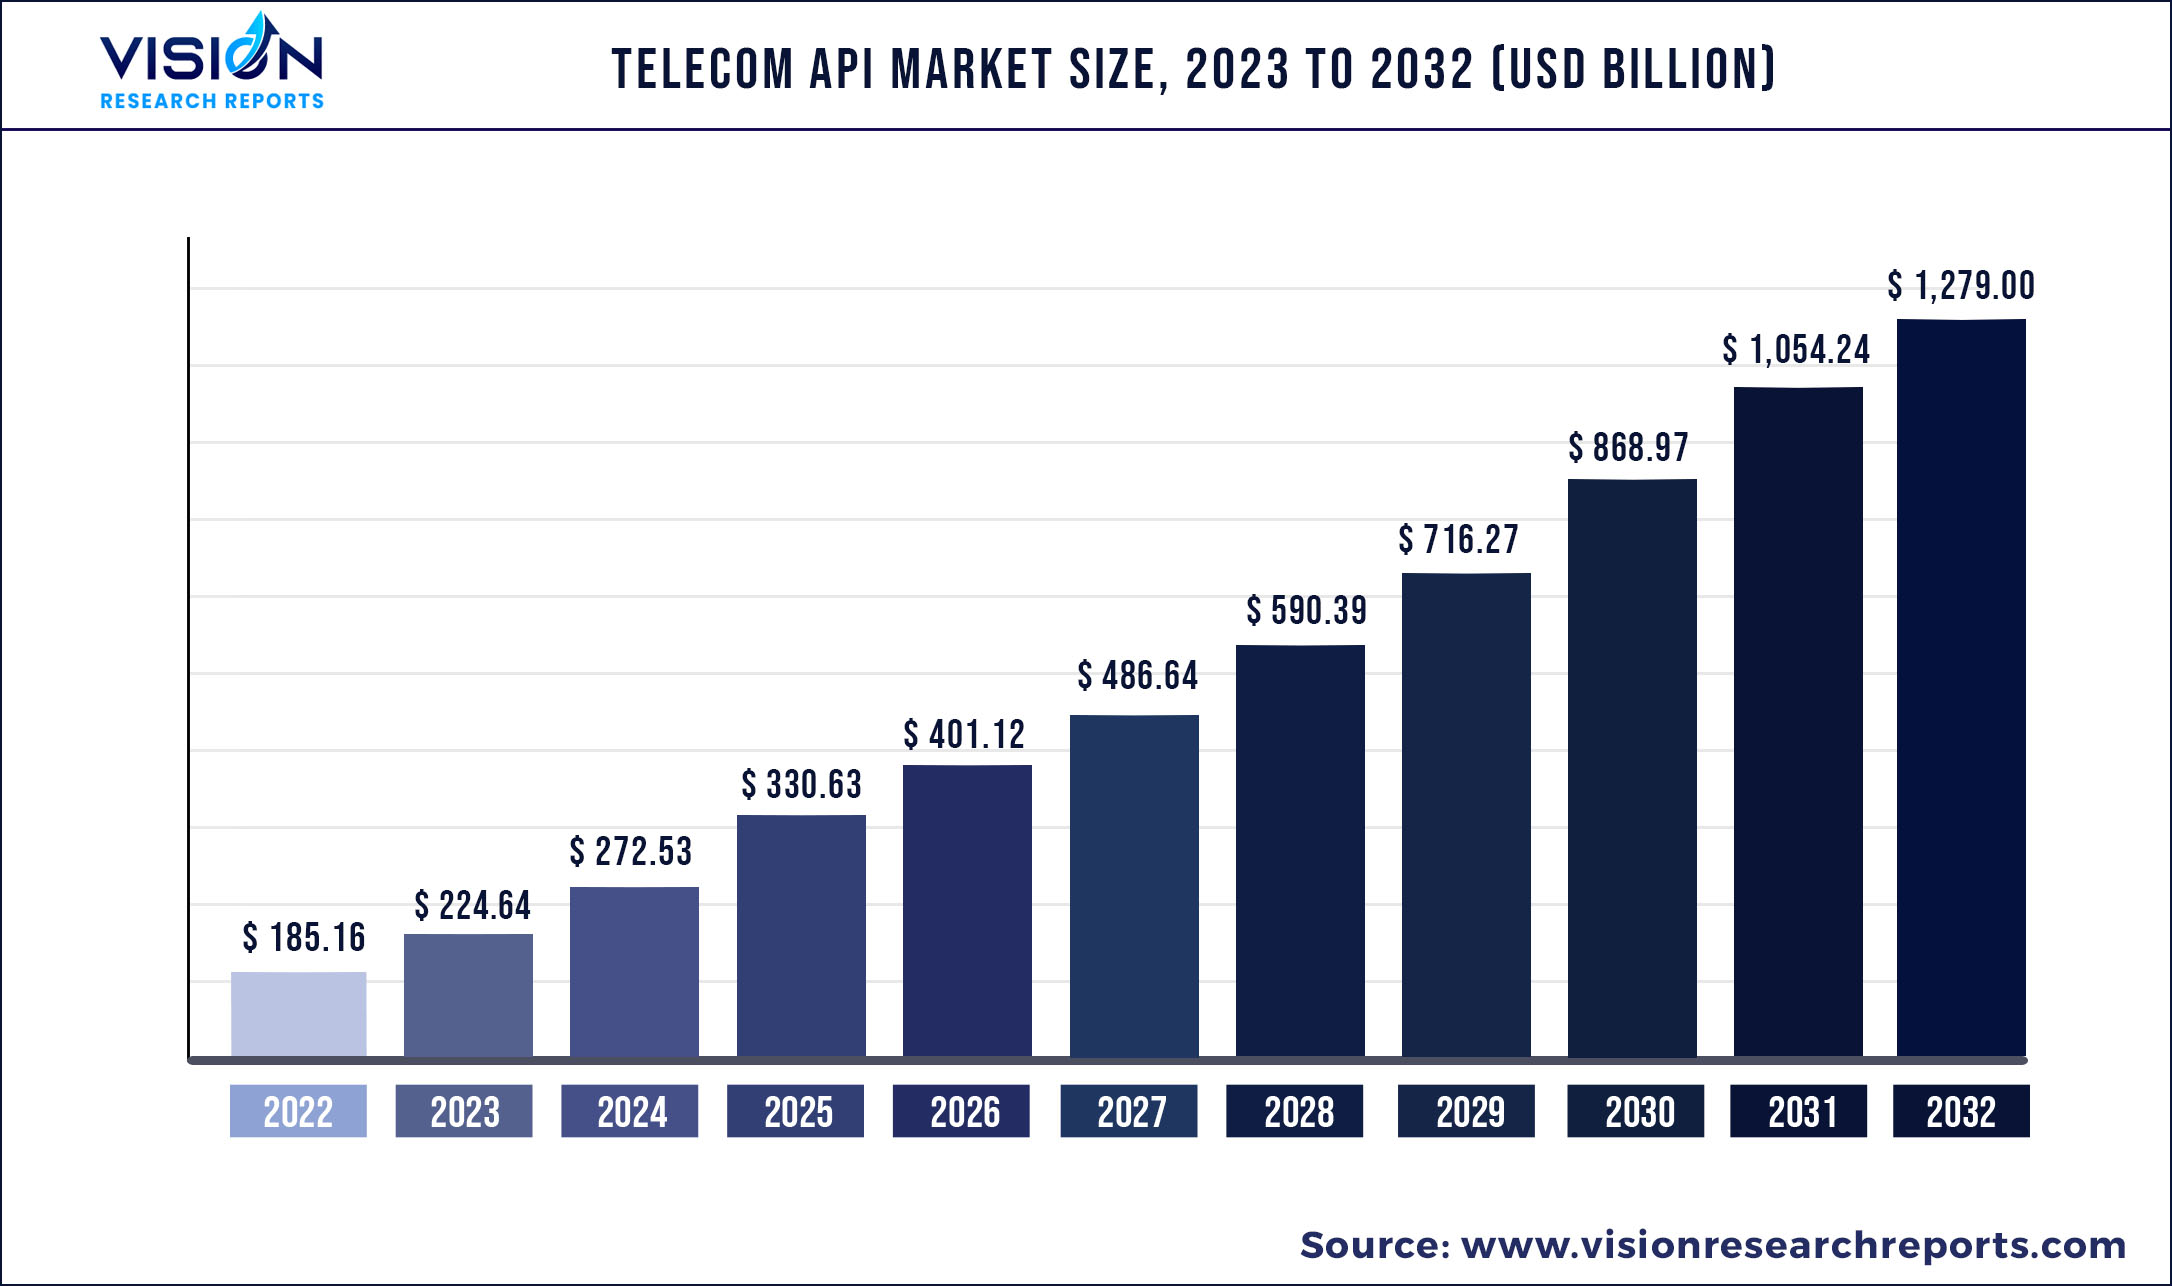
The global telecom API market size was estimated at around USD 185.16 billion in 2022 and it is projected to hit around USD 1,279.00 billion by 2032, growing at a CAGR of 21.32% from 2023 to 2032.
Key Pointers
A telecom application programming interface (API) is used to manage web-based services such as cloud-based, banking, and identity management telecom software by arranging programming instructions and standard protocols. The market provides cost-effective solutions by enhancing the system performance of existing web-based applications. These device and communication protocols facilitate agility in mobile application development as it enables the developers to focus on developing primary functions without the need to develop them from scratch.
Growing penetration of the Internet of Things (IoT), wearable, and device integration in the telecom sector is anticipated to positively impact the market over the forecast period. Telecom APIs allow end-to-end IoT solutions as they act as a singular point of interaction between several nodes within a network and hence reducing the multiple third-party service providers for system integration. With growing IoT penetration, the market for telecom API is anticipated to grow at a phenomenal rate. For instance, according to The State of Mobile 2021 report, a research study published by the GSMA, the total number of global IoT connections is expected to reach USD 25.2 billion by 2025 supporting the telecom API market growth over the forecast period.
Telecom API has prominent applications in all areas involving mobile applications and services such as location tracking apps, messaging apps, online mobile payments, and voice & video calls, among others. With the raising number of mobile service subscribers, the demand for mobile-based technologies has increased significantly in past years further increasing the demand for telecom APIs due to the scalability it offers. For instance, the data published by Global Systems for Mobile Communications Association (GSMA), by the end of 2021, 5.2 billion people subscribed to mobile services and is projected to reach 5.7 billion people by 2025. This may bring new opportunities for the telecom API in mobile-based applications.
The recent increasing number of start-ups launched in the field of telecom API in emerging markets such as the Asia Pacific and Africa are expected to open new opportunities areas for the telecom API service providers during the forecast year. Industry giants such as Google, Vodafone, and communications service providers (CSPs) and technology suppliers Group have developed partnerships with start-ups from these emerging markets to create a nurturing ecosystem for the growth of telecom startups by offering their APIs for application developments thus, propelling the market growth.
Telecom API Market Segmentations:
| By Type | By End-user |
|
Messaging API Web RTC API Payment API IVR API Location API Others |
Enterprise Developers Internal Telecom Developers Partner Developers Long Tail Developers |
Telecom API Market Key Players and Regions Segmentations:
| Key Players | Regions Covered |
|
AT&T Intellectual Property Verizon Telefonica S.A. TWILIO INC. |
North America Europe Asia Pacific Latin America Middle East & Africa |
Chapter 1. Introduction
1.1. Research Objective
1.2. Scope of the Study
1.3. Definition
Chapter 2. Research Methodology
2.1. Research Approach
2.2. Data Sources
2.3. Assumptions & Limitations
Chapter 3. Executive Summary
3.1. Market Snapshot
Chapter 4. Market Variables and Scope
4.1. Introduction
4.2. Market Classification and Scope
4.3. Industry Value Chain Analysis
4.3.1. Raw Material Procurement Analysis
4.3.2. Sales and Distribution Channel Analysis
4.3.3. Downstream Buyer Analysis
Chapter 5. COVID 19 Impact on Telecom API Market
5.1. COVID-19 Landscape: Telecom API Industry Impact
5.2. COVID 19 - Impact Assessment for the Industry
5.3. COVID 19 Impact: Global Major Government Policy
5.4. Market Trends and Opportunities in the COVID-19 Landscape
Chapter 6. Market Dynamics Analysis and Trends
6.1. Market Dynamics
6.1.1. Market Drivers
6.1.2. Market Restraints
6.1.3. Market Opportunities
6.2. Porter’s Five Forces Analysis
6.2.1. Bargaining power of suppliers
6.2.2. Bargaining power of buyers
6.2.3. Threat of substitute
6.2.4. Threat of new entrants
6.2.5. Degree of competition
Chapter 7. Competitive Landscape
7.1.1. Company Market Share/Positioning Analysis
7.1.2. Key Strategies Adopted by Players
7.1.3. Vendor Landscape
7.1.3.1. List of Suppliers
7.1.3.2. List of Buyers
Chapter 8. Global Telecom API Market, By Type
8.1. Telecom API Market, by Type, 2023-2032
8.1.1. Messaging API
8.1.1.1. Market Revenue and Forecast (2020-2032)
8.1.2. Web RTC API
8.1.2.1. Market Revenue and Forecast (2020-2032)
8.1.3. Payment API
8.1.3.1. Market Revenue and Forecast (2020-2032)
8.1.4. IVR API
8.1.4.1. Market Revenue and Forecast (2020-2032)
8.1.5. Location API
8.1.5.1. Market Revenue and Forecast (2020-2032)
8.1.6. Others
8.1.6.1. Market Revenue and Forecast (2020-2032)
Chapter 9. Global Telecom API Market, By End-user
9.1. Telecom API Market, by End-user, 2023-2032
9.1.1. Enterprise Developers
9.1.1.1. Market Revenue and Forecast (2020-2032)
9.1.2. Internal Telecom Developers
9.1.2.1. Market Revenue and Forecast (2020-2032)
9.1.3. Partner Developers
9.1.3.1. Market Revenue and Forecast (2020-2032)
9.1.4. Long Tail Developers
9.1.4.1. Market Revenue and Forecast (2020-2032)
Chapter 10. Global Telecom API Market, Regional Estimates and Trend Forecast
10.1. North America
10.1.1. Market Revenue and Forecast, by Type (2020-2032)
10.1.2. Market Revenue and Forecast, by End-user (2020-2032)
10.1.3. U.S.
10.1.3.1. Market Revenue and Forecast, by Type (2020-2032)
10.1.3.2. Market Revenue and Forecast, by End-user (2020-2032)
10.1.4. Rest of North America
10.1.4.1. Market Revenue and Forecast, by Type (2020-2032)
10.1.4.2. Market Revenue and Forecast, by End-user (2020-2032)
10.2. Europe
10.2.1. Market Revenue and Forecast, by Type (2020-2032)
10.2.2. Market Revenue and Forecast, by End-user (2020-2032)
10.2.3. UK
10.2.3.1. Market Revenue and Forecast, by Type (2020-2032)
10.2.3.2. Market Revenue and Forecast, by End-user (2020-2032)
10.2.4. Germany
10.2.4.1. Market Revenue and Forecast, by Type (2020-2032)
10.2.4.2. Market Revenue and Forecast, by End-user (2020-2032)
10.2.5. France
10.2.5.1. Market Revenue and Forecast, by Type (2020-2032)
10.2.5.2. Market Revenue and Forecast, by End-user (2020-2032)
10.2.6. Rest of Europe
10.2.6.1. Market Revenue and Forecast, by Type (2020-2032)
10.2.6.2. Market Revenue and Forecast, by End-user (2020-2032)
10.3. APAC
10.3.1. Market Revenue and Forecast, by Type (2020-2032)
10.3.2. Market Revenue and Forecast, by End-user (2020-2032)
10.3.3. India
10.3.3.1. Market Revenue and Forecast, by Type (2020-2032)
10.3.3.2. Market Revenue and Forecast, by End-user (2020-2032)
10.3.4. China
10.3.4.1. Market Revenue and Forecast, by Type (2020-2032)
10.3.4.2. Market Revenue and Forecast, by End-user (2020-2032)
10.3.5. Japan
10.3.5.1. Market Revenue and Forecast, by Type (2020-2032)
10.3.5.2. Market Revenue and Forecast, by End-user (2020-2032)
10.3.6. Rest of APAC
10.3.6.1. Market Revenue and Forecast, by Type (2020-2032)
10.3.6.2. Market Revenue and Forecast, by End-user (2020-2032)
10.4. MEA
10.4.1. Market Revenue and Forecast, by Type (2020-2032)
10.4.2. Market Revenue and Forecast, by End-user (2020-2032)
10.4.3. GCC
10.4.3.1. Market Revenue and Forecast, by Type (2020-2032)
10.4.3.2. Market Revenue and Forecast, by End-user (2020-2032)
10.4.4. North Africa
10.4.4.1. Market Revenue and Forecast, by Type (2020-2032)
10.4.4.2. Market Revenue and Forecast, by End-user (2020-2032)
10.4.5. South Africa
10.4.5.1. Market Revenue and Forecast, by Type (2020-2032)
10.4.5.2. Market Revenue and Forecast, by End-user (2020-2032)
10.4.6. Rest of MEA
10.4.6.1. Market Revenue and Forecast, by Type (2020-2032)
10.4.6.2. Market Revenue and Forecast, by End-user (2020-2032)
10.5. Latin America
10.5.1. Market Revenue and Forecast, by Type (2020-2032)
10.5.2. Market Revenue and Forecast, by End-user (2020-2032)
10.5.3. Brazil
10.5.3.1. Market Revenue and Forecast, by Type (2020-2032)
10.5.3.2. Market Revenue and Forecast, by End-user (2020-2032)
10.5.4. Rest of LATAM
10.5.4.1. Market Revenue and Forecast, by Type (2020-2032)
10.5.4.2. Market Revenue and Forecast, by End-user (2020-2032)
Chapter 11. Company Profiles
11.1. AT&T Intellectual Property
11.1.1. Company Overview
11.1.2. Product Offerings
11.1.3. Financial Performance
11.1.4. Recent Initiatives
11.2. Google
11.2.1. Company Overview
11.2.2. Product Offerings
11.2.3. Financial Performance
11.2.4. Recent Initiatives
11.3. Verizon
11.3.1. Company Overview
11.3.2. Product Offerings
11.3.3. Financial Performance
11.3.4. Recent Initiatives
11.4. Telefonica S.A.
11.4.1. Company Overview
11.4.2. Product Offerings
11.4.3. Financial Performance
11.4.4. LTE Scientific
11.5. Telefonica S.A.
11.5.1. Company Overview
11.5.2. Product Offerings
11.5.3. Financial Performance
11.5.4. Recent Initiatives
Chapter 12. Research Methodology
12.1. Primary Research
12.2. Secondary Research
12.3. Assumptions
Chapter 13. Appendix
13.1. About Us
13.2. Glossary of Terms
 Cross-segment Market Size and Analysis for
Mentioned Segments
Additional Company Profiles (Upto 5 With No Cost)
Additional Countries (Apart From Mentioned Countries)
Country/Region-specific Report
Go To Market Strategy
Region Specific Market DynamicsRegion Level Market Share Import Export AnalysisProduction AnalysisOthers
Cross-segment Market Size and Analysis for
Mentioned Segments
Additional Company Profiles (Upto 5 With No Cost)
Additional Countries (Apart From Mentioned Countries)
Country/Region-specific Report
Go To Market Strategy
Region Specific Market DynamicsRegion Level Market Share Import Export AnalysisProduction AnalysisOthers