Urban Air Mobility (UAM) Market Size, Growth, Trends | Report 2023-2032
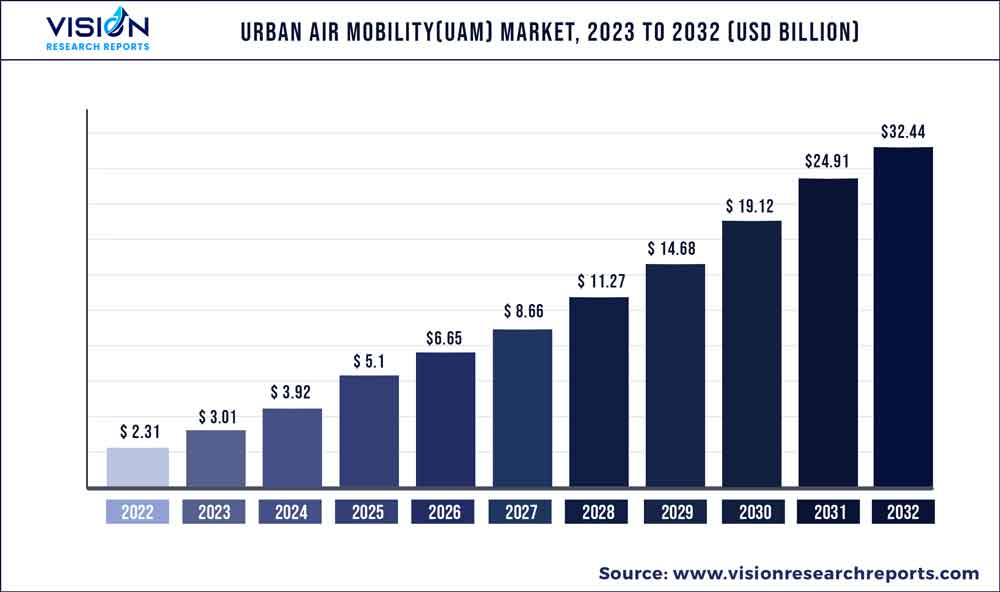
The global urban air mobility (UAM) market was surpassed at USD 2.31 billion in 2022 and is expected to hit around USD 32.44 billion by 2032, growing at a CAGR of 30.24% from 2023 to 2032.
Key Pointers
Report Scope of the Urban Air Mobility (UAM) Market
| Report Coverage | Details |
| Market Size in 2022 | USD 2.31 billion |
| Revenue Forecast by 2032 | USD 32.44 billion |
| Growth rate from 2023 to 2032 | CAGR of 30.24% |
| Base Year | 2022 |
| Forecast Period | 2023 to 2032 |
| Market Analysis (Terms Used) | Value (US$ Million/Billion) or (Volume/Units) |
| Regions Covered | North America, Europe, Asia Pacific, Latin America, Middle East & Africa |
| Companies Covered | Kitty Hawk, Volocopter GmbH, Lilium, The Boeing Company, EHang, Airbus, Neva Aerospace, Workhorse Group Inc., Opener, Pipistrel Group |
Urban air mobility also known as advanced air mobility is a newly developed idea that envisions an accessible, economical, safe, and sustainable air transportation system for delivering cargo, managing emergencies, and moving people throughout metropolitan areas. UAM is a part of a larger ecosystem for on-demand mobility where consumers can dispatch or use urban aviation services, courier services, shared automated vehicles, shared mobility, public transportation, and other cutting-edge and emerging transportation technologies to access mobility and goods delivery services on demand. This could also relieve the pain on many continually overburdened infrastructures such as those in cities with a rapidly growing population. Cities such as Singapore, Dubai, Dallas, and Los Angeles have already been experimenting with Urban Air Mobility projects for some time.
Undoubtedly, traffic congestion causes a significant amount of time to be lost every day around the world. On their commute to work or home, people get caught in traffic, which wastes fuel and reduces productivity. Furthermore, this has an impact on the metropolitan economy. If we don't choose new sustainable solutions, the issue of traffic congestion and its terrible impacts won't be under control. Urban air mobility transportation can help in reducing traffic congestion. Leading transportation businesses are using new technology today and preparing to build intelligent aerial vehicles for urban air mobility. The efficacy and efficiency of transportation will improve with electric aircraft, drones, and flying taxi services. These factors are projected to increase the urban air mobility(UAM) Market demand over the coming years. However, the higher initial investment required for research & development and for developing required infrastructure development for urban air mobility is anticipated to hamper the Urban Air Mobility(UAM) Market Growth.
The industry players are investing a lot of effort in the research and development of smart and unique strategies for sustainable transportation systems. These strategies include product launches, mergers & acquisitions, collaborations, partnerships, and refurbishing of existing technology. In July 2020, Hyundai Motor and Uber has announced a partnership to develop new Uber Air taxis for future urban mobility named SA-1 which is a vertical takeoff and landing vehicle based on electric power. For instance, in May 2022, Volocopter the pioneer in urban air mobility announced a partnership with Microsoft to provide and develop a cloud-based computing system for the company’s eVotel, urban air mobility vehicles, and for autonomous flying vehicles.
Platform Insights
By platform, the air taxi sub-segment dominated the market in 2022. A small aircraft or an electric flying vehicle used for on-demand trips is an air taxi. It is also known as an urban air mobility vehicle and is regarded as an alternative for travel in urban areas with congested roadways. Also, the air taxi has the capability to serve as a transportation system in rural areas. For instance, Jaunt air mobility has decided to set up eVTOL assembly plant in India for air taxis. These are predicted to be the major factors affecting the urban air mobility market size during the forecast period too.
The last mile delivery sub-segment is anticipated to show the fastest growth in 2022. The employment of aerial delivery drones to complete the final mile delivery of the goods is a result of the growing need to increase delivery efficiency and reduce delivery time. Additionally, the global market for last-mile delivery vehicles is expanding due to the introduction of superior UAM vehicles. As a result, multinational logistics firms like DHL International GmbH are forming successful alliances to expand their presence in the market.
platform operations Insights
By platform operations, the autonomous sub-segment dominated the global urban air mobility market share in 2022. The growth in urban air mobility technology is creating a huge potential for a convenient and efficient mode of transportation for people in urban areas. Urban Air Mobility (UAM) is a vision for transportation that could revolutionize social mobility. To realize the UAM goal, it will be essential to increase vehicle automation and autonomous vehicle operations. An economically feasible transportation system that can support the significant anticipated demand will require autonomy. While autonomous systems might be useful for many different aspects of a developed UAM ecosystem, they are crucial for the actual cars. Thousands of flights above a major city are expected to take place simultaneously under a mature system. Vehicles may need response times and degrees of decision-making and control that are beyond the capability of even highly trained human operators because they will operate in practically all weather situations and in close proximity to people, property, and other vehicles. These factors is anticipated to drive the urban air mobility (UAM) Market Share over the coming years.
Range Insights
By range, the intercity sub-segment dominated the global urban air mobility market share in 2022. The development of technology has made urban air travel a viable alternative. Additionally, these cars are outfitted with technology that enables them to carry 2 to 4 passengers over distances between 50 and 250 kilometers. These intercity aircraft also reduce travel times between two cities in half. These aircraft are the only high-speed transportation options that do not necessitate significant infrastructure. As a result of these factors the demand for intercity urban air mobility market share in the forecasted period.
Platform Architecture Insights
By platform architecture, the rotary wings sub-segment dominated the global urban air mobility market share in 2022. The rotary wings are majorly used in urban air mobility vehicles due to the stability provided by the rotary wings. Also, the load-carrying capacity of rotary wings is good and provides better stability in order to provide a safe and secure passenger experience. The rotary wings vehicle are capable to take off and land vertically which means it’s eliminated the requirement of a runway for flying purpose. These factors are anticipated to boost the rotary wings urban air mobility market opportunity in the forecasted time.
Region Insights
By region, Asia-Pacific dominated the global market in 2022 and is projected to remain the fastest-growing sub-segment during the forecast period. Urban traffic congestion and the need for quick transit have caused the Asia-Pacific market for urban air mobility to rise at an exponential rate in recent years. The Asia-Pacific urban air mobility market is anticipated to be driven by increasing R&D spending as well as a growing focus on improving air mobility over the coming years. For instance, in June 2022, Ehang Holdings limited which is world’s leading autonomous vehicle technology platform company and Tianxingjian Cultural Tourism Investment and Development LLC the enterprise of Hunan province government in china has signed the contract of 25 units of EH216 urban air mobility vehicles to promote aerial tourism in Aizhai wonder tourist area in Jishou, Hunan, China.
Urban Air Mobility(UAM) Market Segmentations:
By Platform
By Platform Operations
By Range
By Platform Architecture
By Region
Chapter 1. Introduction
1.1. Research Objective
1.2. Scope of the Study
1.3. Definition
Chapter 2. Research Methodology
2.1. Research Approach
2.2. Data Sources
2.3. Assumptions & Limitations
Chapter 3. Executive Summary
3.1. Market Snapshot
Chapter 4. Market Variables and Scope
4.1. Introduction
4.2. Market Classification and Scope
4.3. Industry Value Chain Analysis
4.3.1. Raw Material Procurement Analysis
4.3.2. Sales and Distribution Channel Analysis
4.3.3. Downstream Buyer Analysis
Chapter 5. COVID 19 Impact on Urban Air Mobility (UAM) Market
5.1. COVID-19 Landscape: Urban Air Mobility (UAM) Industry Impact
5.2. COVID 19 - Impact Assessment for the Industry
5.3. COVID 19 Impact: Global Major Government Policy
5.4. Market Trends and Opportunities in the COVID-19 Landscape
Chapter 6. Market Dynamics Analysis and Trends
6.1. Market Dynamics
6.1.1. Market Drivers
6.1.2. Market Restraints
6.1.3. Market Opportunities
6.2. Porter’s Five Forces Analysis
6.2.1. Bargaining power of suppliers
6.2.2. Bargaining power of buyers
6.2.3. Threat of substitute
6.2.4. Threat of new entrants
6.2.5. Degree of competition
Chapter 7. Competitive Landscape
7.1.1. Company Market Share/Positioning Analysis
7.1.2. Key Strategies Adopted by Players
7.1.3. Vendor Landscape
7.1.3.1. List of Suppliers
7.1.3.2. List of Buyers
Chapter 8. Global Urban Air Mobility (UAM) Market, By Platform
8.1. Urban Air Mobility (UAM) Market, by Platform, 2023-2032
8.1.1. Air Taxis
8.1.1.1. Market Revenue and Forecast (2020-2032)
8.1.2. Air Shuttles and & Air Metro
8.1.2.1. Market Revenue and Forecast (2020-2032)
8.1.3. Personal Air Vehicles
8.1.3.1. Market Revenue and Forecast (2020-2032)
8.1.4. Cargo Air Vehicles
8.1.4.1. Market Revenue and Forecast (2020-2032)
8.1.5. Air Ambulance & Medical Emergency Vehicles
8.1.5.1. Market Revenue and Forecast (2020-2032)
8.1.6. Last-mile Delivery Vehicles
8.1.6.1. Market Revenue and Forecast (2020-2032)
Chapter 9. Global Urban Air Mobility (UAM) Market, By Platform Operations
9.1. Urban Air Mobility (UAM) Market, by Platform Operations, 2023-2032
9.1.1. Piloted
9.1.1.1. Market Revenue and Forecast (2020-2032)
9.1.2. Autonomous
9.1.2.1. Market Revenue and Forecast (2020-2032)
Chapter 10. Global Urban Air Mobility (UAM) Market, By Range
10.1. Urban Air Mobility (UAM) Market, by Range, 2023-2032
10.1.1. Intercity
10.1.1.1. Market Revenue and Forecast (2020-2032)
10.1.2. Intracity
10.1.2.1. Market Revenue and Forecast (2020-2032)
Chapter 11. Global Urban Air Mobility (UAM) Market, By Platform Architecture
11.1. Urban Air Mobility (UAM) Market, by Platform Architecture, 2023-2032
11.1.1. Rotory Wing
11.1.1.1. Market Revenue and Forecast (2020-2032)
11.1.2. Fixed Wing Hybrid
11.1.2.1. Market Revenue and Forecast (2020-2032)
Chapter 12. Global Urban Air Mobility (UAM) Market, Regional Estimates and Trend Forecast
12.1. North America
12.1.1. Market Revenue and Forecast, by Platform (2020-2032)
12.1.2. Market Revenue and Forecast, by Platform Operations (2020-2032)
12.1.3. Market Revenue and Forecast, by Range (2020-2032)
12.1.4. Market Revenue and Forecast, by Platform Architecture (2020-2032)
12.1.5. U.S.
12.1.5.1. Market Revenue and Forecast, by Platform (2020-2032)
12.1.5.2. Market Revenue and Forecast, by Platform Operations (2020-2032)
12.1.5.3. Market Revenue and Forecast, by Range (2020-2032)
12.1.5.4. Market Revenue and Forecast, by Platform Architecture (2020-2032)
12.1.6. Rest of North America
12.1.6.1. Market Revenue and Forecast, by Platform (2020-2032)
12.1.6.2. Market Revenue and Forecast, by Platform Operations (2020-2032)
12.1.6.3. Market Revenue and Forecast, by Range (2020-2032)
12.1.6.4. Market Revenue and Forecast, by Platform Architecture (2020-2032)
12.2. Europe
12.2.1. Market Revenue and Forecast, by Platform (2020-2032)
12.2.2. Market Revenue and Forecast, by Platform Operations (2020-2032)
12.2.3. Market Revenue and Forecast, by Range (2020-2032)
12.2.4. Market Revenue and Forecast, by Platform Architecture (2020-2032)
12.2.5. UK
12.2.5.1. Market Revenue and Forecast, by Platform (2020-2032)
12.2.5.2. Market Revenue and Forecast, by Platform Operations (2020-2032)
12.2.5.3. Market Revenue and Forecast, by Range (2020-2032)
12.2.5.4. Market Revenue and Forecast, by Platform Architecture (2020-2032)
12.2.6. Germany
12.2.6.1. Market Revenue and Forecast, by Platform (2020-2032)
12.2.6.2. Market Revenue and Forecast, by Platform Operations (2020-2032)
12.2.6.3. Market Revenue and Forecast, by Range (2020-2032)
12.2.6.4. Market Revenue and Forecast, by Platform Architecture (2020-2032)
12.2.7. France
12.2.7.1. Market Revenue and Forecast, by Platform (2020-2032)
12.2.7.2. Market Revenue and Forecast, by Platform Operations (2020-2032)
12.2.7.3. Market Revenue and Forecast, by Range (2020-2032)
12.2.7.4. Market Revenue and Forecast, by Platform Architecture (2020-2032)
12.2.8. Rest of Europe
12.2.8.1. Market Revenue and Forecast, by Platform (2020-2032)
12.2.8.2. Market Revenue and Forecast, by Platform Operations (2020-2032)
12.2.8.3. Market Revenue and Forecast, by Range (2020-2032)
12.2.8.4. Market Revenue and Forecast, by Platform Architecture (2020-2032)
12.3. APAC
12.3.1. Market Revenue and Forecast, by Platform (2020-2032)
12.3.2. Market Revenue and Forecast, by Platform Operations (2020-2032)
12.3.3. Market Revenue and Forecast, by Range (2020-2032)
12.3.4. Market Revenue and Forecast, by Platform Architecture (2020-2032)
12.3.5. India
12.3.5.1. Market Revenue and Forecast, by Platform (2020-2032)
12.3.5.2. Market Revenue and Forecast, by Platform Operations (2020-2032)
12.3.5.3. Market Revenue and Forecast, by Range (2020-2032)
12.3.5.4. Market Revenue and Forecast, by Platform Architecture (2020-2032)
12.3.6. China
12.3.6.1. Market Revenue and Forecast, by Platform (2020-2032)
12.3.6.2. Market Revenue and Forecast, by Platform Operations (2020-2032)
12.3.6.3. Market Revenue and Forecast, by Range (2020-2032)
12.3.6.4. Market Revenue and Forecast, by Platform Architecture (2020-2032)
12.3.7. Japan
12.3.7.1. Market Revenue and Forecast, by Platform (2020-2032)
12.3.7.2. Market Revenue and Forecast, by Platform Operations (2020-2032)
12.3.7.3. Market Revenue and Forecast, by Range (2020-2032)
12.3.7.4. Market Revenue and Forecast, by Platform Architecture (2020-2032)
12.3.8. Rest of APAC
12.3.8.1. Market Revenue and Forecast, by Platform (2020-2032)
12.3.8.2. Market Revenue and Forecast, by Platform Operations (2020-2032)
12.3.8.3. Market Revenue and Forecast, by Range (2020-2032)
12.3.8.4. Market Revenue and Forecast, by Platform Architecture (2020-2032)
12.4. MEA
12.4.1. Market Revenue and Forecast, by Platform (2020-2032)
12.4.2. Market Revenue and Forecast, by Platform Operations (2020-2032)
12.4.3. Market Revenue and Forecast, by Range (2020-2032)
12.4.4. Market Revenue and Forecast, by Platform Architecture (2020-2032)
12.4.5. GCC
12.4.5.1. Market Revenue and Forecast, by Platform (2020-2032)
12.4.5.2. Market Revenue and Forecast, by Platform Operations (2020-2032)
12.4.5.3. Market Revenue and Forecast, by Range (2020-2032)
12.4.5.4. Market Revenue and Forecast, by Platform Architecture (2020-2032)
12.4.6. North Africa
12.4.6.1. Market Revenue and Forecast, by Platform (2020-2032)
12.4.6.2. Market Revenue and Forecast, by Platform Operations (2020-2032)
12.4.6.3. Market Revenue and Forecast, by Range (2020-2032)
12.4.6.4. Market Revenue and Forecast, by Platform Architecture (2020-2032)
12.4.7. South Africa
12.4.7.1. Market Revenue and Forecast, by Platform (2020-2032)
12.4.7.2. Market Revenue and Forecast, by Platform Operations (2020-2032)
12.4.7.3. Market Revenue and Forecast, by Range (2020-2032)
12.4.7.4. Market Revenue and Forecast, by Platform Architecture (2020-2032)
12.4.8. Rest of MEA
12.4.8.1. Market Revenue and Forecast, by Platform (2020-2032)
12.4.8.2. Market Revenue and Forecast, by Platform Operations (2020-2032)
12.4.8.3. Market Revenue and Forecast, by Range (2020-2032)
12.4.8.4. Market Revenue and Forecast, by Platform Architecture (2020-2032)
12.5. Latin America
12.5.1. Market Revenue and Forecast, by Platform (2020-2032)
12.5.2. Market Revenue and Forecast, by Platform Operations (2020-2032)
12.5.3. Market Revenue and Forecast, by Range (2020-2032)
12.5.4. Market Revenue and Forecast, by Platform Architecture (2020-2032)
12.5.5. Brazil
12.5.5.1. Market Revenue and Forecast, by Platform (2020-2032)
12.5.5.2. Market Revenue and Forecast, by Platform Operations (2020-2032)
12.5.5.3. Market Revenue and Forecast, by Range (2020-2032)
12.5.5.4. Market Revenue and Forecast, by Platform Architecture (2020-2032)
12.5.6. Rest of LATAM
12.5.6.1. Market Revenue and Forecast, by Platform (2020-2032)
12.5.6.2. Market Revenue and Forecast, by Platform Operations (2020-2032)
12.5.6.3. Market Revenue and Forecast, by Range (2020-2032)
12.5.6.4. Market Revenue and Forecast, by Platform Architecture (2020-2032)
Chapter 13. Company Profiles
13.1. Kitty Hawk
13.1.1. Company Overview
13.1.2. Product Offerings
13.1.3. Financial Performance
13.1.4. Recent Initiatives
13.2. Volocopter GmbH
13.2.1. Company Overview
13.2.2. Product Offerings
13.2.3. Financial Performance
13.2.4. Recent Initiatives
13.3. Lilium
13.3.1. Company Overview
13.3.2. Product Offerings
13.3.3. Financial Performance
13.3.4. Recent Initiatives
13.4. The Boeing Company
13.4.1. Company Overview
13.4.2. Product Offerings
13.4.3. Financial Performance
13.4.4. Recent Initiatives
13.5. EHang
13.5.1. Company Overview
13.5.2. Product Offerings
13.5.3. Financial Performance
13.5.4. Recent Initiatives
13.6. Airbus
13.6.1. Company Overview
13.6.2. Product Offerings
13.6.3. Financial Performance
13.6.4. Recent Initiatives
13.7. Neva Aerospace
13.7.1. Company Overview
13.7.2. Product Offerings
13.7.3. Financial Performance
13.7.4. Recent Initiatives
13.8. Workhorse Group Inc.
13.8.1. Company Overview
13.8.2. Product Offerings
13.8.3. Financial Performance
13.8.4. Recent Initiatives
13.9. Opener
13.9.1. Company Overview
13.9.2. Product Offerings
13.9.3. Financial Performance
13.9.4. Recent Initiatives
13.10. Pipistrel Group
13.10.1. Company Overview
13.10.2. Product Offerings
13.10.3. Financial Performance
13.10.4. Recent Initiatives
Chapter 14. Research Methodology
14.1. Primary Research
14.2. Secondary Research
14.3. Assumptions
Chapter 15. Appendix
15.1. About Us
15.2. Glossary of Terms
 Cross-segment Market Size and Analysis for
Mentioned Segments
Additional Company Profiles (Upto 5 With No Cost)
Additional Countries (Apart From Mentioned Countries)
Country/Region-specific Report
Go To Market Strategy
Region Specific Market DynamicsRegion Level Market Share Import Export AnalysisProduction AnalysisOthers
Cross-segment Market Size and Analysis for
Mentioned Segments
Additional Company Profiles (Upto 5 With No Cost)
Additional Countries (Apart From Mentioned Countries)
Country/Region-specific Report
Go To Market Strategy
Region Specific Market DynamicsRegion Level Market Share Import Export AnalysisProduction AnalysisOthers