U.S. And Europe Pharmaceutical Manufacturing Market Size, Share | Report 2023-2032
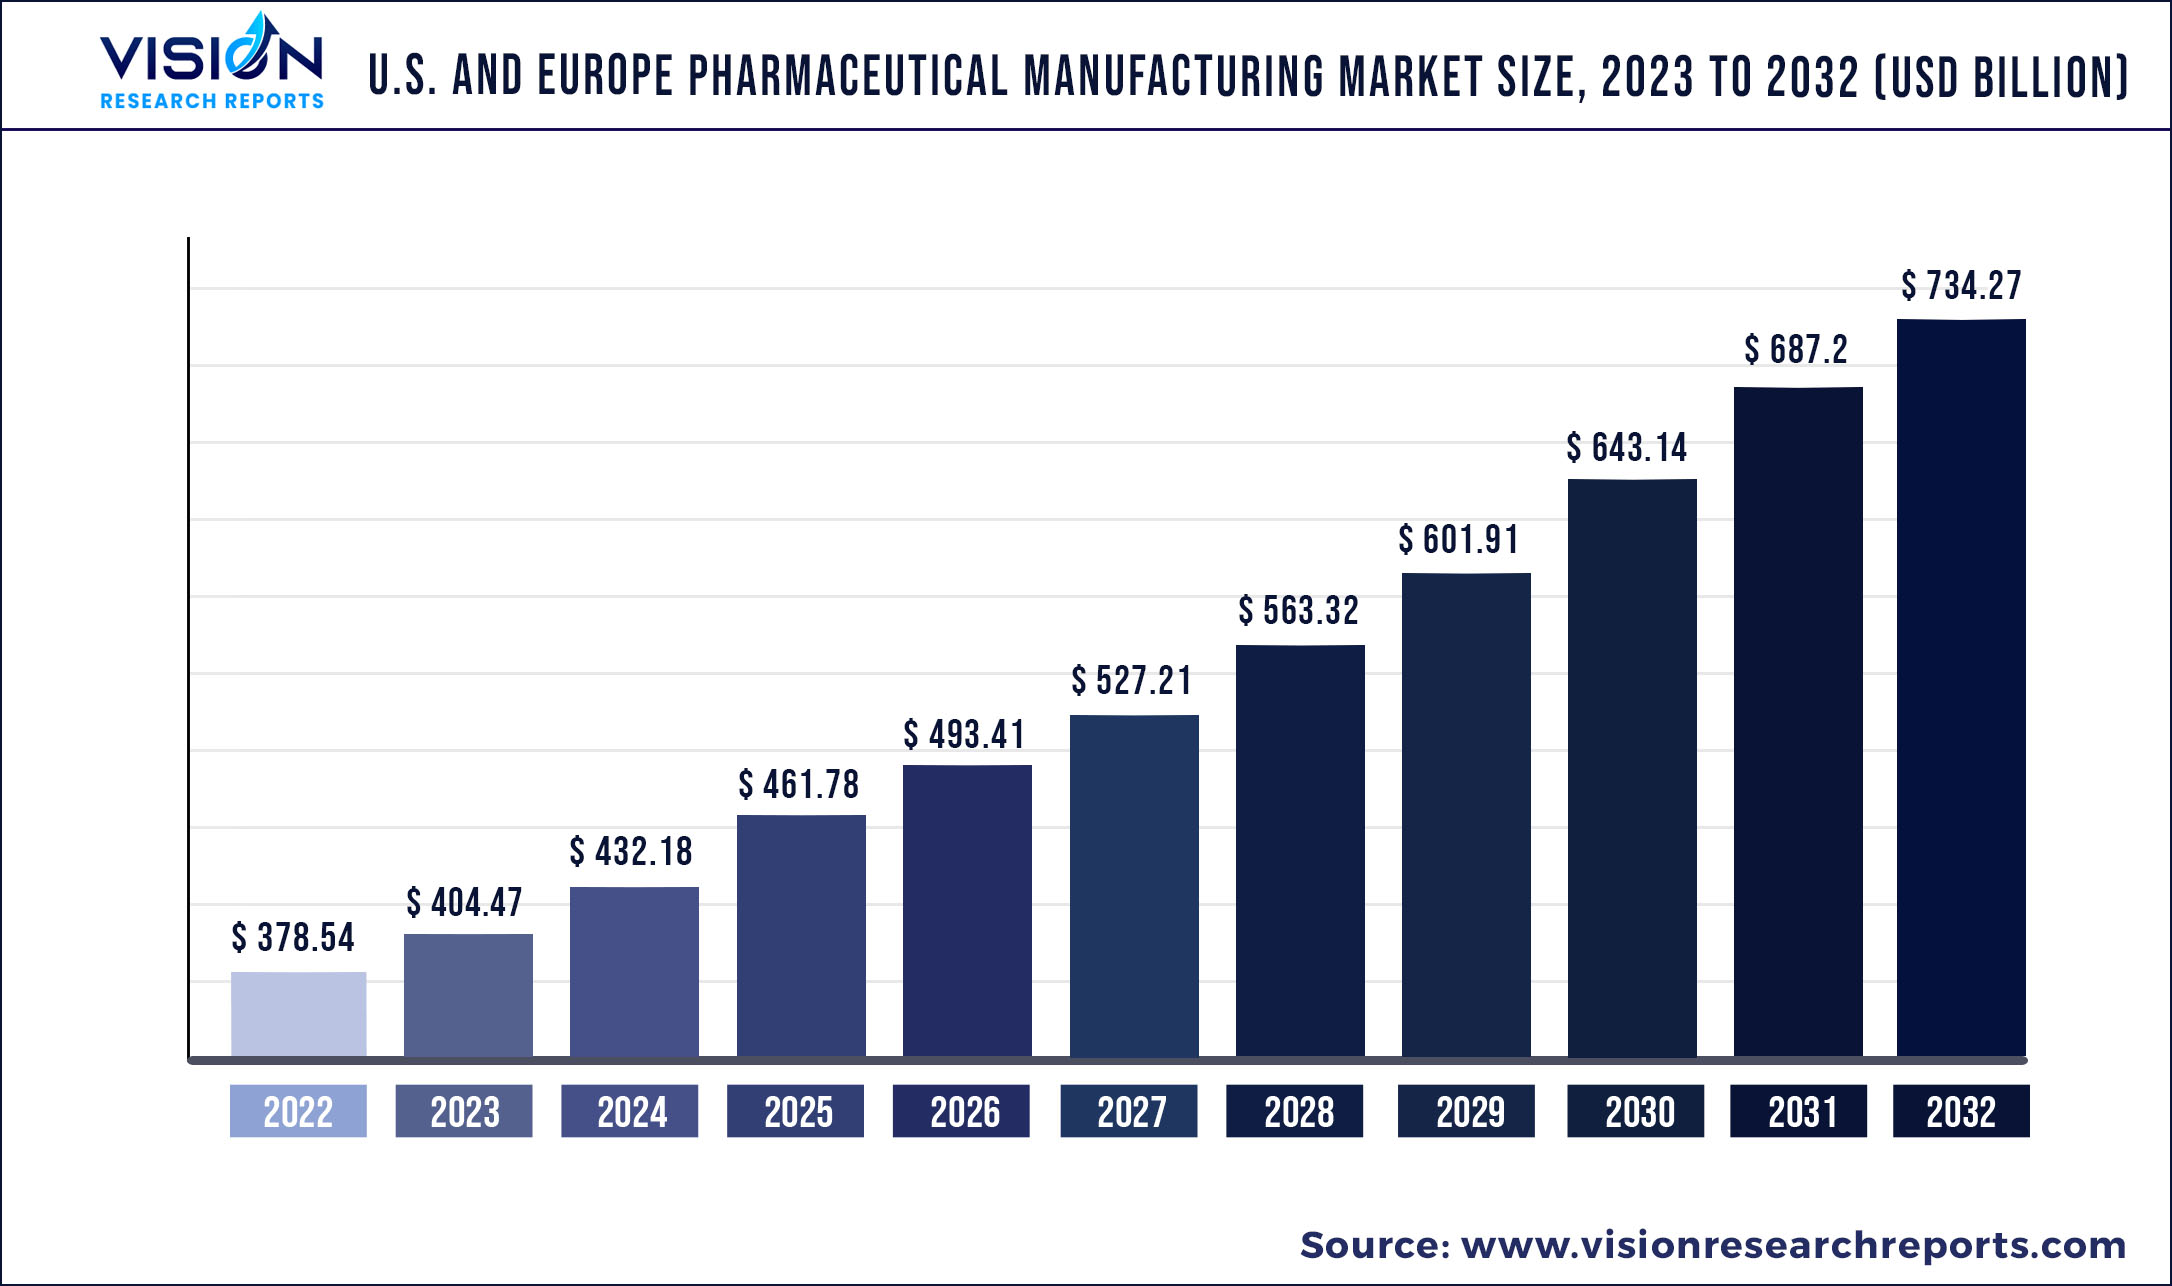
The U.S. and Europe pharmaceutical manufacturing market was estimated at USD 378.54 billion in 2022 and it is expected to surpass around USD 734.27 billion by 2032, poised to grow at a CAGR of 6.85% from 2023 to 2032.
Key Pointers
| Report Coverage | Details |
| Market Size in 2022 | USD 378.54 billion |
| Revenue Forecast by 2032 | USD 734.27 billion |
| Growth rate from 2023 to 2032 | CAGR of 6.85% |
| Base Year | 2022 |
| Forecast Period | 2023 to 2032 |
| Companies Covered | Pfizer Inc.; Novartis AG, F. Hoffmann-La Roche Ltd; Merck & Co., Inc.; Johnson & Johnson Services, Inc.; GSK plc; Sanofi; AbbVie Inc.; Lonza; Samsung Biologics; Lily |
The introduction of novel technologies, adoption of more efficient & cost-effective manufacturing processes, increasing investment by key pharmaceutical manufactures, and a large number of pharmaceutical manufacturing plants in the region are expected to increase the market growth. Moreover, the shift in paradigm toward data-rich, smart, paperless, integrated operations, and increasing penetration of automation & artificial intelligence has led to precise & efficient manufacturing. Such ongoing developments and progress have transformed the U.S. & Europe pharmaceutical manufacturing industry.
The rise in R&D spending by pharmaceutical companies is escalating the pharmaceutical manufacturing market expansion. Pharmaceutical manufacturers are investing heavily to cut down expenses, accelerate the speed of production, maintain high quality, and engage in the development of novel products. It is reported that in 2021, the 15 largest pharmaceutical companies invested around USD 133 billion in R&D. For instance, in 2021, Pfizer, Inc. spent 17.0% of its revenue on R&D. Similarly, F. Hoffmann-La Roche Ltd. spent around 27.1% of its revenue on R&D in 2021. On the other hand, small-sized companies have less revenue generation; therefore, they often spend significantly higher amounts of their budget on R&D.
Pharmaceutical companies are being encouraged to streamline their processes and reduce the costs of drug development and manufacturing processes. Thus, companies are optimizing complex processes by adopting cloud computing and AI technologies. For instance, in April 2022, Sanofi announced a partnership with McLaren to develop advanced pharmaceutical manufacturing sites in many countries. Thus, advancements in pharmaceutical manufacturing technologies and optimization of processes are facilitating the market growth.
Moreover, the surge in new product approvals by regulatory authorities is anticipated to facilitate the U.S. & Europe pharmaceutical manufacturing market. For instance, in 2021, the CDER, a division of the U.S. FDA approved around 50 new drugs under New Drug Applications and Biologics License Applications (BLAs). The approval of novel drugs is expected to increase the demand for CMOs in the U.S. and Europe. Moreover, the increasing number of clinical trials to develop new therapeutic drugs have created potential growth opportunities for the market. For instance, according to the U.S. National Library of Medicine, around 31% of trials are being conducted in the U.S. only.
Mergers & acquisitions in the pharmaceutical industry have grown in the past few years. For instance, in April 2022, FUJIFILM Diosynth Biotechnologies acquired Atara Biotherapeutics, Inc.’s cell therapy manufacturing facility. This would further strengthen the company’s product portfolio. Similarly, in August 2020, Catalent, Inc. signed an agreement with AstraZeneca to further support the manufacturing of AstraZeneca’s COVID-19 vaccine, AZD1222. This is aimed to increase the company’s revenue generation. Moreover, pharmaceutical companies are collaborating with contract manufacturing organizations to outsource the production of pharmaceutical products.
U.S. And Europe Pharmaceutical Manufacturing Market Segmentations:
| By Product Type | By Drug Development Type | By Formulation | By Route of Administration |
|
Large Molecule Small Molecule |
Outsource In-house |
Tablets Capsules Injectables Sprays Suspensions Powders Others |
Oral Topical Parenterals Inhalations Others |
| By Therapy Area | By Prescription Requirements | By Age Type | By Sales Channel |
|
Cardiovascular Diseases Pain Diabetes Cancer Respiratory Diseases Others |
Prescription Medicines Over-the-counter (OTC) Medicines |
Children & Adolescents Adults Geriatric |
Retail Non-retail |
Chapter 1. Introduction
1.1. Research Objective
1.2. Scope of the Study
1.3. Definition
Chapter 2. Research Methodology
2.1. Research Approach
2.2. Data Sources
2.3. Assumptions & Limitations
Chapter 3. Executive Summary
3.1. Market Snapshot
Chapter 4. Market Variables and Scope
4.1. Introduction
4.2. Market Classification and Scope
4.3. Industry Value Chain Analysis
4.3.1. Raw Material Procurement Analysis
4.3.2. Sales and Distribution Channel Analysis
4.3.3. Downstream Buyer Analysis
Chapter 5. Market Dynamics Analysis and Trends
5.1. Market Dynamics
5.1.1. Market Drivers
5.1.2. Market Restraints
5.1.3. Market Opportunities
5.2. Porter’s Five Forces Analysis
5.2.1. Bargaining power of suppliers
5.2.2. Bargaining power of buyers
5.2.3. Threat of substitute
5.2.4. Threat of new entrants
5.2.5. Degree of competition
Chapter 6. Competitive Landscape
6.1.1. Company Market Share/Positioning Analysis
6.1.2. Key Strategies Adopted by Players
6.1.3. Vendor Landscape
6.1.3.1. List of Suppliers
6.1.3.2. List of Buyers
Chapter 7. U.S. And Europe Pharmaceutical Manufacturing Market, By Product Type
7.1. U.S. And Europe Pharmaceutical Manufacturing Market, by Product Type, 2023-2032
7.1.1. Large Molecule
7.1.1.1. Market Revenue and Forecast (2020-2032)
7.1.2. Small Molecule
7.1.2.1. Market Revenue and Forecast (2020-2032)
Chapter 8. U.S. And Europe Pharmaceutical Manufacturing Market, By Drug Development Type
8.1. U.S. And Europe Pharmaceutical Manufacturing Market, by Drug Development Type, 2023-2032
8.1.1. Outsource
8.1.1.1. Market Revenue and Forecast (2020-2032)
8.1.2. In-house
8.1.2.1. Market Revenue and Forecast (2020-2032)
Chapter 9. U.S. And Europe Pharmaceutical Manufacturing Market, By Formulation
9.1. U.S. And Europe Pharmaceutical Manufacturing Market, by Formulation, 2023-2032
9.1.1. Tablets
9.1.1.1. Market Revenue and Forecast (2020-2032)
9.1.2. Capsules
9.1.2.1. Market Revenue and Forecast (2020-2032)
9.1.3. Injectables
9.1.3.1. Market Revenue and Forecast (2020-2032)
9.1.4. Sprays
9.1.4.1. Market Revenue and Forecast (2020-2032)
9.1.5. Suspensions
9.1.5.1. Market Revenue and Forecast (2020-2032)
9.1.6. Powders
9.1.6.1. Market Revenue and Forecast (2020-2032)
9.1.7. Others
9.1.7.1. Market Revenue and Forecast (2020-2032)
Chapter 10. U.S. And Europe Pharmaceutical Manufacturing Market, By Route of Administration
10.1. U.S. And Europe Pharmaceutical Manufacturing Market, by Route of Administration, 2023-2032
10.1.1. Oral
10.1.1.1. Market Revenue and Forecast (2020-2032)
10.1.2. Topical
10.1.2.1. Market Revenue and Forecast (2020-2032)
10.1.3. Parenterals
10.1.3.1. Market Revenue and Forecast (2020-2032)
10.1.4. Inhalations
10.1.4.1. Market Revenue and Forecast (2020-2032)
10.1.5. Others
10.1.5.1. Market Revenue and Forecast (2020-2032)
Chapter 11. U.S. And Europe Pharmaceutical Manufacturing Market, By Therapy Area
11.1. U.S. And Europe Pharmaceutical Manufacturing Market, by Therapy Area, 2023-2032
11.1.1. Cardiovascular Diseases
11.1.1.1. Market Revenue and Forecast (2020-2032)
11.1.2. Pain
11.1.2.1. Market Revenue and Forecast (2020-2032)
11.1.3. Diabetes
11.1.3.1. Market Revenue and Forecast (2020-2032)
11.1.4. Cancer
11.1.4.1. Market Revenue and Forecast (2020-2032)
11.1.5. Respiratory Diseases
11.1.5.1. Market Revenue and Forecast (2020-2032)
11.1.6. Others
11.1.6.1. Market Revenue and Forecast (2020-2032)
Chapter 12. U.S. And Europe Pharmaceutical Manufacturing Market, By Prescription Requirements
12.1. U.S. And Europe Pharmaceutical Manufacturing Market, by Prescription Requirements, 2023-2032
12.1.1. Prescription Medicines
12.1.1.1. Market Revenue and Forecast (2020-2032)
12.1.2. Over-the-counter (OTC) Medicines
12.1.2.1. Market Revenue and Forecast (2020-2032)
Chapter 13. U.S. And Europe Pharmaceutical Manufacturing Market, By Age Type
13.1. U.S. And Europe Pharmaceutical Manufacturing Market, by Age Type, 2023-2032
13.1.1. Children & Adolescents
13.1.1.1. Market Revenue and Forecast (2020-2032)
13.1.2. Adults
13.1.2.1. Market Revenue and Forecast (2020-2032)
13.1.3. Geriatric
13.1.3.1. Market Revenue and Forecast (2020-2032)
Chapter 14. U.S. And Europe Pharmaceutical Manufacturing Market, By Sales Channel
14.1. U.S. And Europe Pharmaceutical Manufacturing Market, by Sales Channel, 2023-2032
14.1.1. Retail
14.1.1.1. Market Revenue and Forecast (2020-2032)
14.1.2. Non-retail
14.1.2.1. Market Revenue and Forecast (2020-2032)
Chapter 15. U.S. And Europe Pharmaceutical Manufacturing Market, Regional Estimates and Trend Forecast
15.1. U.S.
15.1.1. Market Revenue and Forecast, by Product Type (2020-2032)
15.1.2. Market Revenue and Forecast, by Drug Development Type (2020-2032)
15.1.3. Market Revenue and Forecast, by Formulation (2020-2032)
15.1.4. Market Revenue and Forecast, by Route of Administration (2020-2032)
15.1.5. Market Revenue and Forecast, by Therapy Area (2020-2032)
15.1.6. Market Revenue and Forecast, by Age Type (2020-2032)
15.1.7. Market Revenue and Forecast, by Prescription Requirements (2020-2032)
15.1.8. Market Revenue and Forecast, by Sales Channel (2020-2032)
15.2. Europe
15.2.1. Market Revenue and Forecast, by Product Type (2020-2032)
15.2.2. Market Revenue and Forecast, by Drug Development Type (2020-2032)
15.2.3. Market Revenue and Forecast, by Formulation (2020-2032)
15.2.4. Market Revenue and Forecast, by Route of Administration (2020-2032)
15.2.5. Market Revenue and Forecast, by Therapy Area (2020-2032)
15.2.6. Market Revenue and Forecast, by Age Type (2020-2032)
15.2.7. Market Revenue and Forecast, by Prescription Requirements (2020-2032)
15.2.8. Market Revenue and Forecast, by Sales Channel (2020-2032)
Chapter 16. Company Profiles
16.1. Pfizer Inc.
16.1.1. Company Overview
16.1.2. Product Offerings
16.1.3. Financial Performance
16.1.4. Recent Initiatives
16.2. Novartis AG
16.2.1. Company Overview
16.2.2. Product Offerings
16.2.3. Financial Performance
16.2.4. Recent Initiatives
16.3. F. Hoffmann-La Roche Ltd
16.3.1. Company Overview
16.3.2. Product Offerings
16.3.3. Financial Performance
16.3.4. Recent Initiatives
16.4. Merck & Co., Inc.
16.4.1. Company Overview
16.4.2. Product Offerings
16.4.3. Financial Performance
16.4.4. Recent Initiatives
16.5. Johnson & Johnson Services, Inc.
16.5.1. Company Overview
16.5.2. Product Offerings
16.5.3. Financial Performance
16.5.4. Recent Initiatives
16.6. GSK plc
16.6.1. Company Overview
16.6.2. Product Offerings
16.6.3. Financial Performance
16.6.4. Recent Initiatives
16.7. Sanofi
16.7.1. Company Overview
16.7.2. Product Offerings
16.7.3. Financial Performance
16.7.4. Recent Initiatives
16.8. AbbVie Inc.
16.8.1. Company Overview
16.8.2. Product Offerings
16.8.3. Financial Performance
16.8.4. Recent Initiatives
16.9. Lonza
16.9.1. Company Overview
16.9.2. Product Offerings
16.9.3. Financial Performance
16.9.4. Recent Initiatives
16.10. Samsung Biologics
16.10.1. Company Overview
16.10.2. Product Offerings
16.10.3. Financial Performance
16.10.4. Recent Initiatives
16.11. Lily
16.11.1. Company Overview
16.11.2. Product Offerings
16.11.3. Financial Performance
16.11.4. Recent Initiatives
Chapter 17. Research Methodology
17.1. Primary Research
17.2. Secondary Research
17.3. Assumptions
Chapter 18. Appendix
18.1. About Us
18.2. Glossary of Terms
 Cross-segment Market Size and Analysis for
Mentioned Segments
Additional Company Profiles (Upto 5 With No Cost)
Additional Countries (Apart From Mentioned Countries)
Country/Region-specific Report
Go To Market Strategy
Region Specific Market DynamicsRegion Level Market Share Import Export AnalysisProduction AnalysisOthers
Cross-segment Market Size and Analysis for
Mentioned Segments
Additional Company Profiles (Upto 5 With No Cost)
Additional Countries (Apart From Mentioned Countries)
Country/Region-specific Report
Go To Market Strategy
Region Specific Market DynamicsRegion Level Market Share Import Export AnalysisProduction AnalysisOthers