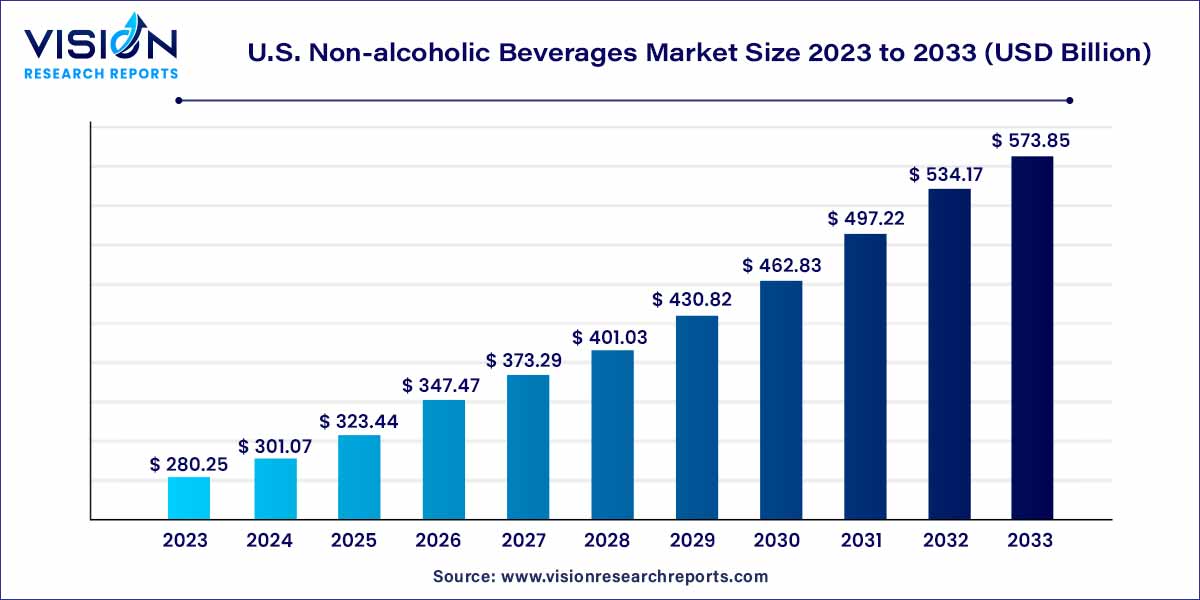
The U.S. non-alcoholic beverages market size was estimated at around USD 280.25 billion in 2023 and it is projected to hit around USD 573.85 billion by 2033, growing at a CAGR of 7.43% from 2024 to 2033. The U.S. non-alcoholic beverages market is driven by changing consumer preferences, health consciousness, and innovative product offerings.

The growth of the U.S. non-alcoholic beverages market can be attributed to several key factors. Firstly, an increasing emphasis on health and wellness has driven consumers to seek healthier beverage options, leading to a rising demand for natural, low-calorie, and functional drinks. Secondly, continuous innovation and product development within the industry play a pivotal role, with companies investing in research and development to introduce novel, appealing beverages that cater to evolving consumer preferences. Additionally, the diversification of product offerings, including a wide range of carbonated soft drinks, juices, energy drinks, and ready-to-drink teas, contributes to the market's expansion. Furthermore, the regulatory landscape, though challenging, fosters transparency and compliance, ensuring that consumers are informed about the nutritional aspects of the beverages they consume. As companies navigate challenges such as competition and environmental concerns, they also find opportunities for differentiation, sustainability, and meeting the growing demand for unique and eco-friendly offerings. In essence, the U.S. non-alcoholic beverages market thrives on a combination of health-conscious consumer trends, innovative product development, and strategic responses to industry challenges.
In 2023, the carbonated soft drinks (CSD) segment emerged as the leader, capturing the largest revenue share at 34%. Known for their effervescence and diverse array of flavors catering to various taste preferences, CSDs have gained popularity. The widespread availability of carbonated soft drinks in various packaging sizes further contributes to their appeal, establishing them as the preferred choice for consumers seeking a convenient and gratifying thirst-quencher.
Over the forecast period, the functional beverages segment is anticipated to experience substantial growth in the U.S. non-alcoholic beverages market. This growth is attributed to the escalating awareness and significance of health and fitness among consumers. With a growing emphasis on health consciousness, there is an increasing demand for beverages that not only offer refreshment but also boast functional benefits. Functional beverages, enriched with vitamins, antioxidants, minerals, and other health-promoting ingredients, align with the broader goal of preventive healthcare and overall well-being
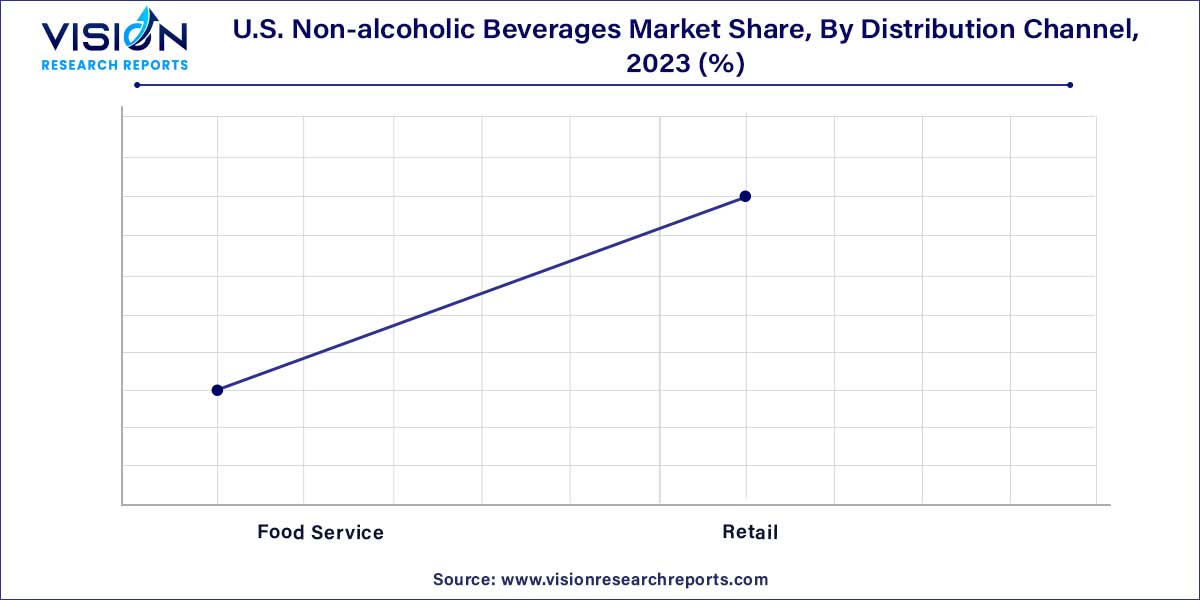
In 2023, the retail segment asserted its dominance in the U.S. non-alcoholic beverages market share. This segment encompasses supermarkets, hypermarkets, internet retailers, and various other channels. The prevalence of multiple brands and products available under one roof makes supermarkets and hypermarkets the primary contributors to this substantial market share. Major players in the retail landscape, including Whole Foods, Target, Aldi, and Walmart, are expanding their selections in the non-alcoholic market, contributing to the segment's leadership.

The food service segment is anticipated to experience rapid growth during the forecast period. As one of the primary distribution channels for non-alcoholic beverages, food service benefits from the busy lifestyles and increased disposable income of people worldwide, leading them to opt for meals in restaurants. The emergence of new eateries catering to diverse tastes and beverage preferences further propels this trend. Many full-service restaurants are adopting comprehensive dining options, analyzing local dietary trends, and innovating their offerings to align with consumer preferences. This strategic approach not only enhances food service but also increases customer visits due to the diversified and appealing choices.
By Product
By Distribution channel
Chapter 1. Introduction
1.1. Research Objective
1.2. Scope of the Study
1.3. Definition
Chapter 2. Research Methodology
2.1. Research Approach
2.2. Data Sources
2.3. Assumptions & Limitations
Chapter 3. Executive Summary
3.1. Market Snapshot
Chapter 4. Market Variables and Scope
4.1. Introduction
4.2. Market Classification and Scope
4.3. Industry Value Chain Analysis
4.3.1. Raw Material Procurement Analysis
4.3.2. Sales and Distribution Channel Analysis
4.3.3. Downstream Buyer Analysis
Chapter 5. COVID 19 Impact on U.S. Non-alcoholic Beverages Market
5.1. COVID-19 Landscape: U.S. Non-alcoholic Beverages Industry Impact
5.2. COVID 19 - Impact Assessment for the Industry
5.3. COVID 19 Impact: Global Major Government Policy
5.4. Market Trends and Opportunities in the COVID-19 Landscape
Chapter 6. Market Dynamics Analysis and Trends
6.1. Market Dynamics
6.1.1. Market Drivers
6.1.2. Market Restraints
6.1.3. Market Opportunities
6.2. Porter’s Five Forces Analysis
6.2.1. Bargaining power of suppliers
6.2.2. Bargaining power of buyers
6.2.3. Threat of substitute
6.2.4. Threat of new entrants
6.2.5. Degree of competition
Chapter 7. Competitive Landscape
7.1.1. Company Market Share/Positioning Analysis
7.1.2. Key Strategies Adopted by Players
7.1.3. Vendor Landscape
7.1.3.1. List of Suppliers
7.1.3.2. List of Buyers
Chapter 8. U.S. Non-alcoholic Beverages Market, By Product
8.1. U.S. Non-alcoholic Beverages Market, by Product, 2024-2033
8.1.1. Carbonated Soft Drinks
8.1.1.1. Market Revenue and Forecast (2021-2033)
8.1.2. Bottled Water
8.1.2.1. Market Revenue and Forecast (2021-2033)
8.1.3. RTD Tea & Coffee
8.1.3.1. Market Revenue and Forecast (2021-2033)
8.1.4. Functional Beverages
8.1.4.1. Market Revenue and Forecast (2021-2033)
8.1.5. Juices
8.1.5.1. Market Revenue and Forecast (2021-2033)
8.1.6. Dairy-based Beverages
8.1.6.1. Market Revenue and Forecast (2021-2033)
8.1.7. Others
8.1.7.1. Market Revenue and Forecast (2021-2033)
Chapter 9. U.S. Non-alcoholic Beverages Market, By Distribution channel
9.1. U.S. Non-alcoholic Beverages Market, by Distribution channel, 2024-2033
9.1.1. Food Service
9.1.1.1. Market Revenue and Forecast (2021-2033)
9.1.2. Retail
9.1.2.1. Market Revenue and Forecast (2021-2033)
Chapter 10. U.S. Non-alcoholic Beverages Market, Regional Estimates and Trend Forecast
10.1. U.S.
10.1.1. Market Revenue and Forecast, by Product (2021-2033)
10.1.2. Market Revenue and Forecast, by Distribution channel (2021-2033)
Chapter 11. Company Profiles
11.1. Nestlé
11.1.1. Company Overview
11.1.2. Product Offerings
11.1.3. Financial Performance
11.1.4. Recent Initiatives
11.2. PepsiCo
11.2.1. Company Overview
11.2.2. Product Offerings
11.2.3. Financial Performance
11.2.4. Recent Initiatives
11.3. Unilever
11.3.1. Company Overview
11.3.2. Product Offerings
11.3.3. Financial Performance
11.3.4. Recent Initiatives
11.4. Keurig Dr Pepper Inc.
11.4.1. Company Overview
11.4.2. Product Offerings
11.4.3. Financial Performance
11.4.4. LTE Scientific
11.5. The Coca-Cola Company
11.5.1. Company Overview
11.5.2. Product Offerings
11.5.3. Financial Performance
11.5.4. Recent Initiatives
11.6. Jones Soda Co.
11.6.1. Company Overview
11.6.2. Product Offerings
11.6.3. Financial Performance
11.6.4. Recent Initiatives
11.7. Danone S.A
11.7.1. Company Overview
11.7.2. Product Offerings
11.7.3. Financial Performance
11.7.4. Recent Initiatives
11.8. Suntory Beverage & Food Ltd
11.8.1. Company Overview
11.8.2. Product Offerings
11.8.3. Financial Performance
11.8.4. Recent Initiatives
11.9. Asahi Group Holdings, Ltd.
11.9.1. Company Overview
11.9.2. Product Offerings
11.9.3. Financial Performance
11.9.4. Recent Initiatives
11.10. Red Bull
11.10.1. Company Overview
11.10.2. Product Offerings
11.10.3. Financial Performance
11.10.4. Recent Initiatives
Chapter 12. Research Methodology
12.1. Primary Research
12.2. Secondary Research
12.3. Assumptions
Chapter 13. Appendix
13.1. About Us
13.2. Glossary of Terms
 Cross-segment Market Size and Analysis for
Mentioned Segments
 Additional Company Profiles (Upto 5 With No Cost)
 Additional Countries (Apart From Mentioned Countries)
 Country/Region-specific Report
 Go To Market Strategy
 Region Specific Market Dynamics
 Region Level Market Share
 Import Export Analysis
 Production Analysis
 Others