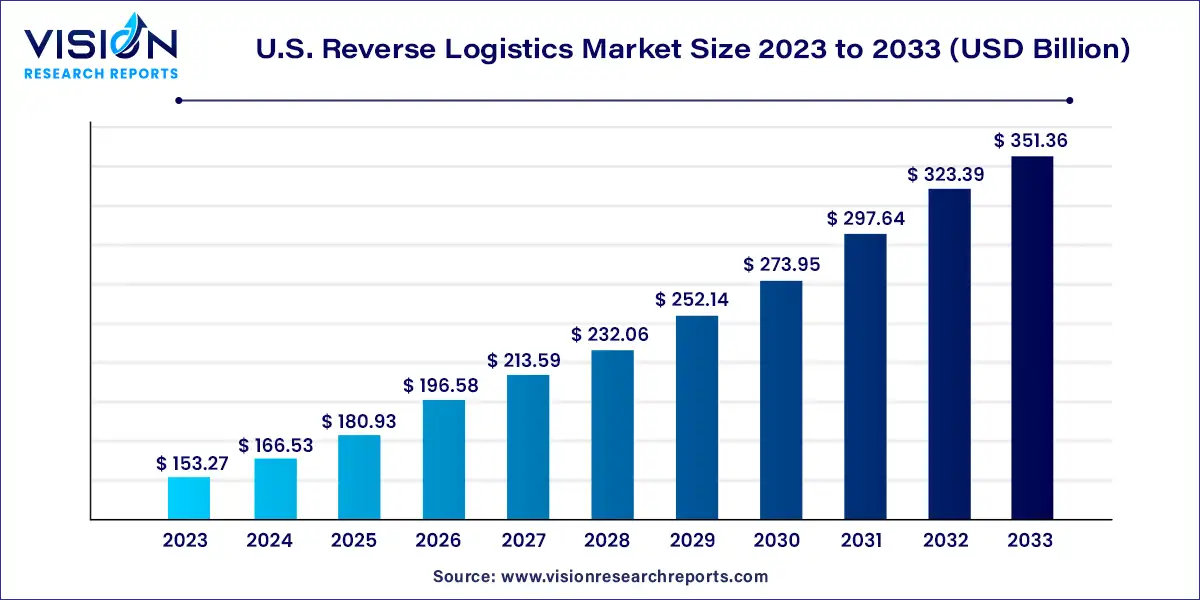
The U.S. reverse logistics market size was valued at USD 153.27 billion in 2023 and is anticipated to reach around USD 351.36 billion by 2033, growing at a CAGR of 8.65% from 2024 to 2033.

The U.S. reverse logistics market has emerged as a crucial component of supply chain management, encompassing the processes involved in the return, repair, refurbishment, and disposition of products and materials. In recent years, the dynamics of reverse logistics have evolved significantly, driven by factors such as sustainability initiatives, regulatory compliance, and the proliferation of e-commerce.
The growth of the U.S. reverse logistics market is propelled by the expansion of e-commerce platforms has led to a surge in product returns, necessitating efficient reverse logistics processes to manage the influx effectively. Additionally, heightened awareness of environmental sustainability has spurred businesses to adopt greener practices, including responsible handling and disposal of returned goods. Regulatory compliance mandates further drive the need for robust reverse logistics solutions to ensure adherence to waste management regulations. Moreover, businesses recognize the potential cost savings and revenue opportunities associated with effective reverse logistics management, motivating them to invest in optimizing their reverse logistics processes.
The market is segmented into various return types, including recall returns, B2B returns, commercial returns, repairable returns, end-of-use returns, and end-of-life returns. In 2023, the B2B returns and commercial returns segment led the market with a revenue share of 35% and is expected to grow at the fastest CAGR of 9.35% over the forecast period. B2B returns involve products returned from retailers to manufacturers, often in bulk due to defects or damage. Non-defective items can be resold in secondary marketplaces like outlet stores, overstock shops, dollar stores, and auctions. The significant growth in B2B and commercial returns can be attributed to the increasing focus on sustainability and environmental responsibility.
The repairable returns segment is projected to experience a notable CAGR of 8.95% over the forecast period. Repair and return involve rectifying flaws in merchandise and returning it to consumers. Some customers prefer repaired items over replacements, and even if not requested, reintegrating repaired items into the market can reduce overall return costs. Certain companies establish dedicated field repair centers for quick assessment, rectification, and re-entry of goods into the market. Products with minor issues may be offered as "like-new" or "refurbished," while defective items can be repaired and resold. Repairable returns offer a practical approach by enabling the restoration and reintegration of returned goods, reducing the need for new item production.
The market is segmented based on service offerings, including warehousing, transportation, replacement management, reselling, refund management, and others. In 2023, the transportation segment dominated the market with the largest revenue share of 52% and is expected to grow at the fastest CAGR of 9.24% over the forecast period. This growth is attributed to the essential role of a streamlined transportation network in reducing lead times and costs for recycled and pre-owned merchandise. A reliable transportation system enhances logistics efficiency, reduces operational costs, and ensures superior customer service, particularly in managing product returns. The surge in e-commerce and online shopping has led to an increase in returned products, driving demand for dependable transportation services in the reverse logistics sector.
The warehousing segment is forecasted to register a significant CAGR of 8.81% over the forecast period. The rise in online shopping has resulted in higher volumes of returned products, consequently increasing the need for warehouses. Warehousing in reverse logistics involves storing returned items, replacements, end-of-use or end-of-life products, and unsold merchandise. Warehouses play a critical role in reverse logistics and are experiencing growing demand due to the expansion of the circular economy. Apart from basic processing and restocking, warehouses are increasingly required to perform value-added activities.
The market is segmented by end-user industry, including retail & e-commerce, automotive, consumer electronics, healthcare, and others. In 2023, the retail & e-commerce segment led the market with a revenue share of 51% and is expected to achieve the fastest CAGR of 9.93% over the forecast period. The retail and e-commerce sector has witnessed substantial growth in reverse logistics due to the rising popularity of online shopping, which has resulted in a higher volume of product returns. This segment focuses on managing returns within retail and e-commerce, prompting the need for robust reverse logistics processes to handle returns efficiently, leading to the development of dedicated reverse logistics operations in these sectors.
The automotive segment is projected to witness the fastest CAGR of 9.46% over the forecast period. Reverse logistics plays a crucial role in the automotive industry due to regulatory mandates concerning ecological and environmental concerns. Automakers are responsible for end-of-life vehicle management, especially concerning environmentally sensitive materials. Factors like emission-related recalls, electric vehicle battery flaws, and electronic component defects necessitate reverse logistics. With increasing environmental awareness among consumers, the relevance of reverse logistics in the automotive sector is amplified. Additionally, the automotive segment is further segmented into spare parts, lubricants, and vehicle accessories.
By Return Type
By Service
By End-user
 Cross-segment Market Size and Analysis for
Mentioned Segments
 Additional Company Profiles (Upto 5 With No Cost)
 Additional Countries (Apart From Mentioned Countries)
 Country/Region-specific Report
 Go To Market Strategy
 Region Specific Market Dynamics
 Region Level Market Share
 Import Export Analysis
 Production Analysis
 Others