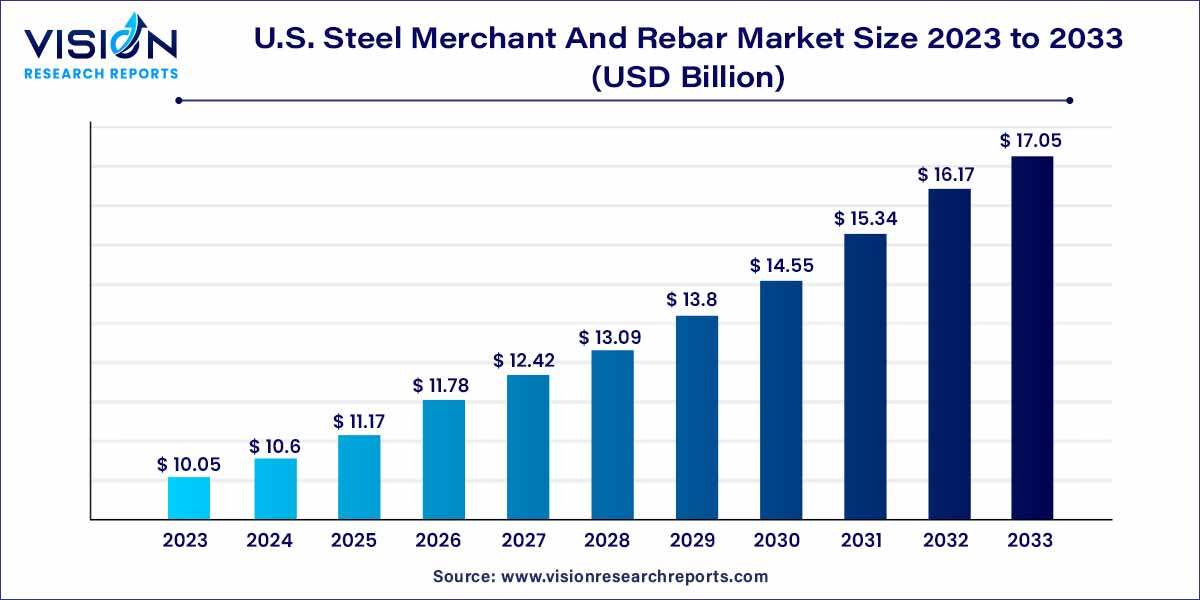
The U.S. steel merchant and rebar market size was estimated at around USD 10.05 billion in 2023 and it is projected to hit around USD 17.05 billion by 2033, growing at a CAGR of 5.43% from 2024 to 2033. The U.S. steel merchant and rebar market is driven by an infrastructure investments, construction sector growth, urbanization trends, and resilience and durability.

The U.S. steel merchant and rebar market play a pivotal role in the nation's construction and infrastructure sectors. This dynamic market segment encompasses various stakeholders, including manufacturers, distributors, contractors, and end-users. Understanding the current landscape and trends within this market is essential for stakeholders to make informed decisions and navigate challenges effectively.
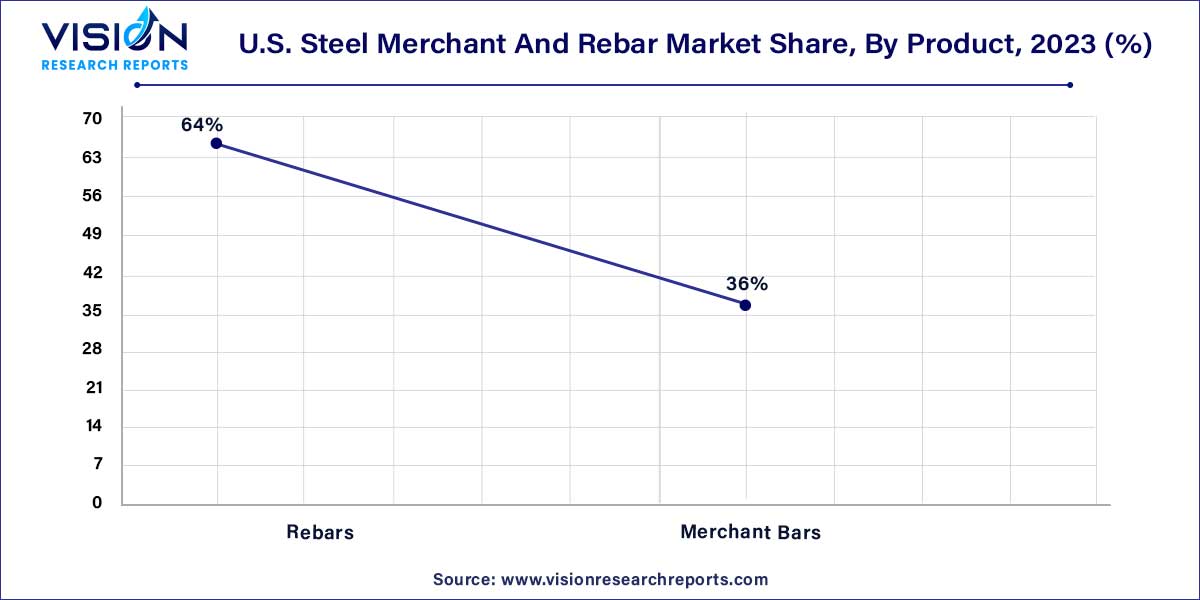
In 2023, the rebars segment emerged as the market leader, commanding a substantial revenue share of 64%. Within this segment, two main types are prominent in construction: mild rebars and deformed rebars. While mild rebars have historically been prevalent, there's a notable shift towards deformed rebars due to their superior strength and durability, which contribute to enhanced longevity and robustness of constructed structures.

Deformed rebars boast superior characteristics such as malleability, ductility, toughness, high yield strength, corrosion resistance, and seismic resilience. Their versatility and cost-effectiveness make them ideal for a wide array of applications, spanning industrial facilities, residential and commercial buildings, as well as bridges.
Merchant bars encompass various profiles including angles, channels, flats, rounds, and beams. These bars find extensive usage in structural applications across the construction industry, as well as in diverse sectors such as automotive, shipbuilding, railways, appliances, heavy machinery, mining, agriculture, tools, and original equipment manufacturing.
In 2023, the construction segment held the largest market revenue share. However, construction spending and economic growth in the U.S. exhibited sluggishness in 2022 and 2023, largely due to the Federal Reserve's aggressive stance on increasing interest rates. This decision was influenced by the rapid inflation surge driven by COVID-19-induced supply chain disruptions and the Russia-Ukraine conflict.
According to the Commerce Department, construction spending in the U.S. declined in December 2023, primarily due to reduced investment in single-family homebuilding amid elevated mortgage rates. December 2023 saw a 0.4% decrease in construction spending compared to the previous month. Nonetheless, overall construction spending in 2022 experienced a notable uptick of 10.2%. It is anticipated that the construction sector will undergo a gradual recovery in 2024, potentially aided by a decline in interest rates.
Infrastructure applications are projected to exhibit the fastest compound annual growth rate (CAGR) throughout the forecast period. The development of infrastructure plays a pivotal role in bolstering the U.S. economy. A study conducted by the U.S. Department of Treasury analyzed 40 key proposed infrastructure projects to underscore the economic significance of infrastructure. According to this study, the completion or implementation of these 40 projects could generate economic benefits ranging from USD 500 billion to 1 trillion for the country.
By Product
By End-use
Chapter 1. Introduction
1.1. Research Objective
1.2. Scope of the Study
1.3. Definition
Chapter 2. Research Methodology
2.1. Research Approach
2.2. Data Sources
2.3. Assumptions & Limitations
Chapter 3. Executive Summary
3.1. Market Snapshot
Chapter 4. Market Variables and Scope
4.1. Introduction
4.2. Market Classification and Scope
4.3. Industry Value Chain Analysis
4.3.1. Raw Material Procurement Analysis
4.3.2. Sales and Distribution Channel Analysis
4.3.3. Downstream Buyer Analysis
Chapter 5. COVID 19 Impact on U.S. Steel Merchant and Rebar Market
5.1. COVID-19 Landscape: U.S. Steel Merchant and Rebar Industry Impact
5.2. COVID 19 - Impact Assessment for the Industry
5.3. COVID 19 Impact: Major Government Policy
5.4. Market Trends and Opportunities in the COVID-19 Landscape
Chapter 6. Market Dynamics Analysis and Trends
6.1. Market Dynamics
6.1.1. Market Drivers
6.1.2. Market Restraints
6.1.3. Market Opportunities
6.2. Porter’s Five Forces Analysis
6.2.1. Bargaining power of suppliers
6.2.2. Bargaining power of buyers
6.2.3. Threat of substitute
6.2.4. Threat of new entrants
6.2.5. Degree of competition
Chapter 7. Competitive Landscape
7.1.1. Company Market Share/Positioning Analysis
7.1.2. Key Strategies Adopted by Players
7.1.3. Vendor Landscape
7.1.3.1. List of Suppliers
7.1.3.2. List of Buyers
Chapter 8. U.S. Steel Merchant and Rebar Market, By Product
8.1. U.S. Steel Merchant and Rebar Market, by Product, 2024-2033
8.1.1. Rebars
8.1.1.1. Market Revenue and Forecast (2021-2033)
8.1.2. Merchant Bars
8.1.2.1. Market Revenue and Forecast (2021-2033)
Chapter 9. U.S. Steel Merchant and Rebar Market, By End-use
9.1. U.S. Steel Merchant and Rebar Market, by End-use, 2024-2033
9.1.1. Construction
9.1.1.1. Market Revenue and Forecast (2021-2033)
9.1.2. Infrastructure
9.1.2.1. Market Revenue and Forecast (2021-2033)
9.1.3. Industrial
9.1.3.1. Market Revenue and Forecast (2021-2033)
Chapter 10. U.S. Steel Merchant and Rebar Market, Regional Estimates and Trend Forecast
10.1. U.S.
10.1.1. Market Revenue and Forecast, by Product (2021-2033)
10.1.2. Market Revenue and Forecast, by End-use (2021-2033)
Chapter 11. Company Profiles
11.1. Acerinox S.A.
11.1.1. Company Overview
11.1.2. Product Offerings
11.1.3. Financial Performance
11.1.4. Recent Initiatives
11.2. CMC Steel
11.2.1. Company Overview
11.2.2. Product Offerings
11.2.3. Financial Performance
11.2.4. Recent Initiatives
11.3. EVRAZ U.S., Inc.
11.3.1. Company Overview
11.3.2. Product Offerings
11.3.3. Financial Performance
11.3.4. Recent Initiatives
11.4. Gerdau S.A.
11.4.1. Company Overview
11.4.2. Product Offerings
11.4.3. Financial Performance
11.4.4. LTE Scientific
11.5. JFE Steel Corporation
11.5.1. Company Overview
11.5.2. Product Offerings
11.5.3. Financial Performance
11.5.4. Recent Initiatives
11.6. NIPPON STEEL CORPORATION
11.6.1. Company Overview
11.6.2. Product Offerings
11.6.3. Financial Performance
11.6.4. Recent Initiatives
11.7. Nucor
11.7.1. Company Overview
11.7.2. Product Offerings
11.7.3. Financial Performance
11.7.4. Recent Initiatives
11.8. OutoKumpu
11.8.1. Company Overview
11.8.2. Product Offerings
11.8.3. Financial Performance
11.8.4. Recent Initiatives
11.9. Schnitzer Steel Industries (dba Radius Recycling)
11.9.1. Company Overview
11.9.2. Product Offerings
11.9.3. Financial Performance
11.9.4. Recent Initiatives
11.10. Steel Dynamics, Inc.
11.10.1. Company Overview
11.10.2. Product Offerings
11.10.3. Financial Performance
11.10.4. Recent Initiatives
Chapter 12. Research Methodology
12.1. Primary Research
12.2. Secondary Research
12.3. Assumptions
Chapter 13. Appendix
13.1. About Us
13.2. Glossary of Terms
 Cross-segment Market Size and Analysis for
Mentioned Segments
 Additional Company Profiles (Upto 5 With No Cost)
 Additional Countries (Apart From Mentioned Countries)
 Country/Region-specific Report
 Go To Market Strategy
 Region Specific Market Dynamics
 Region Level Market Share
 Import Export Analysis
 Production Analysis
 Others