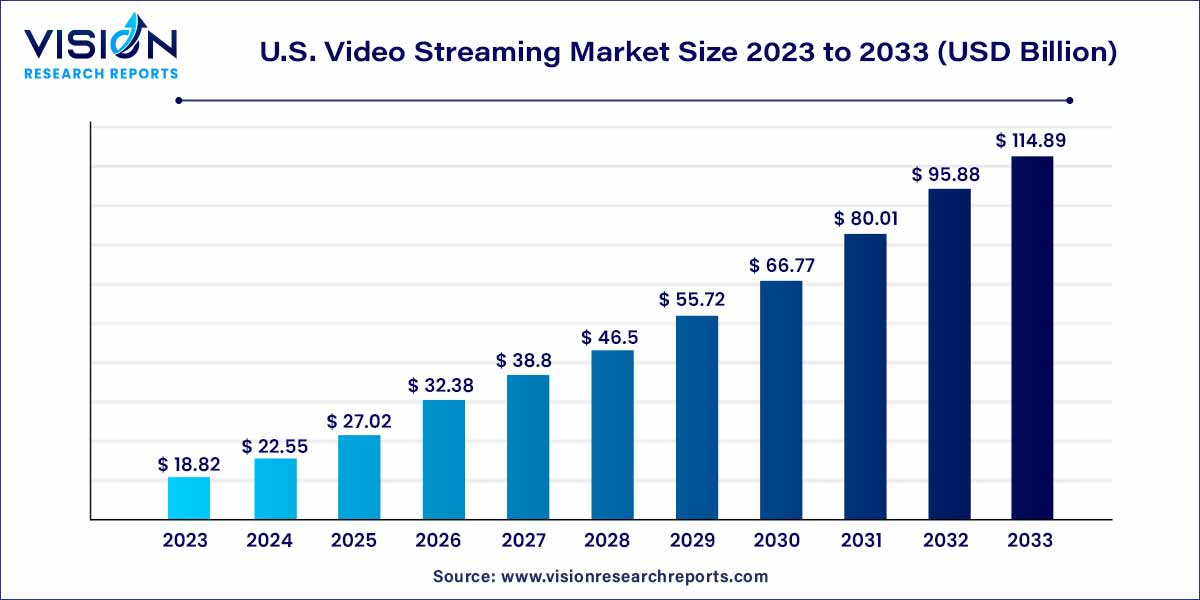
The U.S. video streaming market size was estimated at around USD 18.82 billion in 2023 and it is projected to hit around USD 114.89 billion by 2033, growing at a CAGR of 19.83% from 2024 to 2033.

The U.S. video streaming market has witnessed significant growth and evolution in recent years, becoming a dominant force in the entertainment industry. As technology continues to advance and consumer preferences shift, understanding the key dynamics and trends in this market is essential for industry stakeholders and enthusiasts alike.
The robust growth of the U.S. video streaming market can be attributed to several key factors. Firstly, the increasing ubiquity of high-speed internet and widespread adoption of smart devices have facilitated seamless access to streaming platforms, contributing to a larger user base. Secondly, the diversified and expansive content libraries offered by major players like Netflix, Amazon Prime Video, Hulu, and Disney+ have played a pivotal role in attracting and retaining subscribers. The technological advancements in streaming, including enhanced video quality and personalized recommendations, have significantly improved the overall user experience, driving continued market expansion. Additionally, the market's resilience and adaptability to evolving consumer preferences, coupled with ongoing investments in original content, international expansion, and emerging technologies, position it for sustained growth in the foreseeable future.
The live video streaming segment spearheaded the market, accounting for 65% of the U.S. video streaming market revenue share in 2023. An unprecedented surge in internet penetration and heightened demand for ad-free content, analytics tracking, and mobile viewing have boded well for the market forecast. Live streaming in 4K, 3D, and mono formats modes will continue to receive an impetus. Stakeholders are expected to bank on live streaming for increased engagement and real-time feedback.
While live streaming will continue to amass traction, non-linear (video-on-demand) streaming will be highly sought-after across the region. American consumers have depicted a strong demand for VOD due to convenience and ease as it is pre-recorded and can be made available for streaming anytime. In essence, video-on-demand has added a fillip to the U.S. market with surging footfall of summits, town halls, exhibitions, and conferences. U.S. consumers have also depicted demand for news and sports (apart from series and movies), prompting industry leaders to infuse funds into the non-linear portfolio.
The over-the-top (OTT) segment contributed the largest revenue share in 2023. Video streaming behemoths, such as Netflix, Disney+ and Amazon Prime Video, have observed notable growth since the lockdown. OTT giants have even joined forces with film studios and producers to gain a competitive edge in the market. Predominantly, advanced IT infrastructure and expanding footfall of 5G have fared well for the market growth.
Pay TV has continued to gain an impetus as a home entertainment device in the North American country. While the challenges posed by OTT have been evident, sports enthusiasts have often banked on cable TV to watch live games. Moreover, U.S. consumers seek pay TV networks for live broadcasts of events, news updates, live broadcasts and breaking stories. Besides, areas with unreliable internet connections are expected to observe robust demand for pay TV.
The smartphones and tablets segment accounted for the largest market revenue share in 2023. The growth is partly due to the soaring adoption of advanced devices across the region. In April 2023, the U.S. Census Bureau noted that four out of five households with children owned tablets. To put this in perspective, 64% of U.S. households owned a tablet computer in 2021. Furthermore, 5G penetration and soaring demand for iPhone and Android devices reinforce the growth outlook of smartphones.
Gaming consoles have emerged as one of the most common home entertainment devices. Flagship products of Xbox and Microsoft have redefined the gaming industry. With internet connection becoming more robust and 5G becoming palpable, gaming traffic has witnessed an unprecedented spike. The emergence of 4K TVs has furthered the penetration of home consoles. Prevailing trends suggest AR/VR-based consoles could hold traction in the ensuing period.
The training and support service contributed significant U.S. video streaming market revenue share in 2023 and will continue to gain an uptick on the back of soaring demand for employee training and development. Video streaming (both live and pre-recorded) has bridged the gap between learners and educators, emerging as a game-changer in the training and support landscape. To illustrate, live video streaming can bolster real-time collaboration and eradicate the need for travel and accommodation expenses.
Managed services have received an impetus to take away the burden of maintaining the infrastructure, underpin the personalization experience, and prevent downtime. Besides, video conferencing solutions have gained an uptake as corporates continue to bank on innovative technologies. Furthermore, managed OTT platforms have gained ground in the wake of surging demand for subscription management, content management and content analytics.
The subscription-based model depicted the largest revenue share in 2023 and is expected to gain considerable traction during the forecast period. Subscription-based revenue (with recurring annual or monthly fees) has amassed huge popularity across the U.S. The trend has prompted industry leaders to inject funds into high-quality and original content. Lately, video streaming service providers have focused on OTT content covering meditations, training, workouts and recipes.
The advertising segment is poised to exhibit notable growth against the backdrop of the expectation of increased revenue by selling advertising space to other businesses. For instance, YouTube offers pre-roll, mid-roll and in-video ads for advertising companies. Predominantly, Pay TV is one of the largest markets for advertisers. In addition, advertising is also seen as a considerable revenue source during live streaming of sports events and tournaments.
The cloud deployment segment exhibited the largest revenue share in 2023 and will observe an uptick on the back of increased scalability. Robust projection is partly attributed to the demand for personalized content and the adoption of a pay-as-you-go business model. Predominantly, cloud-based solutions offer agility, capacity, and flexibility to handle fluctuations in traffic. The advanced solution has also helped video service providers to monetize offerings through targeted advertising.
The on-premise deployment has gained prominence to avoid bandwidth constraints and foster smooth network accessibility for seamless video streaming. Besides, sensitive content is profoundly retained on-premise for security and control. The growth is also attributed to the innate ability of the model to ensure virtually 100% uptime by negating service outages and interruptions. In essence, on-premise for OTT platforms could be resource-intensive with high upfront costs.
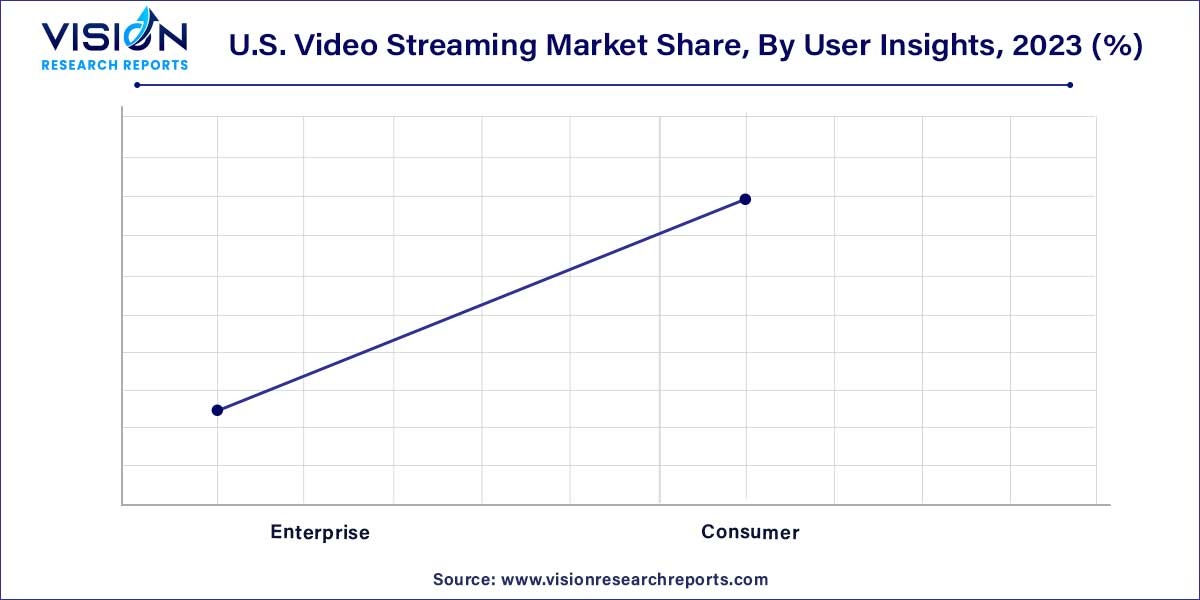
The consumer segment accounted for the largest revenue share in 2023 and is poised to observe an uptick on the back of trends for gaming, e-learning, real-time entertainment, and social networking. In essence, live video and non-linear streaming providing e-learning and gaming have witnessed a massive uptick among consumers. Consumers will continue to bank on video streaming of theater performances, live concerts, vising museums and sporting events.

By Streaming Type
By Solution
By Platform
By Service
By Revenue Model
By Deployment Type
By User
Chapter 1. Introduction
1.1. Research Objective
1.2. Scope of the Study
1.3. Definition
Chapter 2. Research Methodology
2.1. Research Approach
2.2. Data Sources
2.3. Assumptions & Limitations
Chapter 3. Executive Summary
3.1. Market Snapshot
Chapter 4. Market Variables and Scope
4.1. Introduction
4.2. Market Classification and Scope
4.3. Industry Value Chain Analysis
4.3.1. Raw Material Procurement Analysis
4.3.2. Sales and Distribution Channel Analysis
4.3.3. Downstream Buyer Analysis
Chapter 5. Market Dynamics Analysis and Trends
5.1. Market Dynamics
5.1.1. Market Drivers
5.1.2. Market Restraints
5.1.3. Market Opportunities
5.2. Porter’s Five Forces Analysis
5.2.1. Bargaining power of suppliers
5.2.2. Bargaining power of buyers
5.2.3. Threat of substitute
5.2.4. Threat of new entrants
5.2.5. Degree of competition
Chapter 6. Competitive Landscape
6.1.1. Company Market Share/Positioning Analysis
6.1.2. Key Strategies Adopted by Players
6.1.3. Vendor Landscape
6.1.3.1. List of Suppliers
6.1.3.2. List of Buyers
Chapter 7. U.S. Video Streaming Market, By Streaming Type
7.1. U.S. Video Streaming Market, by Streaming Type, 2024-2033
7.1.1. Live Video Streaming
7.1.1.1. Market Revenue and Forecast (2021-2033)
7.1.2. Non-Linear Video Streaming (Video on Demand)
7.1.2.1. Market Revenue and Forecast (2021-2033)
Chapter 8. U.S. Video Streaming Market, By Solution
8.1. U.S. Video Streaming Market, by Solution, 2024-2033
8.1.1. Internet Protocol TV
8.1.1.1. Market Revenue and Forecast (2021-2033)
8.1.2. Over-the-Top (OTT)
8.1.2.1. Market Revenue and Forecast (2021-2033)
8.1.3. Pay TV
8.1.3.1. Market Revenue and Forecast (2021-2033)
Chapter 9. U.S. Video Streaming Market, By Platform
9.1. U.S. Video Streaming Market, by Platform, 2024-2033
9.1.1. Gaming Consoles
9.1.1.1. Market Revenue and Forecast (2021-2033)
9.1.2. Laptops & Desktops
9.1.2.1. Market Revenue and Forecast (2021-2033)
9.1.3. Smartphones & Tablets
9.1.3.1. Market Revenue and Forecast (2021-2033)
9.1.4. Smart TV
9.1.4.1. Market Revenue and Forecast (2021-2033)
Chapter 10. U.S. Video Streaming Market, By Service
10.1. U.S. Video Streaming Market, by Service, 2024-2033
10.1.1. Consulting
10.1.1.1. Market Revenue and Forecast (2021-2033)
10.1.2. Managed Services
10.1.2.1. Market Revenue and Forecast (2021-2033)
10.1.3. Training & Support
10.1.3.1. Market Revenue and Forecast (2021-2033)
Chapter 11. U.S. Video Streaming Market, By Revenue Model
11.1. U.S. Video Streaming Market, by Revenue Model, 2024-2033
11.1.1. Advertising
11.1.1.1. Market Revenue and Forecast (2021-2033)
11.1.2. Rental
11.1.2.1. Market Revenue and Forecast (2021-2033)
11.1.3. Subscription
11.1.3.1. Market Revenue and Forecast (2021-2033)
Chapter 12. U.S. Video Streaming Market, By Deployment Type
12.1. U.S. Video Streaming Market, by Deployment Type, 2024-2033
12.1.1. Cloud
12.1.1.1. Market Revenue and Forecast (2021-2033)
12.1.2. On-Premises
12.1.2.1. Market Revenue and Forecast (2021-2033)
Chapter 13. U.S. Video Streaming Market, By User
13.1. U.S. Video Streaming Market, by User, 2024-2033
13.1.1. Enterprise
13.1.1.1. Market Revenue and Forecast (2021-2033)
13.1.2. Consumer
13.1.2.1. Market Revenue and Forecast (2021-2033)
Chapter 14. U.S. Video Streaming Market, Regional Estimates and Trend Forecast
14.1. U.S.
14.1.1. Market Revenue and Forecast, by Streaming Type (2021-2033)
14.1.2. Market Revenue and Forecast, by Solution (2021-2033)
14.1.3. Market Revenue and Forecast, by Platform (2021-2033)
14.1.4. Market Revenue and Forecast, by Service (2021-2033)
14.1.5. Market Revenue and Forecast, by Revenue Model (2021-2033)
14.1.6. Market Revenue and Forecast, by User (2021-2033)
14.1.7. Market Revenue and Forecast, by Deployment Type (2021-2033)
Chapter 15. Company Profiles
15.1. Amazon Web Services, Inc.
15.1.1. Company Overview
15.1.2. Product Offerings
15.1.3. Financial Performance
15.1.4. Recent Initiatives
15.2. Apple Inc.
15.2.1. Company Overview
15.2.2. Product Offerings
15.2.3. Financial Performance
15.2.4. Recent Initiatives
15.3. Cisco Systems, Inc.
15.3.1. Company Overview
15.3.2. Product Offerings
15.3.3. Financial Performance
15.3.4. Recent Initiatives
15.4. Google LLC
15.4.1. Company Overview
15.4.2. Product Offerings
15.4.3. Financial Performance
15.4.4. Recent Initiatives
15.5. Kaltura, Inc.
15.5.1. Company Overview
15.5.2. Product Offerings
15.5.3. Financial Performance
15.5.4. Recent Initiatives
15.6. Netflix, Inc.
15.6.1. Company Overview
15.6.2. Product Offerings
15.6.3. Financial Performance
15.6.4. Recent Initiatives
15.7. International Business Machine Corporation (IBM Cloud Video)
15.7.1. Company Overview
15.7.2. Product Offerings
15.7.3. Financial Performance
15.7.4. Recent Initiatives
15.8. Wowza Media Systems, LLC
15.8.1. Company Overview
15.8.2. Product Offerings
15.8.3. Financial Performance
15.8.4. Recent Initiatives
15.9. Hulu, LLC (Walt Disney)
15.9.1. Company Overview
15.9.2. Product Offerings
15.9.3. Financial Performance
15.9.4. Recent Initiatives
Chapter 16. Research Methodology
16.1. Primary Research
16.2. Secondary Research
16.3. Assumptions
Chapter 17. Appendix
17.1. About Us
17.2. Glossary of Terms
 Cross-segment Market Size and Analysis for
Mentioned Segments
 Additional Company Profiles (Upto 5 With No Cost)
 Additional Countries (Apart From Mentioned Countries)
 Country/Region-specific Report
 Go To Market Strategy
 Region Specific Market Dynamics
 Region Level Market Share
 Import Export Analysis
 Production Analysis
 Others