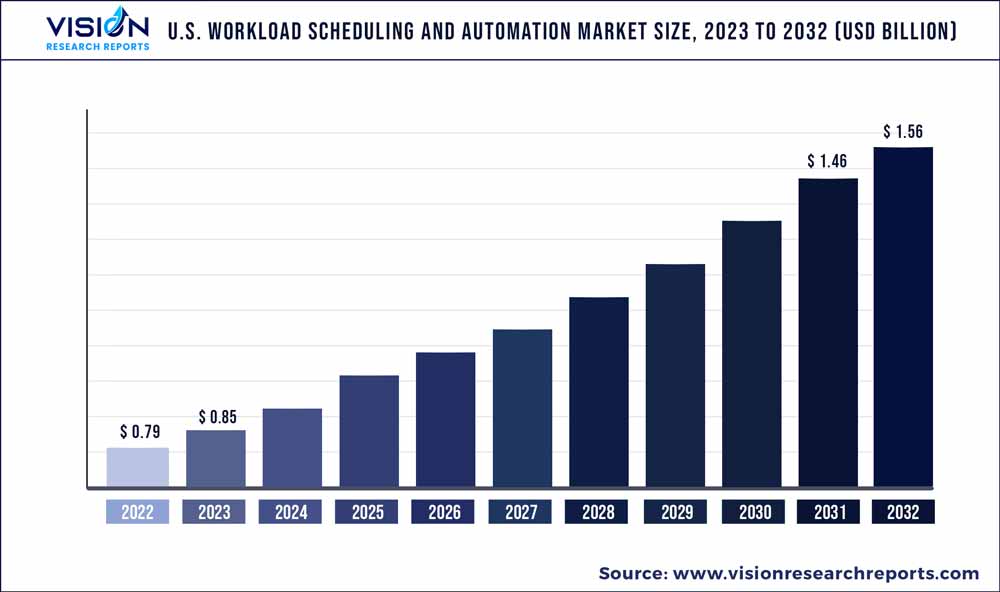
The U.S. workload scheduling and automation market was estimated at USD 0.79 billion in 2022 and it is expected to surpass around USD 1.56 billion by 2032, poised to grow at a CAGR of 7.05% from 2023 to 2032.

Key Pointers
Report Scope of the U.S. Workload Scheduling And Automation Market
| Report Coverage | Details |
| Market Size in 2022 | USD 0.79 billion |
| Revenue Forecast by 2032 | USD 1.56 billion |
| Growth rate from 2023 to 2032 | CAGR of 7.05% |
| Base Year | 2022 |
| Forecast Period | 2023 to 2032 |
| Market Analysis (Terms Used) | Value (US$ Million/Billion) or (Volume/Units) |
| Companies Covered | ASG Technologies Group, Inc.; BMC Software, Inc.; CA Technologies (Broadcom Inc.); Cisco Systems, Inc.; HCL Technologies Limited; Hitachi Vantara Corporation; IBM Corporation; Oracle Corporation; Redwood Software, Inc.; SMA Technologies; Stonebranch Inc.; VMWare Inc |
The growth of the workload scheduling & automation market is attributed to the widespread adoption of solutions by enterprises to boost their operational efficiency and gain a competitive edge. Moreover, the market is experiencing a significant trend toward orchestration capabilities. This is driven by the growing complexity of IT environments and the need to manage diverse workloads across multiple platforms and cloud environments. Organizations are increasingly seeking workload scheduling solutions that can automate the scheduling and execution of tasks, workflows, and processes, thereby driving market growth over the forecast period.
In addition, the market is anticipated to witness significant growth opportunities with the increasing complexity and scale of operations in the current business landscape. As more businesses migrate their operations to the cloud, workload scheduling & automation solutions become essential for optimizing resource utilization and ensuring efficient workload distribution across virtualized environments, leading to a rise in demand for cloud-based platforms as it aids organizations in achieving improved scalability, cost savings, and enhanced overall system performance.
The key players in the market are continuously participating in ongoing initiatives to develop and offer integrated workload automation solution suites designed to help companies optimize their operations. For instance, in August 2022, VMware, Inc., an American cloud computing and virtualization technology company, launched vSphere 8, a workload platform for enterprises that brings data processing units and other advantages of cloud technology to enterprises on-premise. Such developments by market players are expected to drive the U.S. workload scheduling and automation market growth over the forecast period.
Deployment Insights
The cloud segment is expected to record the fastest CAGR of 9.84% from 2023 to 2032. The segment growth is attributed to large-scale deployment that is more cost-efficient via the cloud. Additionally, cloud deployment growth is attributed to low maintenance and downtime of cloud-based schedulers as the deployment of new features and updates are done virtually and without interrupting any ongoing tasks. These properties offered by cloud-based deployment are expected to drive segment growth over the forecast period.
The on-premise segment accounted for a revenue share of over 38% in 2022. This is attributed to the performance factors as on-premise workload schedulers do not have latency and connectivity issues that can otherwise arise in cloud-based schedulers. Moreover, they provide greater control and accessibility during interruptions in the network as the employees can still access the data using on-premise solutions, which is expected to augment the demand for the on-premise segment further.
Enterprise Size Insights
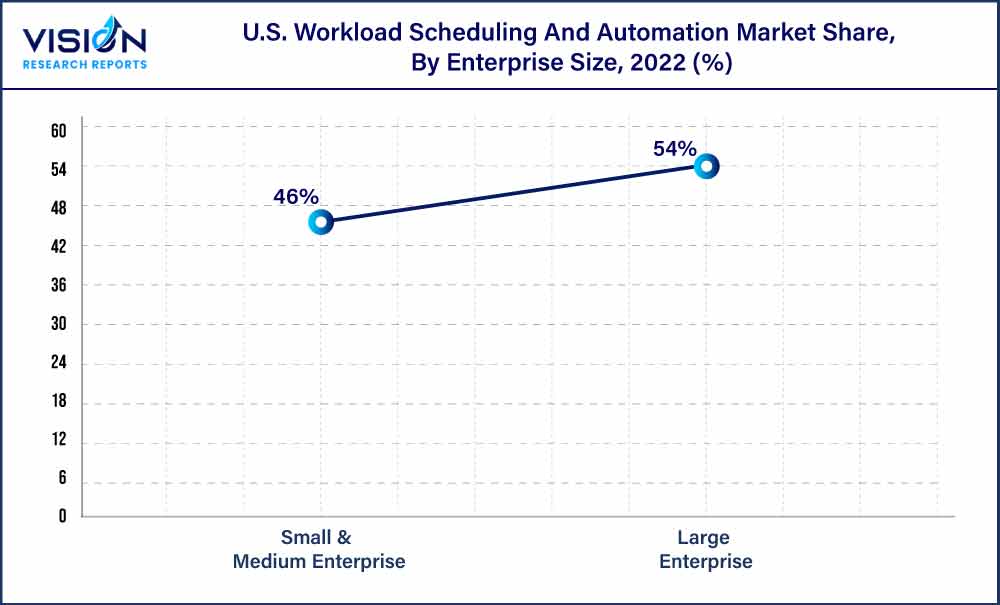
The large enterprise segment accounted for a market share of over 54% in 2022. The segment dominance is attributed to the growing demand for workload scheduling & automation software in large enterprises as they have a high number of employees in large enterprises working in various departments on multiple projects. Furthermore, the automation features help streamline task management and improve operational efficiency, allowing large enterprises to handle high volumes of workloads effectively, which is expected to boost segment growth over the forecast period.

The small and medium enterprises segment is estimated to record the fastest CAGR of 7.56% between 2023 and 2032, with increasing demand across these organizations as they seek to adopt economical alternatives to manage workloads. The demand for workload scheduling & automation in SMEs is anticipated to grow further due to the trend of digitization and cloud-based operations to assist in enterprise expansion and growth. Moreover, SMEs increasingly embrace digital transformation and rely on technology to streamline their operations, which is anticipated to drive segment growth.
End-use Insights
The IT and telecommunication segment held the largest revenue share of 24% in 2022. The strong segment presence is attributed to growing workload demands in the IT industry due to new technological developments. For instance, the trend of Artificial Intelligence (AI) technology has increased workload demand in leading IT companies for the development and application of artificial intelligence. Additionally, workload scheduling & automation are expected to drive the segment growth as they are also used to reduce downtime and maintenance costs by scheduling and prioritizing resources to key departments with the help of automation.
The government and public sector segment is expected to record the fastest CAGR of 8.13% from 2023 to 2032. The growing digitization of government agencies to improve efficiency in handling multiple projects and tasks is anticipated to drive the demand for workload scheduling and automation solutions. Moreover, the solution can ensure regulation adherence by automating audits, compliance checks, and reporting. By automating these tasks, government agencies can reduce the risk of errors and non-compliance, saving time and resources while maintaining regulatory standards, which is anticipated to fuel the segment's growth.
U.S. Workload Scheduling And Automation Market Segmentations:
By Deployment
By Enterprise Size
By End-use
 Cross-segment Market Size and Analysis for
Mentioned Segments
 Additional Company Profiles (Upto 5 With No Cost)
 Additional Countries (Apart From Mentioned Countries)
 Country/Region-specific Report
 Go To Market Strategy
 Region Specific Market Dynamics
 Region Level Market Share
 Import Export Analysis
 Production Analysis
 Others