Value-based Healthcare Services Market Size, Share | Report 2023-2032
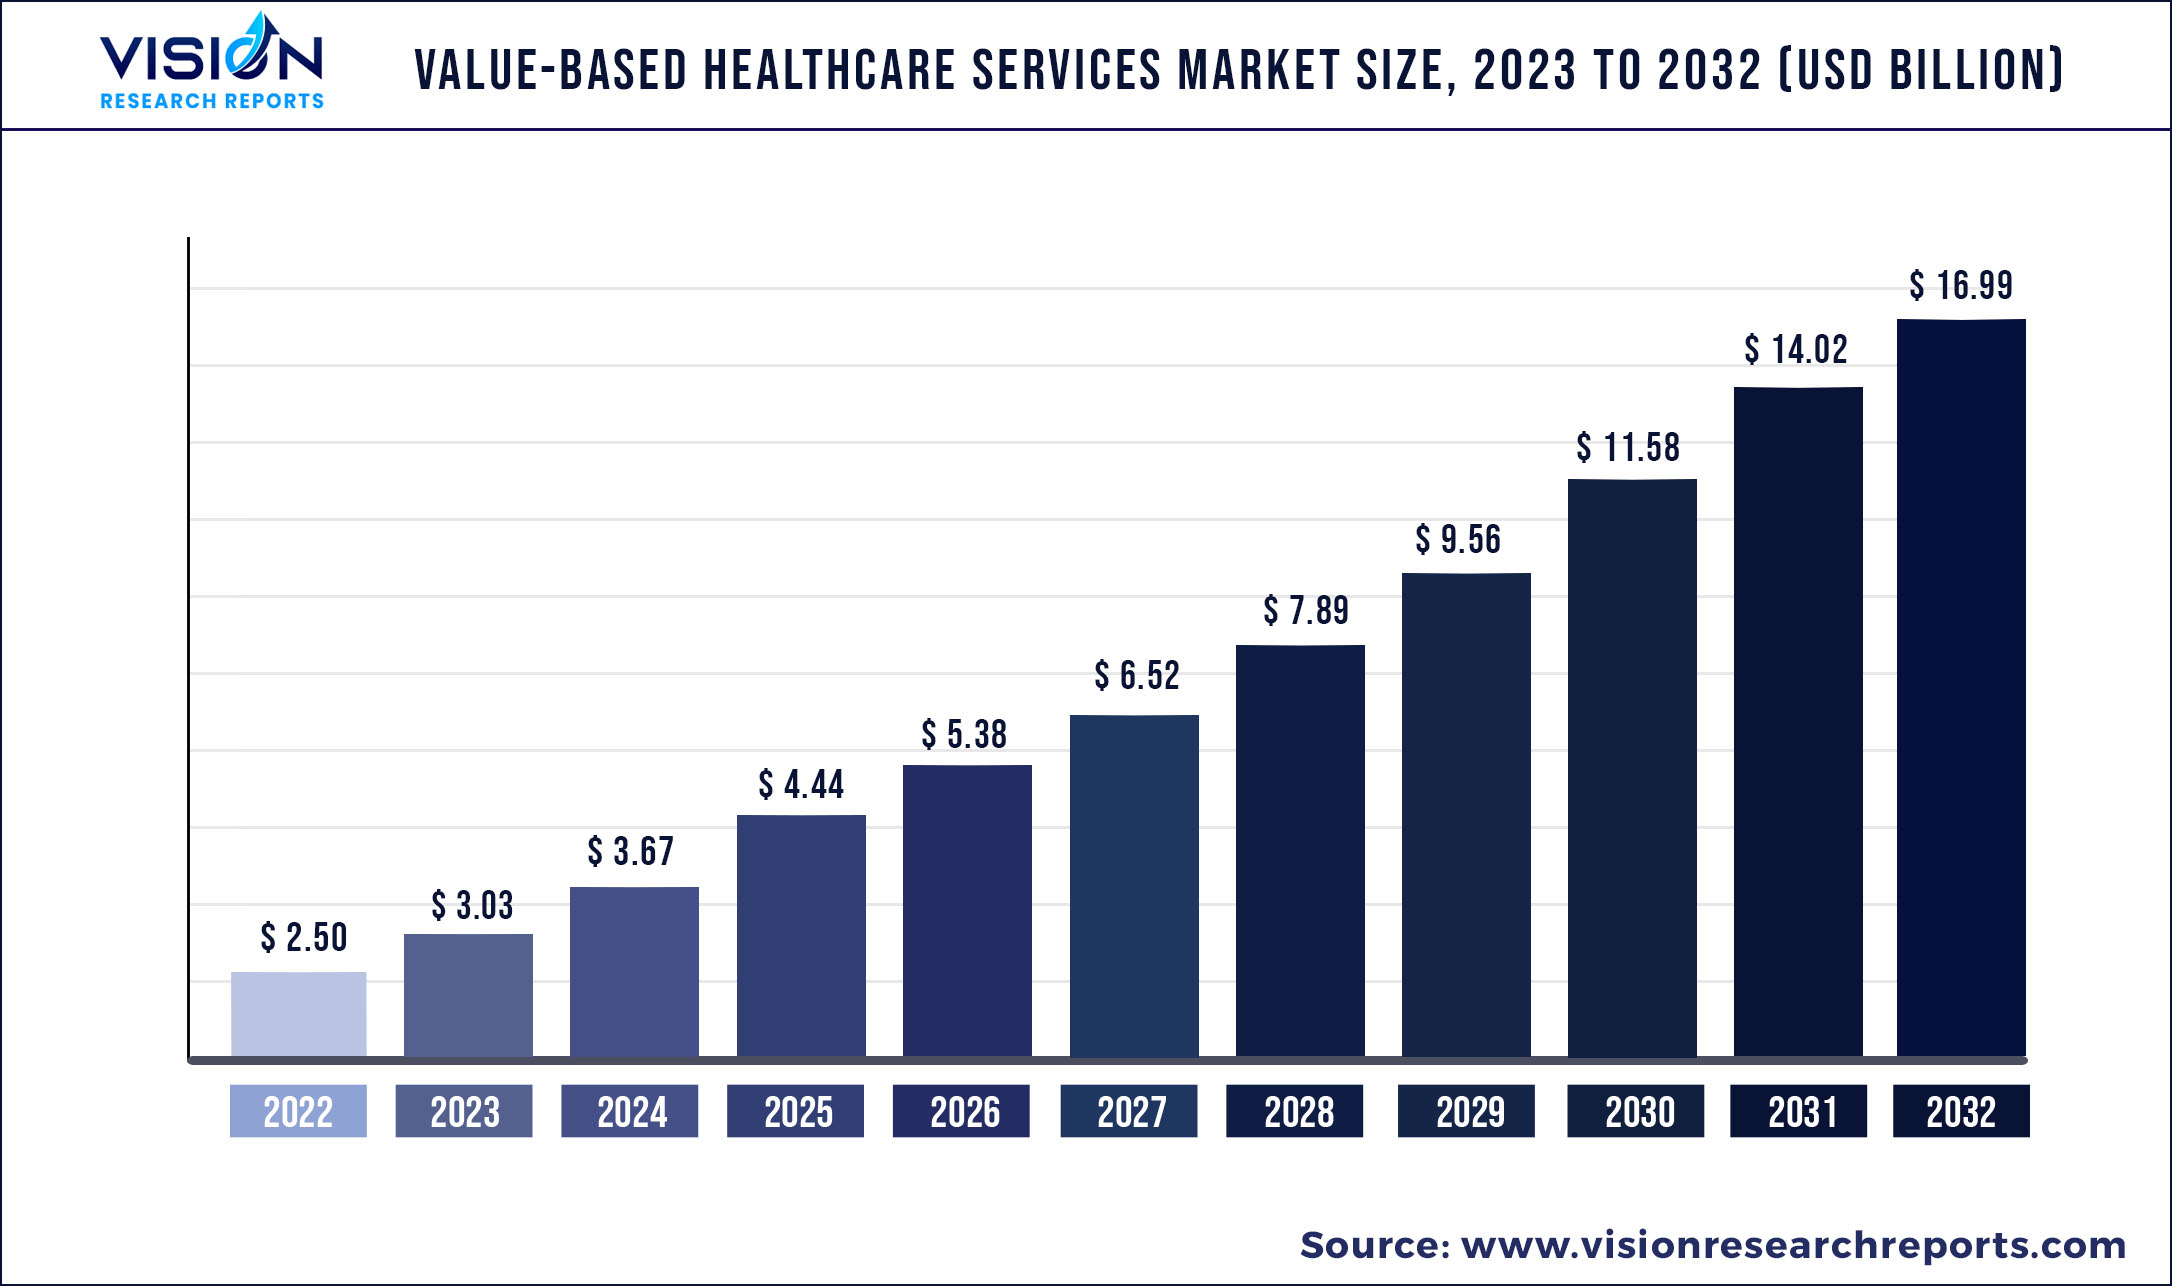
The global value-based healthcare services market was surpassed at USD 2.50 billion in 2022 and is expected to hit around USD 16.99 billion by 2032, growing at a CAGR of 21.12% from 2023 to 2032.
Key Pointers
| Report Coverage | Details |
| Market Size in 2022 | USD 2.50 billion |
| Revenue Forecast by 2032 | USD 16.99 billion |
| Growth rate from 2023 to 2032 | CAGR of 21.12% |
| Base Year | 2022 |
| Forecast Period | 2023 to 2032 |
| Regions Covered | North America, Europe, Asia Pacific, Latin America, Middle East & Africa |
| Companies Covered | Deloitte Touche Tohmatsu Limited, Siemens Healthcare GmbH, Veritas Technologies LLC, Genpact, McKesson Corporation, NXGN Management, LLC, 3M, Koninklijke Philips N.V. |
The introduction of value-based healthcare services has changed the traditional way in which providers used to bill for care. Providers need to pay on the value of care they provide instead of paying based on the number of visits and treatment the patients undergo. This change in the reimbursement platform is driving value-based healthcare services by directing better care at low costs.
Value-based health care is a model, wherein providers such as hospitals are paid based on patient’s health outcome, quality, efficiency, cost, and patient experience. Intense competition among providers and an increase in pressure to lower cost and improve care have led to a shift from volume-based health care to value-based health care. Value-based health care benefits patients, providers, payers, suppliers, and society. It focuses on helping patients toward quick recovery and avoids chronic diseases to achieve better health at lower costs. Providers achieve high patient satisfaction with better care efficiencies. Payers achieve cost control and reduced risk by spreading it among a large number of patients. Value-based health care helps to reduce overall health care spending for society.
Commonly used value-based health care models are pay for performance, accountable care organization, bundled payments, and patient-centered medical home. In the pay for performance model, providers are paid by payers for meeting pre-measured performance thresholds. It is usually implemented by Medicare and private insurers. With the introduction of new health plans and value-based healthcare services are coming together on the solutions which will benefit the patient’s wallet and health. Value based healthcare services address to the rising healthcare expenditure, clinical inefficiency, and repetition of services.
Rapid development in value-based health care services acts as a major driver of the global value-based health care services market during the forecast period. The most significant driver for the rapid development of the global Value Based Healthcare Services market is the healthcare-related risks shifting from the patients to their healthcare providers. With patient-focused healthcare policies having changed the way medical care is delivered, it is now easy to see why the demand for Value Based Healthcare Services rising steadily.
Moreover, the global medical tourism industry is recording good growth numbers every year. This has helped healthcare providers in emerging economies adopt a positive investment option as far as care management solutions are concerned. However, the lack of desired health care infrastructure and Internet connectivity in some regions in developing parts of the world is expected to restrain the global value-based health care services market during the forecast period.
Value-based Healthcare Services Market Segmentations:
| By Model | By Deployment | By End User |
|
Accountable Care Organization (ACO) Patient-centered Medical Home (PCMH) Pay For Performance (P4P) Bundled Payments |
On-premise Cloud |
Hospitals Clinics Insurance Companies Government Others |
Chapter 1. Introduction
1.1. Research Objective
1.2. Scope of the Study
1.3. Definition
Chapter 2. Research Methodology
2.1. Research Approach
2.2. Data Sources
2.3. Assumptions & Limitations
Chapter 3. Executive Summary
3.1. Market Snapshot
Chapter 4. Market Variables and Scope
4.1. Introduction
4.2. Market Classification and Scope
4.3. Industry Value Chain Analysis
4.3.1. Raw Material Procurement Analysis
4.3.2. Sales and Distribution Channel Analysis
4.3.3. Downstream Buyer Analysis
Chapter 5. COVID 19 Impact on Value-based Healthcare Services Market
5.1. COVID-19 Landscape: Value-based Healthcare Services Industry Impact
5.2. COVID 19 - Impact Assessment for the Industry
5.3. COVID 19 Impact: Global Major Government Policy
5.4. Market Trends and Opportunities in the COVID-19 Landscape
Chapter 6. Market Dynamics Analysis and Trends
6.1. Market Dynamics
6.1.1. Market Drivers
6.1.2. Market Restraints
6.1.3. Market Opportunities
6.2. Porter’s Five Forces Analysis
6.2.1. Bargaining power of suppliers
6.2.2. Bargaining power of buyers
6.2.3. Threat of substitute
6.2.4. Threat of new entrants
6.2.5. Degree of competition
Chapter 7. Competitive Landscape
7.1.1. Company Market Share/Positioning Analysis
7.1.2. Key Strategies Adopted by Players
7.1.3. Vendor Landscape
7.1.3.1. List of Suppliers
7.1.3.2. List of Buyers
Chapter 8. Global Value-based Healthcare Services Market, By Model
8.1. Value-based Healthcare Services Market, by Model, 2023-2032
8.1.1 Accountable Care Organization (ACO)
8.1.1.1. Market Revenue and Forecast (2020-2032)
8.1.2. Patient-centered Medical Home (PCMH)
8.1.2.1. Market Revenue and Forecast (2020-2032)
8.1.3. Pay For Performance (P4P)
8.1.3.1. Market Revenue and Forecast (2020-2032)
8.1.4. Bundled Payments
8.1.4.1. Market Revenue and Forecast (2020-2032)
Chapter 9. Global Value-based Healthcare Services Market, By Deployment
9.1. Value-based Healthcare Services Market, by Deployment, 2023-2032
9.1.1. On-premise
9.1.1.1. Market Revenue and Forecast (2020-2032)
9.1.2. Cloud
9.1.2.1. Market Revenue and Forecast (2020-2032)
Chapter 10. Global Value-based Healthcare Services Market, By End User
10.1. Value-based Healthcare Services Market, by End User, 2023-2032
10.1.1. Hospitals
10.1.1.1. Market Revenue and Forecast (2020-2032)
10.1.2. Clinics
10.1.2.1. Market Revenue and Forecast (2020-2032)
10.1.3. Insurance Companies
10.1.3.1. Market Revenue and Forecast (2020-2032)
10.1.4. Government
10.1.4.1. Market Revenue and Forecast (2020-2032)
10.1.5. Others
10.1.5.1. Market Revenue and Forecast (2020-2032)
Chapter 11. Global Value-based Healthcare Services Market, Regional Estimates and Trend Forecast
11.1. North America
11.1.1. Market Revenue and Forecast, by Model (2020-2032)
11.1.2. Market Revenue and Forecast, by Deployment (2020-2032)
11.1.3. Market Revenue and Forecast, by End User (2020-2032)
11.1.4. U.S.
11.1.4.1. Market Revenue and Forecast, by Model (2020-2032)
11.1.4.2. Market Revenue and Forecast, by Deployment (2020-2032)
11.1.4.3. Market Revenue and Forecast, by End User (2020-2032)
11.1.5. Rest of North America
11.1.5.1. Market Revenue and Forecast, by Model (2020-2032)
11.1.5.2. Market Revenue and Forecast, by Deployment (2020-2032)
11.1.5.3. Market Revenue and Forecast, by End User (2020-2032)
11.2. Europe
11.2.1. Market Revenue and Forecast, by Model (2020-2032)
11.2.2. Market Revenue and Forecast, by Deployment (2020-2032)
11.2.3. Market Revenue and Forecast, by End User (2020-2032)
11.2.4. UK
11.2.4.1. Market Revenue and Forecast, by Model (2020-2032)
11.2.4.2. Market Revenue and Forecast, by Deployment (2020-2032)
11.2.4.3. Market Revenue and Forecast, by End User (2020-2032)
11.2.5. Germany
11.2.5.1. Market Revenue and Forecast, by Model (2020-2032)
11.2.5.2. Market Revenue and Forecast, by Deployment (2020-2032)
11.2.5.3. Market Revenue and Forecast, by End User (2020-2032)
11.2.6. France
11.2.6.1. Market Revenue and Forecast, by Model (2020-2032)
11.2.6.2. Market Revenue and Forecast, by Deployment (2020-2032)
11.2.6.3. Market Revenue and Forecast, by End User (2020-2032)
11.2.7. Rest of Europe
11.2.7.1. Market Revenue and Forecast, by Model (2020-2032)
11.2.7.2. Market Revenue and Forecast, by Deployment (2020-2032)
11.2.7.3. Market Revenue and Forecast, by End User (2020-2032)
11.3. APAC
11.3.1. Market Revenue and Forecast, by Model (2020-2032)
11.3.2. Market Revenue and Forecast, by Deployment (2020-2032)
11.3.3. Market Revenue and Forecast, by End User (2020-2032)
11.3.4. India
11.3.4.1. Market Revenue and Forecast, by Model (2020-2032)
11.3.4.2. Market Revenue and Forecast, by Deployment (2020-2032)
11.3.4.3. Market Revenue and Forecast, by End User (2020-2032)
11.3.5. China
11.3.5.1. Market Revenue and Forecast, by Model (2020-2032)
11.3.5.2. Market Revenue and Forecast, by Deployment (2020-2032)
11.3.5.3. Market Revenue and Forecast, by End User (2020-2032)
11.3.6. Japan
11.3.6.1. Market Revenue and Forecast, by Model (2020-2032)
11.3.6.2. Market Revenue and Forecast, by Deployment (2020-2032)
11.3.6.3. Market Revenue and Forecast, by End User (2020-2032)
11.3.7. Rest of APAC
11.3.7.1. Market Revenue and Forecast, by Model (2020-2032)
11.3.7.2. Market Revenue and Forecast, by Deployment (2020-2032)
11.3.7.3. Market Revenue and Forecast, by End User (2020-2032)
11.4. MEA
11.4.1. Market Revenue and Forecast, by Model (2020-2032)
11.4.2. Market Revenue and Forecast, by Deployment (2020-2032)
11.4.3. Market Revenue and Forecast, by End User (2020-2032)
11.4.4. GCC
11.4.4.1. Market Revenue and Forecast, by Model (2020-2032)
11.4.4.2. Market Revenue and Forecast, by Deployment (2020-2032)
11.4.4.3. Market Revenue and Forecast, by End User (2020-2032)
11.4.5. North Africa
11.4.5.1. Market Revenue and Forecast, by Model (2020-2032)
11.4.5.2. Market Revenue and Forecast, by Deployment (2020-2032)
11.4.5.3. Market Revenue and Forecast, by End User (2020-2032)
11.4.6. South Africa
11.4.6.1. Market Revenue and Forecast, by Model (2020-2032)
11.4.6.2. Market Revenue and Forecast, by Deployment (2020-2032)
11.4.6.3. Market Revenue and Forecast, by End User (2020-2032)
11.4.7. Rest of MEA
11.4.7.1. Market Revenue and Forecast, by Model (2020-2032)
11.4.7.2. Market Revenue and Forecast, by Deployment (2020-2032)
11.4.7.3. Market Revenue and Forecast, by End User (2020-2032)
11.5. Latin America
11.5.1. Market Revenue and Forecast, by Model (2020-2032)
11.5.2. Market Revenue and Forecast, by Deployment (2020-2032)
11.5.3. Market Revenue and Forecast, by End User (2020-2032)
11.5.4. Brazil
11.5.4.1. Market Revenue and Forecast, by Model (2020-2032)
11.5.4.2. Market Revenue and Forecast, by Deployment (2020-2032)
11.5.4.3. Market Revenue and Forecast, by End User (2020-2032)
11.5.5. Rest of LATAM
11.5.5.1. Market Revenue and Forecast, by Model (2020-2032)
11.5.5.2. Market Revenue and Forecast, by Deployment (2020-2032)
11.5.5.3. Market Revenue and Forecast, by End User (2020-2032)
Chapter 12. Company Profiles
12.1. Deloitte Touche Tohmatsu Limited
12.1.1. Company Overview
12.1.2. Product Offerings
12.1.3. Financial Performance
12.1.4. Recent Initiatives
12.2. Siemens Healthcare GmbH
12.2.1. Company Overview
12.2.2. Product Offerings
12.2.3. Financial Performance
12.2.4. Recent Initiatives
12.3. Veritas Technologies LLC
12.3.1. Company Overview
12.3.2. Product Offerings
12.3.3. Financial Performance
12.3.4. Recent Initiatives
12.4. Genpact
12.4.1. Company Overview
12.4.2. Product Offerings
12.4.3. Financial Performance
12.4.4. Recent Initiatives
12.5. McKesson Corporation
12.5.1. Company Overview
12.5.2. Product Offerings
12.5.3. Financial Performance
12.5.4. Recent Initiatives
12.6. NXGN Management, LLC
12.6.1. Company Overview
12.6.2. Product Offerings
12.6.3. Financial Performance
12.6.4. Recent Initiatives
12.7. 3M
12.7.1. Company Overview
12.7.2. Product Offerings
12.7.3. Financial Performance
12.7.4. Recent Initiatives
12.8. Koninklijke Philips N.V.
12.8.1. Company Overview
12.8.2. Product Offerings
12.8.3. Financial Performance
12.8.4. Recent Initiatives
Chapter 13. Research Methodology
13.1. Primary Research
13.2. Secondary Research
13.3. Assumptions
Chapter 14. Appendix
14.1. About Us
14.2. Glossary of Terms
 Cross-segment Market Size and Analysis for
Mentioned Segments
Additional Company Profiles (Upto 5 With No Cost)
Additional Countries (Apart From Mentioned Countries)
Country/Region-specific Report
Go To Market Strategy
Region Specific Market DynamicsRegion Level Market Share Import Export AnalysisProduction AnalysisOthers
Cross-segment Market Size and Analysis for
Mentioned Segments
Additional Company Profiles (Upto 5 With No Cost)
Additional Countries (Apart From Mentioned Countries)
Country/Region-specific Report
Go To Market Strategy
Region Specific Market DynamicsRegion Level Market Share Import Export AnalysisProduction AnalysisOthers