Vendor Risk Management Market Size, Growth, Trends | Report 2023-2032
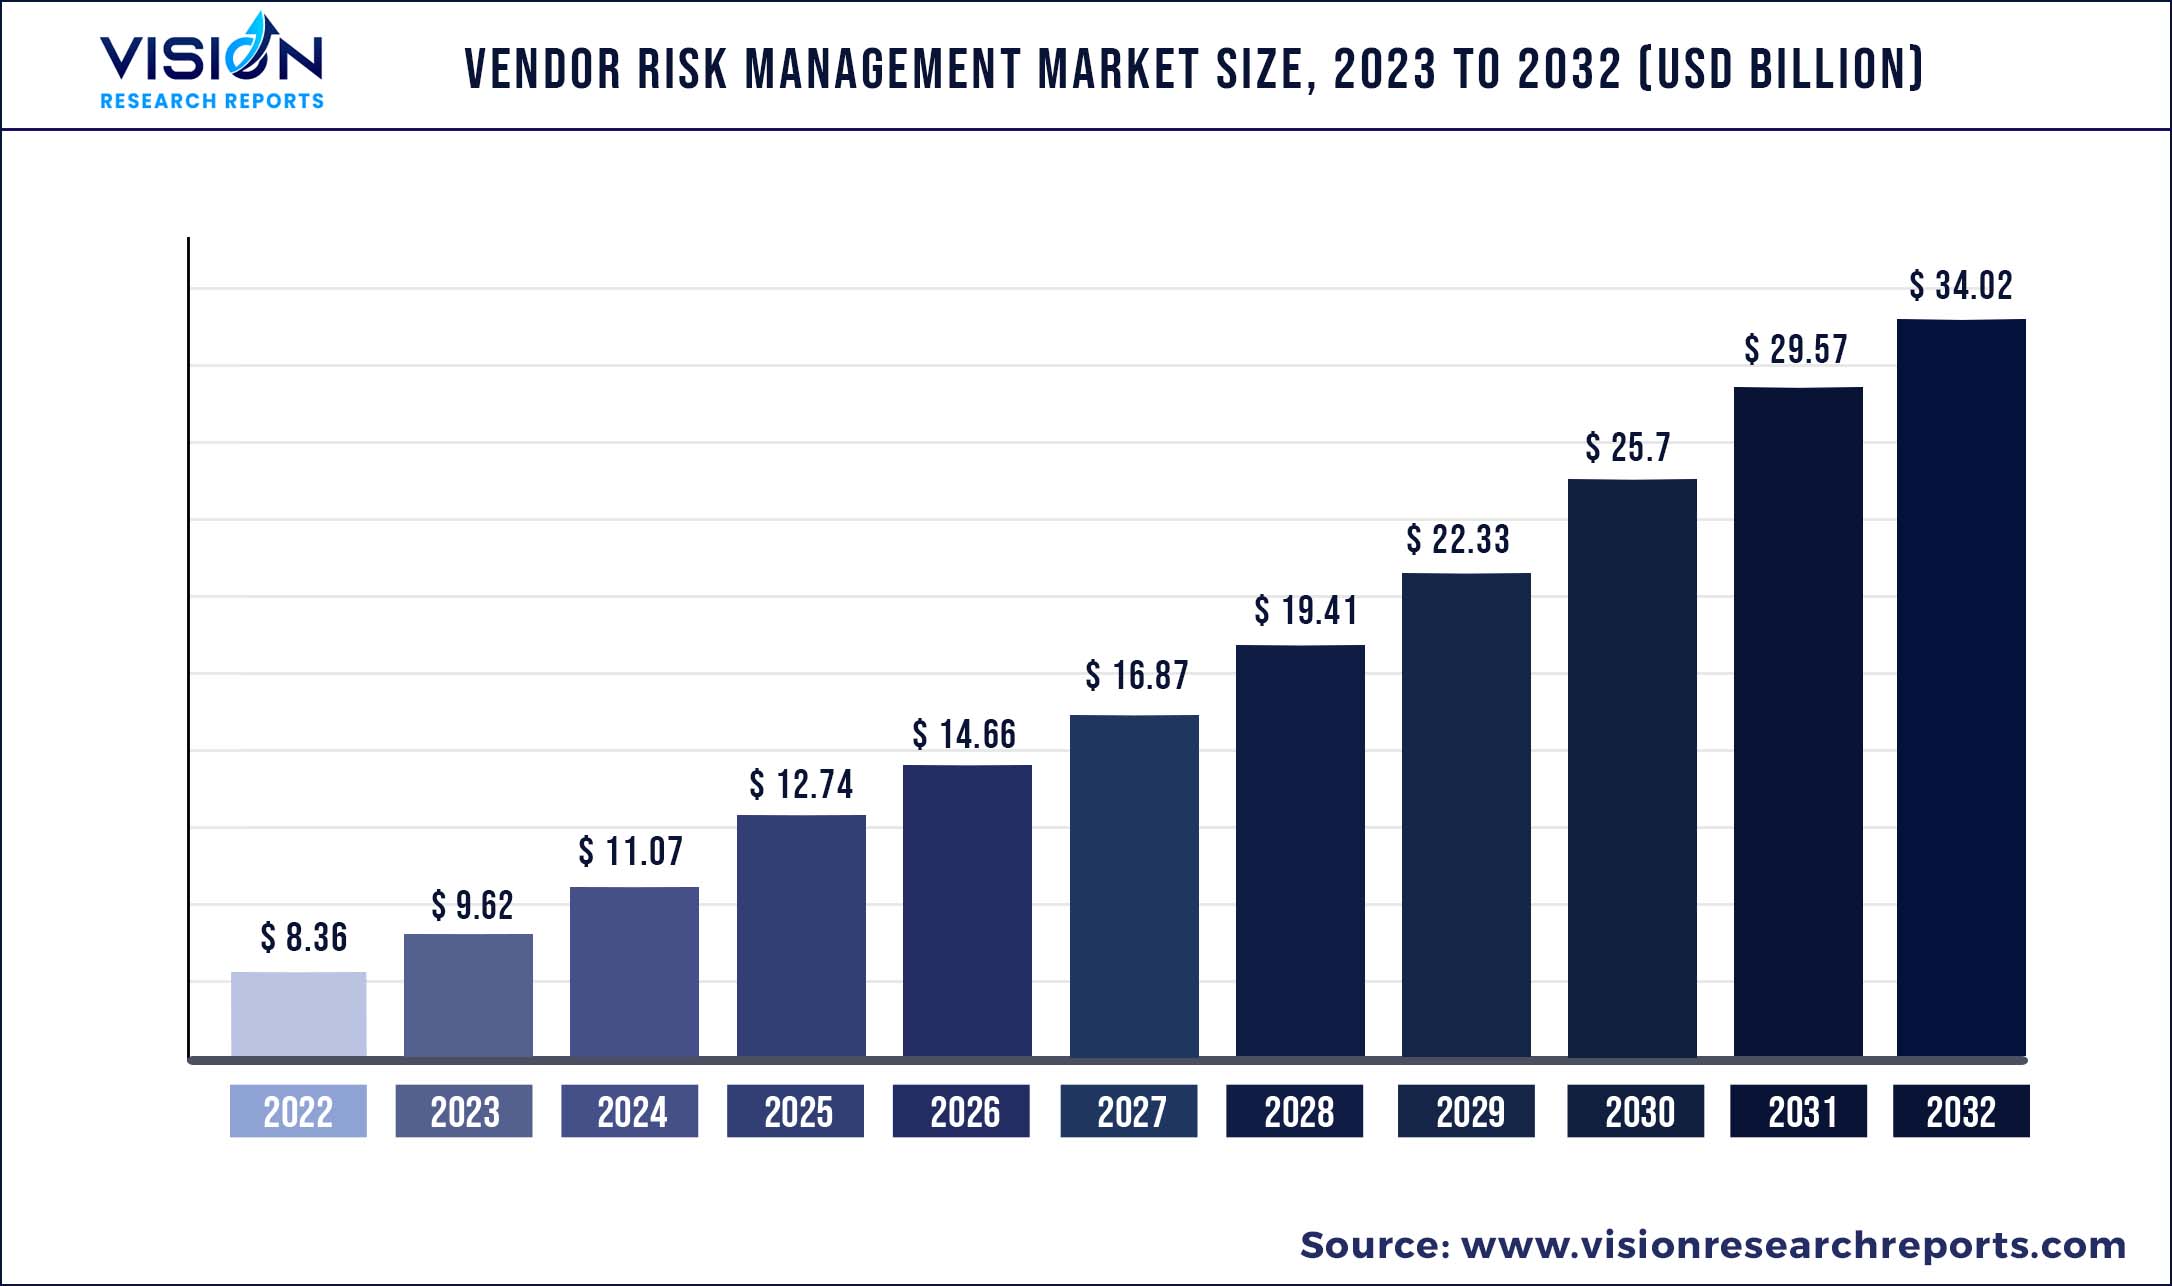
The global vendor risk management market was surpassed at USD 8.36 billion in 2022 and is expected to hit around USD 34.02 billion by 2032, growing at a CAGR of 15.06% from 2023 to 2032.
Key Pointers
Report Scope of the Vendor Risk Management Market
| Report Coverage | Details |
| Market Size in 2022 | USD 8.36 billion |
| Revenue Forecast by 2032 | USD 34.02 billion |
| Growth rate from 2023 to 2032 | CAGR of 15.06% |
| Base Year | 2022 |
| Forecast Period | 2023 to 2032 |
| Regions Covered | North America, Europe, Asia Pacific, Latin America, Middle East & Africa |
| Companies Covered | BitSight Technologies; Genpact; LockPath; MetricStream; Optive Security, Inc.; Rapid Ratings International, Inc.; Resolver, Inc.; RSA Security LLC; SAI Global; Quantivate, LLC |
Enterprises are extensively dependent on a large number of third-party vendors that are located in different geographic locations to achieve their business objectives. Collaborating with these vendors often seems challenging for enterprises as they may bring different risks, which can damage the business objectives and processes. Thus, to mitigate and overcome these risks, enterprises adopt vendor risk management in their business processes.
The market for vendor risk management is majorly driven by the increasing adoption of vendor risk management solutions to efficiently manage complex vendor ecosystems and the growing need among enterprises to reduce the risk associated with managing multiple vendors and enhancing production. Additionally, the growing demand for vendor risk management solutions in the highly regulated industries like manufacturing, healthcare, and banking & finance is expected to offer numerous opportunities for the stakeholders in the forecast period. However, the dependence of organizations on manual and conventional processes to manage risks is hindering market growth.
Amidst the COVID-19 pandemic, as global supply chains were disrupted due to stringent lockdowns and restrictions imposed by governments all over the world, organizations faced several difficulties in managing vendors. Reduced adoption of vendor risk management solutions was observed among industries like manufacturing, banking and finance, retail and consumer goods, and energy that were considerably affected by the crisis, however, these industries were in greater need of the solutions as the risk associated with vendors increased due to the crisis. A rapid increase in the adoption of the solutions was observed in the healthcare and life sciences and IT and telecommunication industries. Thus, the global market is estimated to be moderately affected by the pandemic.
Enterprises hire the best vendors from remote locations to optimize their product delivery, which leads to increased complexity in the supply chain. As a result, the increased risk of disruption is observed in many cases. To overcome this, enterprises are focusing on adopting advanced solutions that create vendor ecosystems in which supplier-supplier relationships emerge efficiently and management becomes easy. Thus, growth in the adoption of vendor risk management solutions is witnessed, which is driving the market. Managing functions of multiple vendors is a tedious activity for any organization through manual and non-formal processes. Thus, enterprises adopt vendor risk management solutions, which ease the enterprises’ task of evaluating the risks associated with different vendors.
Vendor risk management solution also supports the identification of critical issues associated with products and solutions and reduces the organization’s time and efforts in evaluating vendor’s performance based on time accuracy, product and solution delivery, and quality of the product. Thus, with effective vendor risk management, organizations are experiencing enhancement in their production rate, which is thereby contributing to the market growth. Several organizations across the world considerably rely on traditional manual processes to evaluate the risks associated with vendor dependency. These enterprises are unaware of the significance of vendor risk management solutions in reducing vendor risks. Thus, their reluctance in implementing these solutions is hindering market growth.
Vendor Risk Management Market Segmentations:
| By Solution | By Deployment | By Enterprise Size | By End-use |
|
Vendor Information Management Contract Management Financial Control Compliance Management Audit Management Quality Assurance Management |
Cloud On-premises |
Large Enterprises Small & Medium Enterprises |
BFSI IT & Telecom Retail & Consumer Goods Manufacturing Energy & Utilities Healthcare Government Others |
Chapter 1. Introduction
1.1. Research Objective
1.2. Scope of the Study
1.3. Definition
Chapter 2. Research Methodology
2.1. Research Approach
2.2. Data Sources
2.3. Assumptions & Limitations
Chapter 3. Executive Summary
3.1. Market Snapshot
Chapter 4. Market Variables and Scope
4.1. Introduction
4.2. Market Classification and Scope
4.3. Industry Value Chain Analysis
4.3.1. Raw Material Procurement Analysis
4.3.2. Sales and Distribution Channel Analysis
4.3.3. Downstream Buyer Analysis
Chapter 5. COVID 19 Impact on Vendor Risk Management Market
5.1. COVID-19 Landscape: Vendor Risk Management Industry Impact
5.2. COVID 19 - Impact Assessment for the Industry
5.3. COVID 19 Impact: Global Major Government Policy
5.4. Market Trends and Opportunities in the COVID-19 Landscape
Chapter 6. Market Dynamics Analysis and Trends
6.1. Market Dynamics
6.1.1. Market Drivers
6.1.2. Market Restraints
6.1.3. Market Opportunities
6.2. Porter’s Five Forces Analysis
6.2.1. Bargaining power of suppliers
6.2.2. Bargaining power of buyers
6.2.3. Threat of substitute
6.2.4. Threat of new entrants
6.2.5. Degree of competition
Chapter 7. Competitive Landscape
7.1.1. Company Market Share/Positioning Analysis
7.1.2. Key Strategies Adopted by Players
7.1.3. Vendor Landscape
7.1.3.1. List of Suppliers
7.1.3.2. List of Buyers
Chapter 8. Global Vendor Risk Management Market, By Solution
8.1. Vendor Risk Management Market, by Solution, 2023-2032
8.1.1. Vendor Information Management
8.1.1.1. Market Revenue and Forecast (2020-2032)
8.1.2. Contract Management
8.1.2.1. Market Revenue and Forecast (2020-2032)
8.1.3. Financial Control
8.1.3.1. Market Revenue and Forecast (2020-2032)
8.1.4. Compliance Management
8.1.4.1. Market Revenue and Forecast (2020-2032)
8.1.5. Audit Management
8.1.5.1. Market Revenue and Forecast (2020-2032)
8.1.6. Quality Assurance Management
8.1.6.1. Market Revenue and Forecast (2020-2032)
Chapter 9. Global Vendor Risk Management Market, By Deployment
9.1. Vendor Risk Management Market, by Deployment, 2023-2032
9.1.1. Cloud
9.1.1.1. Market Revenue and Forecast (2020-2032)
9.1.2. On-premises
9.1.2.1. Market Revenue and Forecast (2020-2032)
Chapter 10. Global Vendor Risk Management Market, By Enterprise Size
10.1. Vendor Risk Management Market, by Enterprise Size, 2023-2032
10.1.1. Large Enterprises
10.1.1.1. Market Revenue and Forecast (2020-2032)
10.1.2. Small & Medium Enterprises
10.1.2.1. Market Revenue and Forecast (2020-2032)
Chapter 11. Global Vendor Risk Management Market, By End-use
11.1. Vendor Risk Management Market, by End-use, 2023-2032
11.1.1. BFSI
11.1.1.1. Market Revenue and Forecast (2020-2032)
11.1.2. IT & Telecom
11.1.2.1. Market Revenue and Forecast (2020-2032)
11.1.3. Retail & Consumer Goods
11.1.3.1. Market Revenue and Forecast (2020-2032)
11.1.4. Manufacturing
11.1.4.1. Market Revenue and Forecast (2020-2032)
11.1.5. Energy & Utilities
11.1.5.1. Market Revenue and Forecast (2020-2032)
11.1.6. Healthcare
11.1.6.1. Market Revenue and Forecast (2020-2032)
11.1.7. Government
11.1.7.1. Market Revenue and Forecast (2020-2032)
11.1.8. Others
11.1.8.1. Market Revenue and Forecast (2020-2032)
Chapter 12. Global Vendor Risk Management Market, Regional Estimates and Trend Forecast
12.1. North America
12.1.1. Market Revenue and Forecast, by Solution (2020-2032)
12.1.2. Market Revenue and Forecast, by Deployment (2020-2032)
12.1.3. Market Revenue and Forecast, by Enterprise Size (2020-2032)
12.1.4. Market Revenue and Forecast, by End-use (2020-2032)
12.1.5. U.S.
12.1.5.1. Market Revenue and Forecast, by Solution (2020-2032)
12.1.5.2. Market Revenue and Forecast, by Deployment (2020-2032)
12.1.5.3. Market Revenue and Forecast, by Enterprise Size (2020-2032)
12.1.5.4. Market Revenue and Forecast, by End-use (2020-2032)
12.1.6. Rest of North America
12.1.6.1. Market Revenue and Forecast, by Solution (2020-2032)
12.1.6.2. Market Revenue and Forecast, by Deployment (2020-2032)
12.1.6.3. Market Revenue and Forecast, by Enterprise Size (2020-2032)
12.1.6.4. Market Revenue and Forecast, by End-use (2020-2032)
12.2. Europe
12.2.1. Market Revenue and Forecast, by Solution (2020-2032)
12.2.2. Market Revenue and Forecast, by Deployment (2020-2032)
12.2.3. Market Revenue and Forecast, by Enterprise Size (2020-2032)
12.2.4. Market Revenue and Forecast, by End-use (2020-2032)
12.2.5. UK
12.2.5.1. Market Revenue and Forecast, by Solution (2020-2032)
12.2.5.2. Market Revenue and Forecast, by Deployment (2020-2032)
12.2.5.3. Market Revenue and Forecast, by Enterprise Size (2020-2032)
12.2.5.4. Market Revenue and Forecast, by End-use (2020-2032)
12.2.6. Germany
12.2.6.1. Market Revenue and Forecast, by Solution (2020-2032)
12.2.6.2. Market Revenue and Forecast, by Deployment (2020-2032)
12.2.6.3. Market Revenue and Forecast, by Enterprise Size (2020-2032)
12.2.6.4. Market Revenue and Forecast, by End-use (2020-2032)
12.2.7. France
12.2.7.1. Market Revenue and Forecast, by Solution (2020-2032)
12.2.7.2. Market Revenue and Forecast, by Deployment (2020-2032)
12.2.7.3. Market Revenue and Forecast, by Enterprise Size (2020-2032)
12.2.7.4. Market Revenue and Forecast, by End-use (2020-2032)
12.2.8. Rest of Europe
12.2.8.1. Market Revenue and Forecast, by Solution (2020-2032)
12.2.8.2. Market Revenue and Forecast, by Deployment (2020-2032)
12.2.8.3. Market Revenue and Forecast, by Enterprise Size (2020-2032)
12.2.8.4. Market Revenue and Forecast, by End-use (2020-2032)
12.3. APAC
12.3.1. Market Revenue and Forecast, by Solution (2020-2032)
12.3.2. Market Revenue and Forecast, by Deployment (2020-2032)
12.3.3. Market Revenue and Forecast, by Enterprise Size (2020-2032)
12.3.4. Market Revenue and Forecast, by End-use (2020-2032)
12.3.5. India
12.3.5.1. Market Revenue and Forecast, by Solution (2020-2032)
12.3.5.2. Market Revenue and Forecast, by Deployment (2020-2032)
12.3.5.3. Market Revenue and Forecast, by Enterprise Size (2020-2032)
12.3.5.4. Market Revenue and Forecast, by End-use (2020-2032)
12.3.6. China
12.3.6.1. Market Revenue and Forecast, by Solution (2020-2032)
12.3.6.2. Market Revenue and Forecast, by Deployment (2020-2032)
12.3.6.3. Market Revenue and Forecast, by Enterprise Size (2020-2032)
12.3.6.4. Market Revenue and Forecast, by End-use (2020-2032)
12.3.7. Japan
12.3.7.1. Market Revenue and Forecast, by Solution (2020-2032)
12.3.7.2. Market Revenue and Forecast, by Deployment (2020-2032)
12.3.7.3. Market Revenue and Forecast, by Enterprise Size (2020-2032)
12.3.7.4. Market Revenue and Forecast, by End-use (2020-2032)
12.3.8. Rest of APAC
12.3.8.1. Market Revenue and Forecast, by Solution (2020-2032)
12.3.8.2. Market Revenue and Forecast, by Deployment (2020-2032)
12.3.8.3. Market Revenue and Forecast, by Enterprise Size (2020-2032)
12.3.8.4. Market Revenue and Forecast, by End-use (2020-2032)
12.4. MEA
12.4.1. Market Revenue and Forecast, by Solution (2020-2032)
12.4.2. Market Revenue and Forecast, by Deployment (2020-2032)
12.4.3. Market Revenue and Forecast, by Enterprise Size (2020-2032)
12.4.4. Market Revenue and Forecast, by End-use (2020-2032)
12.4.5. GCC
12.4.5.1. Market Revenue and Forecast, by Solution (2020-2032)
12.4.5.2. Market Revenue and Forecast, by Deployment (2020-2032)
12.4.5.3. Market Revenue and Forecast, by Enterprise Size (2020-2032)
12.4.5.4. Market Revenue and Forecast, by End-use (2020-2032)
12.4.6. North Africa
12.4.6.1. Market Revenue and Forecast, by Solution (2020-2032)
12.4.6.2. Market Revenue and Forecast, by Deployment (2020-2032)
12.4.6.3. Market Revenue and Forecast, by Enterprise Size (2020-2032)
12.4.6.4. Market Revenue and Forecast, by End-use (2020-2032)
12.4.7. South Africa
12.4.7.1. Market Revenue and Forecast, by Solution (2020-2032)
12.4.7.2. Market Revenue and Forecast, by Deployment (2020-2032)
12.4.7.3. Market Revenue and Forecast, by Enterprise Size (2020-2032)
12.4.7.4. Market Revenue and Forecast, by End-use (2020-2032)
12.4.8. Rest of MEA
12.4.8.1. Market Revenue and Forecast, by Solution (2020-2032)
12.4.8.2. Market Revenue and Forecast, by Deployment (2020-2032)
12.4.8.3. Market Revenue and Forecast, by Enterprise Size (2020-2032)
12.4.8.4. Market Revenue and Forecast, by End-use (2020-2032)
12.5. Latin America
12.5.1. Market Revenue and Forecast, by Solution (2020-2032)
12.5.2. Market Revenue and Forecast, by Deployment (2020-2032)
12.5.3. Market Revenue and Forecast, by Enterprise Size (2020-2032)
12.5.4. Market Revenue and Forecast, by End-use (2020-2032)
12.5.5. Brazil
12.5.5.1. Market Revenue and Forecast, by Solution (2020-2032)
12.5.5.2. Market Revenue and Forecast, by Deployment (2020-2032)
12.5.5.3. Market Revenue and Forecast, by Enterprise Size (2020-2032)
12.5.5.4. Market Revenue and Forecast, by End-use (2020-2032)
12.5.6. Rest of LATAM
12.5.6.1. Market Revenue and Forecast, by Solution (2020-2032)
12.5.6.2. Market Revenue and Forecast, by Deployment (2020-2032)
12.5.6.3. Market Revenue and Forecast, by Enterprise Size (2020-2032)
12.5.6.4. Market Revenue and Forecast, by End-use (2020-2032)
Chapter 13. Company Profiles
13.1. BitSight Technologies
13.1.1. Company Overview
13.1.2. Product Offerings
13.1.3. Financial Performance
13.1.4. Recent Initiatives
13.2. Genpact
13.2.1. Company Overview
13.2.2. Product Offerings
13.2.3. Financial Performance
13.2.4. Recent Initiatives
13.3. LockPath
13.3.1. Company Overview
13.3.2. Product Offerings
13.3.3. Financial Performance
13.3.4. Recent Initiatives
13.4. MetricStream
13.4.1. Company Overview
13.4.2. Product Offerings
13.4.3. Financial Performance
13.4.4. Recent Initiatives
13.5. Optive Security, Inc.
13.5.1. Company Overview
13.5.2. Product Offerings
13.5.3. Financial Performance
13.5.4. Recent Initiatives
13.6. Rapid Ratings International, Inc.
13.6.1. Company Overview
13.6.2. Product Offerings
13.6.3. Financial Performance
13.6.4. Recent Initiatives
13.7. Resolver, Inc.
13.7.1. Company Overview
13.7.2. Product Offerings
13.7.3. Financial Performance
13.7.4. Recent Initiatives
13.8. RSA Security LLC
13.8.1. Company Overview
13.8.2. Product Offerings
13.8.3. Financial Performance
13.8.4. Recent Initiatives
13.9. SAI Global
13.9.1. Company Overview
13.9.2. Product Offerings
13.9.3. Financial Performance
13.9.4. Recent Initiatives
13.10. Quantivate, LLC
13.10.1. Company Overview
13.10.2. Product Offerings
13.10.3. Financial Performance
13.10.4. Recent Initiatives
Chapter 14. Research Methodology
14.1. Primary Research
14.2. Secondary Research
14.3. Assumptions
Chapter 15. Appendix
15.1. About Us
15.2. Glossary of Terms
 Cross-segment Market Size and Analysis for
Mentioned Segments
Additional Company Profiles (Upto 5 With No Cost)
Additional Countries (Apart From Mentioned Countries)
Country/Region-specific Report
Go To Market Strategy
Region Specific Market DynamicsRegion Level Market Share Import Export AnalysisProduction AnalysisOthers
Cross-segment Market Size and Analysis for
Mentioned Segments
Additional Company Profiles (Upto 5 With No Cost)
Additional Countries (Apart From Mentioned Countries)
Country/Region-specific Report
Go To Market Strategy
Region Specific Market DynamicsRegion Level Market Share Import Export AnalysisProduction AnalysisOthers