Virtual Networking Market Size, Share, Growth, Trends | Report 2023-2032
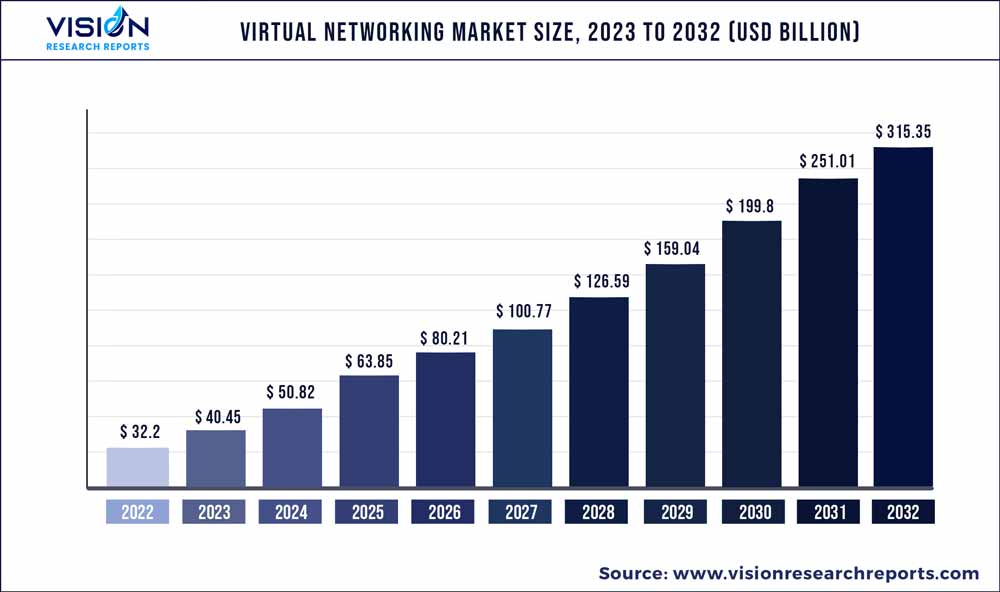
The global virtual networking market was estimated at USD 32.2 billion in 2022 and it is expected to surpass around USD 315.35 billion by 2032, poised to grow at a CAGR of 25.63% from 2023 to 2032.
Key Pointers
Report Scope of the Virtual Networking Market
| Report Coverage | Details |
| Market Size in 2022 | USD 32.2 billion |
| Revenue Forecast by 2032 | USD 315.35 billion |
| Growth rate from 2023 to 2032 | CAGR of 25.63% |
| Base Year | 2022 |
| Forecast Period | 2023 to 2032 |
| Market Analysis (Terms Used) | Value (US$ Million/Billion) or (Volume/Units) |
| Regions Covered | North America, Europe, Asia Pacific, Latin America, Middle East & Africa |
| Companies Covered | Huawei Technologies Co., Ltd.; Hewlett Packard Enterprise Development LP; VMware, Inc.; Cisco Systems, Inc; Microsoft Corporation; IBM Corporation; Citrix Systems, Inc.; Juniper Networks, Inc.; Oracle; Verizon Communications Inc |
Factors such as the growing adoption of Internet-of-Things (IoT) devices, the need for improved network security, the growing adoption of cloud computing, and the rising demand for remote working are the major factors driving the market growth. As more businesses move their applications and infrastructure to the cloud, there is a growing need for virtual networking solutions that can provide secure, high-performance connectivity between different cloud environments.
Integration of virtual switches with Software-defined Networking (SDN) controllers are also expected to drive the demand for the Virtual Networking Market growth. Virtual switches are increasingly being integrated with SDN controllers, which provide centralized management and control of the network infrastructure. This allows for greater flexibility and agility in managing virtual networks and can simplify the deployment of network services such as firewalls, load balancers, and intrusion detection/prevention systems. At the same time, virtual switches are being integrated with cloud orchestration platforms such as Kubernetes and OpenStack, which allow for automated provisioning and management of virtual networks.
Cloud computing and virtual networking solutions are closely interconnected, as virtual networking is an essential component of cloud infrastructure. Cloud computing with virtual networking solutions allows businesses to create a flexible and scalable network infrastructure that can meet the needs of modern applications and workloads. In cloud computing, virtual networking solutions can provide improved performance, reliability, and cost savings compared to traditional networking solutions. By leveraging virtual networking solutions in the cloud, businesses can achieve greater efficiency, agility, and scalability in their IT operations, while also improving security and reducing costs associated with hardware and maintenance
The outbreak of the COVID-19 pandemic had a positive impact on the market. The COVID-19 pandemic has had a significant impact on the adoption and usage of virtual networking solutions, as more businesses and individuals work remotely and rely on cloud-based services. With remote work becoming more prevalent, there is greater emphasis on data security and privacy, driving demand for virtual networking solutions that can provide advanced security features such as encryption, access control, and intrusion detection/prevention. Such factors are anticipated to create more demand for the market over the coming years.
Component Insights
The software segment dominated the market in 2022 and accounted for more than 42.06% share of the global revenue owing to the increasing adoption of Software-defined Networking (SDN) technologies. SDN enables organizations to abstract the network from the underlying hardware, creating a virtualized network infrastructure that is flexible, scalable, and efficient. This has led to a greater demand for software solutions that can provide advanced networking functionality, such as routing, switching, and security, without relying on proprietary hardware. Additionally, the availability of hypervisor software solutions allowing multiple virtual machines to run on a single physical server, has further accelerated the adoption of software solutions in the virtual networking market, providing organizations with cost-effective and customizable solutions.
The services segment is projected to witness remarkable growth over the forecast period owing to the growing demand for professional and managed services that can help organizations plan, design, deploy, and manage virtual networking solutions. As virtual networking becomes more complex and critical to business operations, organizations are looking for specialized services that can provide them with the expertise, resources, and support they need to ensure the successful implementation and operation of their virtual networking solutions. Additionally, the emergence of cloud-based virtual networking solutions has created a greater need for cloud services and support, such as cloud migration, cloud management, and cloud optimization services.
Deployment Insights
The cloud segment dominated the market in 2022 and accounted for more than 55.05% share of the global revenue. As organizations are increasingly adopt cloud computing, they are also looking to leverage the benefits of virtual networking in the cloud, such as flexibility, scalability, and cost-effectiveness. One emerging trend is the use of cloud-based virtual private networks (VPNs), which enable organizations to securely connect their cloud resources to their on-premises network and other cloud-based resources. Additionally, the use of cloud-based load balancers, which can distribute traffic across multiple servers and optimize application performance. As organizations continue to adopt cloud computing, these trends are expected to continue to drive the growth of the cloud segment over the coming years.
The on-premise segment is projected to witness significant growth over the forecast period. Increasing demand for hybrid cloud and multi-cloud environments, which require on-premise virtual networking solutions to securely connect the cloud-based resources with the on-premise resources, is a significant factor driving the segment growth. As organizations adopt more cloud-based services and applications, the need for secure and reliable on-premise virtual networking solutions will continue to grow. Moreover, the use of NFV and SDN solutions to optimize on-premise virtual networking infrastructure is also a significant factor contributing to the growth of the segment.
Enterprise Size Insights
The large enterprises segment dominated the market in 2022 and accounted for more than 68.06% share of the global revenue. Large enterprises across the globe are increasingly adopting cloud-based solutions and infrastructure to increase their scalability. As a result, there is a growing need for virtual networking solutions that can provide secure and reliable connectivity between different cloud environments, as well as between on-premises infrastructure and cloud environments. Moreover, with the rise of remote and hybrid work models, organizations need virtual firewall solutions as employees are accessing corporate resources from various locations and devices. Such factors mentioned above bode well for the growth of the segment over the forecast period.
The small and medium enterprises segment is projected to expand at the highest CAGR over the forecast period as small and medium enterprises are increasingly adopting cloud-based solutions for their IT infrastructure, including cloud storage, SaaS applications, and cloud-hosted servers. Virtual networking solutions can help small & medium enterprises segment to connect their on-premises infrastructure to the cloud, as well as provide secure and reliable connectivity between different cloud environments. Moreover, SDNs can help small & medium enterprises to centralize and automate network management while reducing costs and increasing agility. Such factors are expected to create growth opportunities for the segment over the coming year.
Application Insights
The IT & Telecommunication segment dominated the market in 2022 and accounted for more than 25.02% share of the global revenue. The ability of virtual networking solutions to offer better flexibility, cost savings, and scalability is a major factor driving segment growth. Virtual networking solutions allow IT & telecommunication companies to create, modify, or remove virtual networks as needed to support changing business requirements without the need to deploy and manage physical network infrastructure. This increases agility and reduces costs associated with physical network infrastructure, such as hardware, cabling, and maintenance. Additionally, virtual networking solutions enable companies to scale their networks easily and efficiently without investing in additional hardware or software.
The BFSI segment is expected to grow significantly over the forecast period. BFSI firms are increasingly implementing virtual networking technologies to improve network performance, boost agility, and minimize expenses, thereby contributing to segment growth. BFSI firms may use virtual networking solutions to construct customized and secure virtual networks that are independent of their physical network infrastructure, allowing them to manage better and safeguard critical data. Moreover, virtual networking solutions can offer higher flexibility and scalability than traditional networking solutions, allowing BFSI firms to easily adapt their networks to changing business needs. Additionally, virtual networking solutions may assist BFSI businesses in lowering the cost of hardware and maintenance associated with traditional network infrastructure while boosting network performance and dependability.
Regional Insights
The North America region dominated the market in 2022 and accounted for more than 30.06% share of the global revenue. North America is experiencing significant growth due to the increasing demand for cloud computing, software-defined networking (SDN), and Network Function Virtualization (NFV) solutions. Cloud computing adoption is boosting demand for virtual networking solutions in North America as businesses migrate their IT infrastructure to the cloud to improve agility, save costs, and increase scalability. Because of its capacity to consolidate and automate network administration while lowering costs and enhancing agility, SDN is gaining popularity in North America. Those elements mentioned above point to a positive outlook for the region's economy throughout the anticipated period.
The Asia Pacific region is anticipated to emerge as the fastest-growing segment over the forecast period. Increasing adoption of hybrid cloud models, where organizations use a combination of public and private clouds to achieve greater flexibility, scalability, and cost-effectiveness is a significant factor contributing to the regional growth. Cloud computing also includes the use of virtual routers and virtual firewalls, as well as more sophisticated technologies such as Zero Trust Network Access (ZTNA) and Secure Service Edge (SSE), to safeguard workloads as they migrate to the public cloud.
Virtual Networking Market Segmentations:
By Component
By Deployment
By Enterprise Size
By Application
By Regional
Chapter 1. Introduction
1.1. Research Objective
1.2. Scope of the Study
1.3. Definition
Chapter 2. Research Methodology
2.1. Research Approach
2.2. Data Sources
2.3. Assumptions & Limitations
Chapter 3. Executive Summary
3.1. Market Snapshot
Chapter 4. Market Variables and Scope
4.1. Introduction
4.2. Market Classification and Scope
4.3. Industry Value Chain Analysis
4.3.1. Raw Material Procurement Analysis
4.3.2. Sales and Distribution Channel Analysis
4.3.3. Downstream Buyer Analysis
Chapter 5. COVID 19 Impact on Virtual Networking Market
5.1. COVID-19 Landscape: Virtual Networking Industry Impact
5.2. COVID 19 - Impact Assessment for the Industry
5.3. COVID 19 Impact: Global Major Government Policy
5.4. Market Trends and Opportunities in the COVID-19 Landscape
Chapter 6. Market Dynamics Analysis and Trends
6.1. Market Dynamics
6.1.1. Market Drivers
6.1.2. Market Restraints
6.1.3. Market Opportunities
6.2. Porter’s Five Forces Analysis
6.2.1. Bargaining power of suppliers
6.2.2. Bargaining power of buyers
6.2.3. Threat of substitute
6.2.4. Threat of new entrants
6.2.5. Degree of competition
Chapter 7. Competitive Landscape
7.1.1. Company Market Share/Positioning Analysis
7.1.2. Key Strategies Adopted by Players
7.1.3. Vendor Landscape
7.1.3.1. List of Suppliers
7.1.3.2. List of Buyers
Chapter 8. Global Virtual Networking Market, By Component
8.1. Virtual Networking Market, by Component, 2023-2032
8.1.1. Hardware
8.1.1.1. Market Revenue and Forecast (2020-2032)
8.1.2. Software
8.1.2.1. Market Revenue and Forecast (2020-2032)
8.1.3. Services
8.1.3.1. Market Revenue and Forecast (2020-2032)
Chapter 9. Global Virtual Networking Market, By Deployment
9.1. Virtual Networking Market, by Deployment, 2023-2032
9.1.1. On-Premise
9.1.1.1. Market Revenue and Forecast (2020-2032)
9.1.2. Cloud
9.1.2.1. Market Revenue and Forecast (2020-2032)
Chapter 10. Global Virtual Networking Market, By Enterprise Size
10.1. Virtual Networking Market, by Enterprise Size, 2023-2032
10.1.1. Large Enterprises
10.1.1.1. Market Revenue and Forecast (2020-2032)
10.1.2. Small & Medium Enterprises
10.1.2.1. Market Revenue and Forecast (2020-2032)
Chapter 11. Global Virtual Networking Market, By Application
11.1. Virtual Networking Market, by Application, 2023-2032
11.1.1. BFSI
11.1.1.1. Market Revenue and Forecast (2020-2032)
11.1.2. Public sector
11.1.2.1. Market Revenue and Forecast (2020-2032)
11.1.3. Manufacturing
11.1.3.1. Market Revenue and Forecast (2020-2032)
11.1.4. Hospitality
11.1.4.1. Market Revenue and Forecast (2020-2032)
11.1.5. IT and Telecommunication
11.1.5.1. Market Revenue and Forecast (2020-2032)
11.1.6. Healthcare
11.1.6.1. Market Revenue and Forecast (2020-2032)
11.1.7. Others
11.1.7.1. Market Revenue and Forecast (2020-2032)
Chapter 12. Global Virtual Networking Market, Regional Estimates and Trend Forecast
12.1. North America
12.1.1. Market Revenue and Forecast, by Component (2020-2032)
12.1.2. Market Revenue and Forecast, by Deployment (2020-2032)
12.1.3. Market Revenue and Forecast, by Enterprise Size (2020-2032)
12.1.4. Market Revenue and Forecast, by Application (2020-2032)
12.1.5. U.S.
12.1.5.1. Market Revenue and Forecast, by Component (2020-2032)
12.1.5.2. Market Revenue and Forecast, by Deployment (2020-2032)
12.1.5.3. Market Revenue and Forecast, by Enterprise Size (2020-2032)
12.1.5.4. Market Revenue and Forecast, by Application (2020-2032)
12.1.6. Rest of North America
12.1.6.1. Market Revenue and Forecast, by Component (2020-2032)
12.1.6.2. Market Revenue and Forecast, by Deployment (2020-2032)
12.1.6.3. Market Revenue and Forecast, by Enterprise Size (2020-2032)
12.1.6.4. Market Revenue and Forecast, by Application (2020-2032)
12.2. Europe
12.2.1. Market Revenue and Forecast, by Component (2020-2032)
12.2.2. Market Revenue and Forecast, by Deployment (2020-2032)
12.2.3. Market Revenue and Forecast, by Enterprise Size (2020-2032)
12.2.4. Market Revenue and Forecast, by Application (2020-2032)
12.2.5. UK
12.2.5.1. Market Revenue and Forecast, by Component (2020-2032)
12.2.5.2. Market Revenue and Forecast, by Deployment (2020-2032)
12.2.5.3. Market Revenue and Forecast, by Enterprise Size (2020-2032)
12.2.5.4. Market Revenue and Forecast, by Application (2020-2032)
12.2.6. Germany
12.2.6.1. Market Revenue and Forecast, by Component (2020-2032)
12.2.6.2. Market Revenue and Forecast, by Deployment (2020-2032)
12.2.6.3. Market Revenue and Forecast, by Enterprise Size (2020-2032)
12.2.6.4. Market Revenue and Forecast, by Application (2020-2032)
12.2.7. France
12.2.7.1. Market Revenue and Forecast, by Component (2020-2032)
12.2.7.2. Market Revenue and Forecast, by Deployment (2020-2032)
12.2.7.3. Market Revenue and Forecast, by Enterprise Size (2020-2032)
12.2.7.4. Market Revenue and Forecast, by Application (2020-2032)
12.2.8. Rest of Europe
12.2.8.1. Market Revenue and Forecast, by Component (2020-2032)
12.2.8.2. Market Revenue and Forecast, by Deployment (2020-2032)
12.2.8.3. Market Revenue and Forecast, by Enterprise Size (2020-2032)
12.2.8.4. Market Revenue and Forecast, by Application (2020-2032)
12.3. APAC
12.3.1. Market Revenue and Forecast, by Component (2020-2032)
12.3.2. Market Revenue and Forecast, by Deployment (2020-2032)
12.3.3. Market Revenue and Forecast, by Enterprise Size (2020-2032)
12.3.4. Market Revenue and Forecast, by Application (2020-2032)
12.3.5. India
12.3.5.1. Market Revenue and Forecast, by Component (2020-2032)
12.3.5.2. Market Revenue and Forecast, by Deployment (2020-2032)
12.3.5.3. Market Revenue and Forecast, by Enterprise Size (2020-2032)
12.3.5.4. Market Revenue and Forecast, by Application (2020-2032)
12.3.6. China
12.3.6.1. Market Revenue and Forecast, by Component (2020-2032)
12.3.6.2. Market Revenue and Forecast, by Deployment (2020-2032)
12.3.6.3. Market Revenue and Forecast, by Enterprise Size (2020-2032)
12.3.6.4. Market Revenue and Forecast, by Application (2020-2032)
12.3.7. Japan
12.3.7.1. Market Revenue and Forecast, by Component (2020-2032)
12.3.7.2. Market Revenue and Forecast, by Deployment (2020-2032)
12.3.7.3. Market Revenue and Forecast, by Enterprise Size (2020-2032)
12.3.7.4. Market Revenue and Forecast, by Application (2020-2032)
12.3.8. Rest of APAC
12.3.8.1. Market Revenue and Forecast, by Component (2020-2032)
12.3.8.2. Market Revenue and Forecast, by Deployment (2020-2032)
12.3.8.3. Market Revenue and Forecast, by Enterprise Size (2020-2032)
12.3.8.4. Market Revenue and Forecast, by Application (2020-2032)
12.4. MEA
12.4.1. Market Revenue and Forecast, by Component (2020-2032)
12.4.2. Market Revenue and Forecast, by Deployment (2020-2032)
12.4.3. Market Revenue and Forecast, by Enterprise Size (2020-2032)
12.4.4. Market Revenue and Forecast, by Application (2020-2032)
12.4.5. GCC
12.4.5.1. Market Revenue and Forecast, by Component (2020-2032)
12.4.5.2. Market Revenue and Forecast, by Deployment (2020-2032)
12.4.5.3. Market Revenue and Forecast, by Enterprise Size (2020-2032)
12.4.5.4. Market Revenue and Forecast, by Application (2020-2032)
12.4.6. North Africa
12.4.6.1. Market Revenue and Forecast, by Component (2020-2032)
12.4.6.2. Market Revenue and Forecast, by Deployment (2020-2032)
12.4.6.3. Market Revenue and Forecast, by Enterprise Size (2020-2032)
12.4.6.4. Market Revenue and Forecast, by Application (2020-2032)
12.4.7. South Africa
12.4.7.1. Market Revenue and Forecast, by Component (2020-2032)
12.4.7.2. Market Revenue and Forecast, by Deployment (2020-2032)
12.4.7.3. Market Revenue and Forecast, by Enterprise Size (2020-2032)
12.4.7.4. Market Revenue and Forecast, by Application (2020-2032)
12.4.8. Rest of MEA
12.4.8.1. Market Revenue and Forecast, by Component (2020-2032)
12.4.8.2. Market Revenue and Forecast, by Deployment (2020-2032)
12.4.8.3. Market Revenue and Forecast, by Enterprise Size (2020-2032)
12.4.8.4. Market Revenue and Forecast, by Application (2020-2032)
12.5. Latin America
12.5.1. Market Revenue and Forecast, by Component (2020-2032)
12.5.2. Market Revenue and Forecast, by Deployment (2020-2032)
12.5.3. Market Revenue and Forecast, by Enterprise Size (2020-2032)
12.5.4. Market Revenue and Forecast, by Application (2020-2032)
12.5.5. Brazil
12.5.5.1. Market Revenue and Forecast, by Component (2020-2032)
12.5.5.2. Market Revenue and Forecast, by Deployment (2020-2032)
12.5.5.3. Market Revenue and Forecast, by Enterprise Size (2020-2032)
12.5.5.4. Market Revenue and Forecast, by Application (2020-2032)
12.5.6. Rest of LATAM
12.5.6.1. Market Revenue and Forecast, by Component (2020-2032)
12.5.6.2. Market Revenue and Forecast, by Deployment (2020-2032)
12.5.6.3. Market Revenue and Forecast, by Enterprise Size (2020-2032)
12.5.6.4. Market Revenue and Forecast, by Application (2020-2032)
Chapter 13. Company Profiles
13.1. Huawei Technologies Co., Ltd.
13.1.1. Company Overview
13.1.2. Product Offerings
13.1.3. Financial Performance
13.1.4. Recent Initiatives
13.2. Hewlett Packard Enterprise Development LP
13.2.1. Company Overview
13.2.2. Product Offerings
13.2.3. Financial Performance
13.2.4. Recent Initiatives
13.3. VMware, Inc.
13.3.1. Company Overview
13.3.2. Product Offerings
13.3.3. Financial Performance
13.3.4. Recent Initiatives
13.4. Cisco Systems, Inc
13.4.1. Company Overview
13.4.2. Product Offerings
13.4.3. Financial Performance
13.4.4. Recent Initiatives
13.5. Microsoft Corporation
13.5.1. Company Overview
13.5.2. Product Offerings
13.5.3. Financial Performance
13.5.4. Recent Initiatives
13.6. IBM Corporation
13.6.1. Company Overview
13.6.2. Product Offerings
13.6.3. Financial Performance
13.6.4. Recent Initiatives
13.7. Citrix Systems, Inc.
13.7.1. Company Overview
13.7.2. Product Offerings
13.7.3. Financial Performance
13.7.4. Recent Initiatives
13.8. Juniper Networks, Inc.
13.8.1. Company Overview
13.8.2. Product Offerings
13.8.3. Financial Performance
13.8.4. Recent Initiatives
13.9. Oracle
13.9.1. Company Overview
13.9.2. Product Offerings
13.9.3. Financial Performance
13.9.4. Recent Initiatives
13.10. Verizon Communications Inc
13.10.1. Company Overview
13.10.2. Product Offerings
13.10.3. Financial Performance
13.10.4. Recent Initiatives
Chapter 14. Research Methodology
14.1. Primary Research
14.2. Secondary Research
14.3. Assumptions
Chapter 15. Appendix
15.1. About Us
15.2. Glossary of Terms
 Cross-segment Market Size and Analysis for
Mentioned Segments
Additional Company Profiles (Upto 5 With No Cost)
Additional Countries (Apart From Mentioned Countries)
Country/Region-specific Report
Go To Market Strategy
Region Specific Market DynamicsRegion Level Market Share Import Export AnalysisProduction AnalysisOthers
Cross-segment Market Size and Analysis for
Mentioned Segments
Additional Company Profiles (Upto 5 With No Cost)
Additional Countries (Apart From Mentioned Countries)
Country/Region-specific Report
Go To Market Strategy
Region Specific Market DynamicsRegion Level Market Share Import Export AnalysisProduction AnalysisOthers