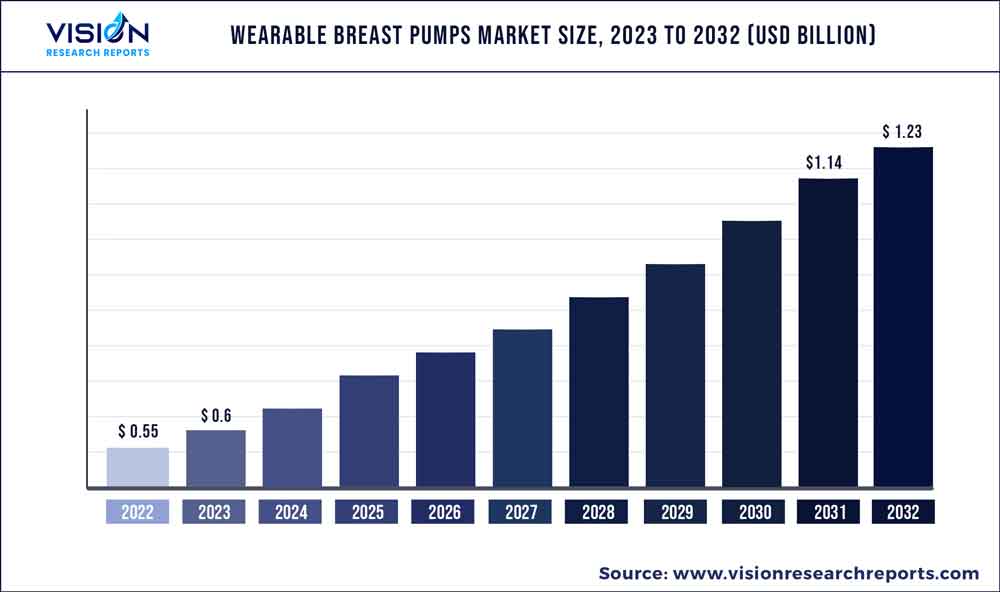
The global wearable breast pumps market size was estimated at around USD 0.55 billion in 2022 and it is projected to hit around USD 1.23 billion by 2032, growing at a CAGR of 8.41% from 2023 to 2032. The wearable breast pumps market in the United States was accounted for USD 20.7 million in 2022.

Key Pointers
Report Scope of the Wearable Breast Pumps Market
| Report Coverage | Details |
| Revenue Share of North America in 2022 | 53% |
| Revenue Forecast by 2032 | USD 1.23 billion |
| Growth Rate from 2023 to 2032 | CAGR of 8.41 |
| Base Year | 2022 |
| Forecast Period | 2023 to 2032 |
| Market Analysis (Terms Used) | Value (US$ Million/Billion) or (Volume/Units) |
| Companies Covered | Medela AG, Ameda, Inc., Willow Innovations, Inc. Philips, Elvie (Chiaro Component Ltd), Freemie, BabyBuddha Products, LLC, Spectra, iAPOY, Lavie Mom. |
A worldwide surge in women’s employment rate is expected to increase the demand for wearable breast pumps. For instance, as per International Labor Office, in 2018 the women employment rate in developed countries was 52.4% which further increased in developing countries with 69.3%. Similarly, the women employment rate in Sub-Saharan Africa region has also increased to 64.7%. Working women have a relatively high disposable income and less time to breastfeed their babies and thus, are ideal customers for wearable breast pumps.
The growing consumer awareness about wearable breast pumps, coupled with the development in healthcare infrastructure in emerging economies is expected to positively impact the market growth during the forecast period. For instance, awareness initiatives by government organizations to feed babies with expressed breastmilk using breast pumps during the COVID-19 pandemic are expected to have a positive impact on the market. Thus, increased usage of wearable breast pumps in the wake of rising precautionary measures is anticipated to drive the market.
Various market players, such as Medela LLC, Laura & Co., Newell Brands, and Ameda, & universities, including Washington University & Fudan University, are raising awareness among women about breastfeeding accessories and their benefits by arranging campaigns and providing informative magazines. In addition, social media platforms, such as YouTube, Facebook, and Instagram, have enabled individuals to access information about breast pumps and related accessories.
Various private and public companies provide insurance coverage for wearable breast pumps. For instance, Medela offers insurance coverage for its breast pump products and related accessories. Medela also rents hospital-grade breast pumps for ample duration to mothers who cannot afford to buy a new pump. Such factors are anticipated to drive the growth of the market in the U.S. Furthermore, the Affordable Care Act mandates that a mother should be provided with an electric/manual breast pump once the baby is born. These factors are expected to support market growth over the forecast period.
The increasing number of milk banks is anticipated to boost the demand for wearable breast pumps over the forecast period. For instance, as per the European Milk Bank Association as of 2021, there are 280 milk banks in the European region, with 17 more milk banks under development. Additionally, as per CGTN America, there are 225 milk banks in Brazil as well.
The presence of various e-commerce sites offering wearable breast pumps drives the sales of the products. Product penetration through online networks is rapidly increasing, as it allows the end users to compare and select suitable products based on their brand, type, price, and point of sales. Amazon, Bodily, Haakaa are some of the notable e-commerce websites and companies which offer significant discounts, and prompt customer service on various breast pumps & breastfeeding accessories. Thus, the easy availability of different wearable breast pumps on online platforms is expected to drive market growth in the coming years.
Many companies are adopting strategies such as product launches, collaboration, and partnerships to strengthen their market presence. For instance, in January 2023, Willow Innovations, Inc., announced the launch of its official Apple Watch companion app for Willow 3.0 pumps. The Willow 3.0 offers mothers greater mobility when pumping because it is the first wearable pump with a smartwatch companion app. Thus, with such initiatives taken by various companies, the market is expected to witness considerable growth in the upcoming years.
Component Insights
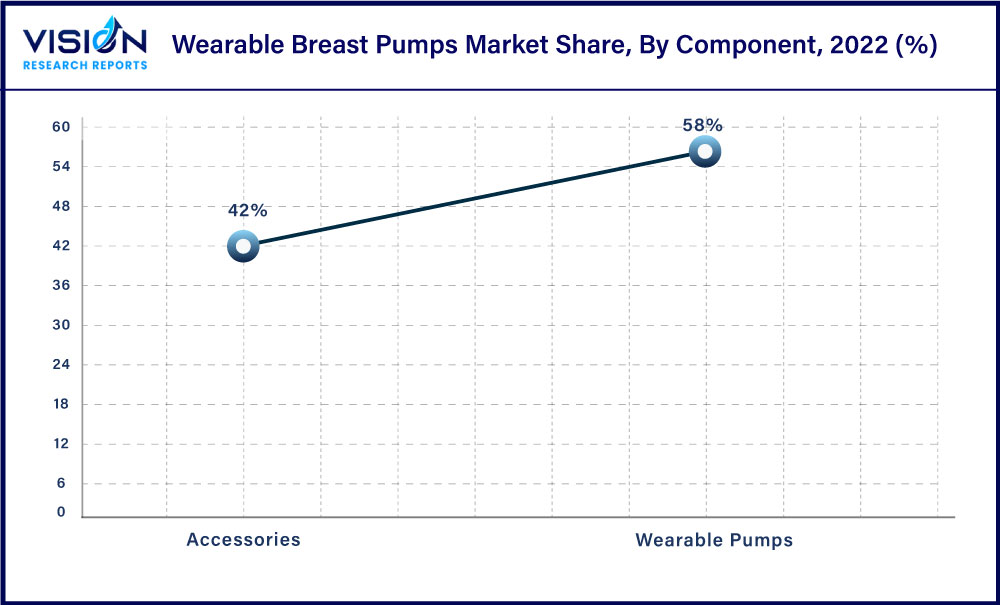
Based on components, the market is segmented into wearable pumps and accessories. The wearable pumps segment dominated the component segment with a market share of 58% in 2022. This can be accredited to rise in population and increasing in number of working women. For instance, as per World Data Bank, the fertility rate in India is 2.20 births per women. Similarly, as per CDC, 3.6 million infants were born in 2020, in the U.S. alone. Thereby impelling the market growth over the forecast period.

Moreover, governments of various countries encourage mothers to breastfeed babies up to the age of 6 months and international agencies help in arranging campaigns to raise awareness about breastfeeding. These factors are expected to drive the segment’s growth during the forecast period.
Furthermore, this segment is also expected to grow at a highest growth rate (CAGR) of 8.53% from 2023 to 2032 owing to rising online and e-commerce accessibility of wearable pumps. Favorable reimbursement policies is a major factor expected to drive growth of this segment. For instance, in the U.S., Medicaid covers most of the wearable pumps, such as smart, battery powered or manual, under its insurance guidelines. Such policies are anticipated to increase the sales of these products over the forecast period.
Technology Insights
Based on technology, the market is segmented into manual, battery powered, and smart breast pumps. Battery powered wearable breast pumps segment dominated the overall market in terms of revenue as of 2022 with a share of 49%. The factors driving the growth of the segment are the surge in women employment rates, growing awareness about the availability of technologically advanced breast pumps and improving healthcare infrastructure in emerging economies.
Battery-operated breast pumps are easy to transport and can be used in small spaces and are comparatively less time-consuming and tiring. They are best suited for mothers who need to pump occasionally and do not prefer manual pumps. Moreover, the market players are consistently investing on R&D to develop smaller and lighter battery-operated wearable breast pumps, as this technology is gaining acceptance from working women. Thus, contributing to the segment growth.
The smart wearable breast pumps segment is expected to expand at the rate of CAGR 8.92% from 2023 to 2032. The introduction of technologically advanced products such as Elvie wearable electric breast pump, Freemie Liberty wearable breast pump, and Willow Generation 3, are anticipated to drive the segment growth. This high-tech wearable breast pump is connected with a mobile application that provides vital information such as milk volume, previous pumping session, and pumping time. It is best suited for women uncomfortable with cumbersome pumping devices. In addition, these pumps are preferred in working places without established designated spaces for expressing milk.
Moreover, there have been several product launches in a smart wearable breast pump. For instance, In September 2021, Elvie launched its new product Elvie Stride, which is a new smart, ultra-quiet, hands-free breast pump and the company's first product to be widely covered by insurance in the U.S. This new device will only be accessible to consumers in the U.S., where 80% of the breast pump sales are attributed to the insurance market.
Regional Insights
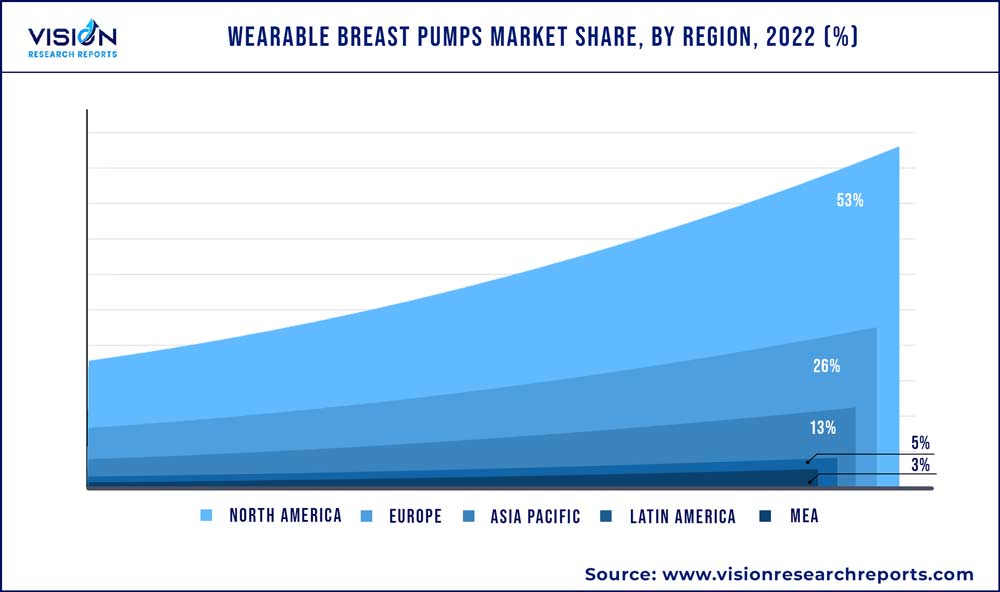
North America dominated the wearable breast pump market with a market share of 53% in 2022. This dominance can be attributed to increasing in various government initiatives. For instance, various awareness campaigns by CDC, WHO, and ABM to feed babies with expressed breastmilk using breast pumps is expected to have a positive impact on the market. Moreover, CDC has been encouraging women to feed babies with breast milk. In addition, CDC has also laid guidelines & recommendations regarding the proper storage and preparation of breast milk on their website, which is anticipated to increase awareness regarding the importance of breast milk among women, thereby impelling the market growth.

However, Asia Pacific is anticipated to witness the fastest growth of 10.44% during the forecast period. This can be attributed to the well-established healthcare facilities, government support, and a decrease in infant mortality rate. For instance, according to Workplace Gender Equality Agency, Australia, women comprise 47.4% of the total working population. Moreover, Australian Breastfeeding accessories Association promotes the use of breast pump and increase awareness among women, thereby propelling the market to grow at 8.8% during the forecast period. Furthermore, the infant mortality rate in Japan has decreased to 1.8 in 2019. Hence, the above-mentioned factors are anticipated to propel the wearable breast pump market in Asia Pacific.
Wearable Breast Pumps Market Segmentations:
By Component
By Technology
By Regional
Chapter 1. Introduction
1.1. Research Objective
1.2. Scope of the Study
1.3. Definition
Chapter 2. Research Methodology
2.1. Research Approach
2.2. Data Sources
2.3. Assumptions & Limitations
Chapter 3. Executive Summary
3.1. Market Snapshot
Chapter 4. Market Variables and Scope
4.1. Introduction
4.2. Market Classification and Scope
4.3. Industry Value Chain Analysis
4.3.1. Raw Material Procurement Analysis
4.3.2. Sales and Distribution Channel Analysis
4.3.3. Downstream Buyer Analysis
Chapter 5. COVID 19 Impact on Wearable Breast Pumps Market
5.1. COVID-19 Landscape: Wearable Breast Pumps Industry Impact
5.2. COVID 19 - Impact Assessment for the Industry
5.3. COVID 19 Impact: Global Major Government Policy
5.4. Market Trends and Opportunities in the COVID-19 Landscape
Chapter 6. Market Dynamics Analysis and Trends
6.1. Market Dynamics
6.1.1. Market Drivers
6.1.2. Market Restraints
6.1.3. Market Opportunities
6.2. Porter’s Five Forces Analysis
6.2.1. Bargaining power of suppliers
6.2.2. Bargaining power of buyers
6.2.3. Threat of substitute
6.2.4. Threat of new entrants
6.2.5. Degree of competition
Chapter 7. Competitive Landscape
7.1.1. Company Market Share/Positioning Analysis
7.1.2. Key Strategies Adopted by Players
7.1.3. Vendor Landscape
7.1.3.1. List of Suppliers
7.1.3.2. List of Buyers
Chapter 8. Global Wearable Breast Pumps Market, By Component
8.1. Wearable Breast Pumps Market, by Component, 2023-2032
8.1.1. Wearable Pumps
8.1.1.1. Market Revenue and Forecast (2020-2032)
8.1.2. Accessories
8.1.2.1. Market Revenue and Forecast (2020-2032)
Chapter 9. Global Wearable Breast Pumps Market, By Technology
9.1. Wearable Breast Pumps Market, by Technology, 2023-2032
9.1.1. Manual Wearable Breast Pumps
9.1.1.1. Market Revenue and Forecast (2020-2032)
9.1.2. Battery Operated Wearable Breast Pumps
9.1.2.1. Market Revenue and Forecast (2020-2032)
9.1.3. Smart Wearable Breast Pumps
9.1.3.1. Market Revenue and Forecast (2020-2032)
Chapter 10. Global Wearable Breast Pumps Market, Regional Estimates and Trend Forecast
10.1. North America
10.1.1. Market Revenue and Forecast, by Component (2020-2032)
10.1.2. Market Revenue and Forecast, by Technology (2020-2032)
10.1.3. U.S.
10.1.3.1. Market Revenue and Forecast, by Component (2020-2032)
10.1.3.2. Market Revenue and Forecast, by Technology (2020-2032)
10.1.4. Rest of North America
10.1.4.1. Market Revenue and Forecast, by Component (2020-2032)
10.1.4.2. Market Revenue and Forecast, by Technology (2020-2032)
10.2. Europe
10.2.1. Market Revenue and Forecast, by Component (2020-2032)
10.2.2. Market Revenue and Forecast, by Technology (2020-2032)
10.2.3. UK
10.2.3.1. Market Revenue and Forecast, by Component (2020-2032)
10.2.3.2. Market Revenue and Forecast, by Technology (2020-2032)
10.2.4. Germany
10.2.4.1. Market Revenue and Forecast, by Component (2020-2032)
10.2.4.2. Market Revenue and Forecast, by Technology (2020-2032)
10.2.5. France
10.2.5.1. Market Revenue and Forecast, by Component (2020-2032)
10.2.5.2. Market Revenue and Forecast, by Technology (2020-2032)
10.2.6. Rest of Europe
10.2.6.1. Market Revenue and Forecast, by Component (2020-2032)
10.2.6.2. Market Revenue and Forecast, by Technology (2020-2032)
10.3. APAC
10.3.1. Market Revenue and Forecast, by Component (2020-2032)
10.3.2. Market Revenue and Forecast, by Technology (2020-2032)
10.3.3. India
10.3.3.1. Market Revenue and Forecast, by Component (2020-2032)
10.3.3.2. Market Revenue and Forecast, by Technology (2020-2032)
10.3.4. China
10.3.4.1. Market Revenue and Forecast, by Component (2020-2032)
10.3.4.2. Market Revenue and Forecast, by Technology (2020-2032)
10.3.5. Japan
10.3.5.1. Market Revenue and Forecast, by Component (2020-2032)
10.3.5.2. Market Revenue and Forecast, by Technology (2020-2032)
10.3.6. Rest of APAC
10.3.6.1. Market Revenue and Forecast, by Component (2020-2032)
10.3.6.2. Market Revenue and Forecast, by Technology (2020-2032)
10.4. MEA
10.4.1. Market Revenue and Forecast, by Component (2020-2032)
10.4.2. Market Revenue and Forecast, by Technology (2020-2032)
10.4.3. GCC
10.4.3.1. Market Revenue and Forecast, by Component (2020-2032)
10.4.3.2. Market Revenue and Forecast, by Technology (2020-2032)
10.4.4. North Africa
10.4.4.1. Market Revenue and Forecast, by Component (2020-2032)
10.4.4.2. Market Revenue and Forecast, by Technology (2020-2032)
10.4.5. South Africa
10.4.5.1. Market Revenue and Forecast, by Component (2020-2032)
10.4.5.2. Market Revenue and Forecast, by Technology (2020-2032)
10.4.6. Rest of MEA
10.4.6.1. Market Revenue and Forecast, by Component (2020-2032)
10.4.6.2. Market Revenue and Forecast, by Technology (2020-2032)
10.5. Latin America
10.5.1. Market Revenue and Forecast, by Component (2020-2032)
10.5.2. Market Revenue and Forecast, by Technology (2020-2032)
10.5.3. Brazil
10.5.3.1. Market Revenue and Forecast, by Component (2020-2032)
10.5.3.2. Market Revenue and Forecast, by Technology (2020-2032)
10.5.4. Rest of LATAM
10.5.4.1. Market Revenue and Forecast, by Component (2020-2032)
10.5.4.2. Market Revenue and Forecast, by Technology (2020-2032)
Chapter 11. Company Profiles
11.1. Medela AG,
11.1.1. Company Overview
11.1.2. Product Offerings
11.1.3. Financial Performance
11.1.4. Recent Initiatives
11.2. Ameda, Inc.,
11.2.1. Company Overview
11.2.2. Product Offerings
11.2.3. Financial Performance
11.2.4. Recent Initiatives
11.3. Willow Innovations, Inc.
11.3.1. Company Overview
11.3.2. Product Offerings
11.3.3. Financial Performance
11.3.4. Recent Initiatives
11.4. Philips
11.4.1. Company Overview
11.4.2. Product Offerings
11.4.3. Financial Performance
11.4.4. LTE Scientific
11.5. Elvie (Chiaro Component Ltd)
11.5.1. Company Overview
11.5.2. Product Offerings
11.5.3. Financial Performance
11.5.4. Recent Initiatives
11.6. Freemie
11.6.1. Company Overview
11.6.2. Product Offerings
11.6.3. Financial Performance
11.6.4. Recent Initiatives
11.7. BabyBuddha Products
11.7.1. Company Overview
11.7.2. Product Offerings
11.7.3. Financial Performance
11.7.4. Recent Initiatives
11.8. LLC
11.8.1. Company Overview
11.8.2. Product Offerings
11.8.3. Financial Performance
11.8.4. Recent Initiatives
11.9. Spectra
11.9.1. Company Overview
11.9.2. Product Offerings
11.9.3. Financial Performance
11.9.4. Recent Initiatives
11.10. iAPOY
11.10.1. Company Overview
11.10.2. Product Offerings
11.10.3. Financial Performance
11.10.4. Recent Initiatives
Chapter 12. Research Methodology
12.1. Primary Research
12.2. Secondary Research
12.3. Assumptions
Chapter 13. Appendix
13.1. About Us
13.2. Glossary of Terms
 Cross-segment Market Size and Analysis for
Mentioned Segments
 Additional Company Profiles (Upto 5 With No Cost)
 Additional Countries (Apart From Mentioned Countries)
 Country/Region-specific Report
 Go To Market Strategy
 Region Specific Market Dynamics
 Region Level Market Share
 Import Export Analysis
 Production Analysis
 Others