Wearable Technology Market Size, Growth, Trends | Report 2023-2032
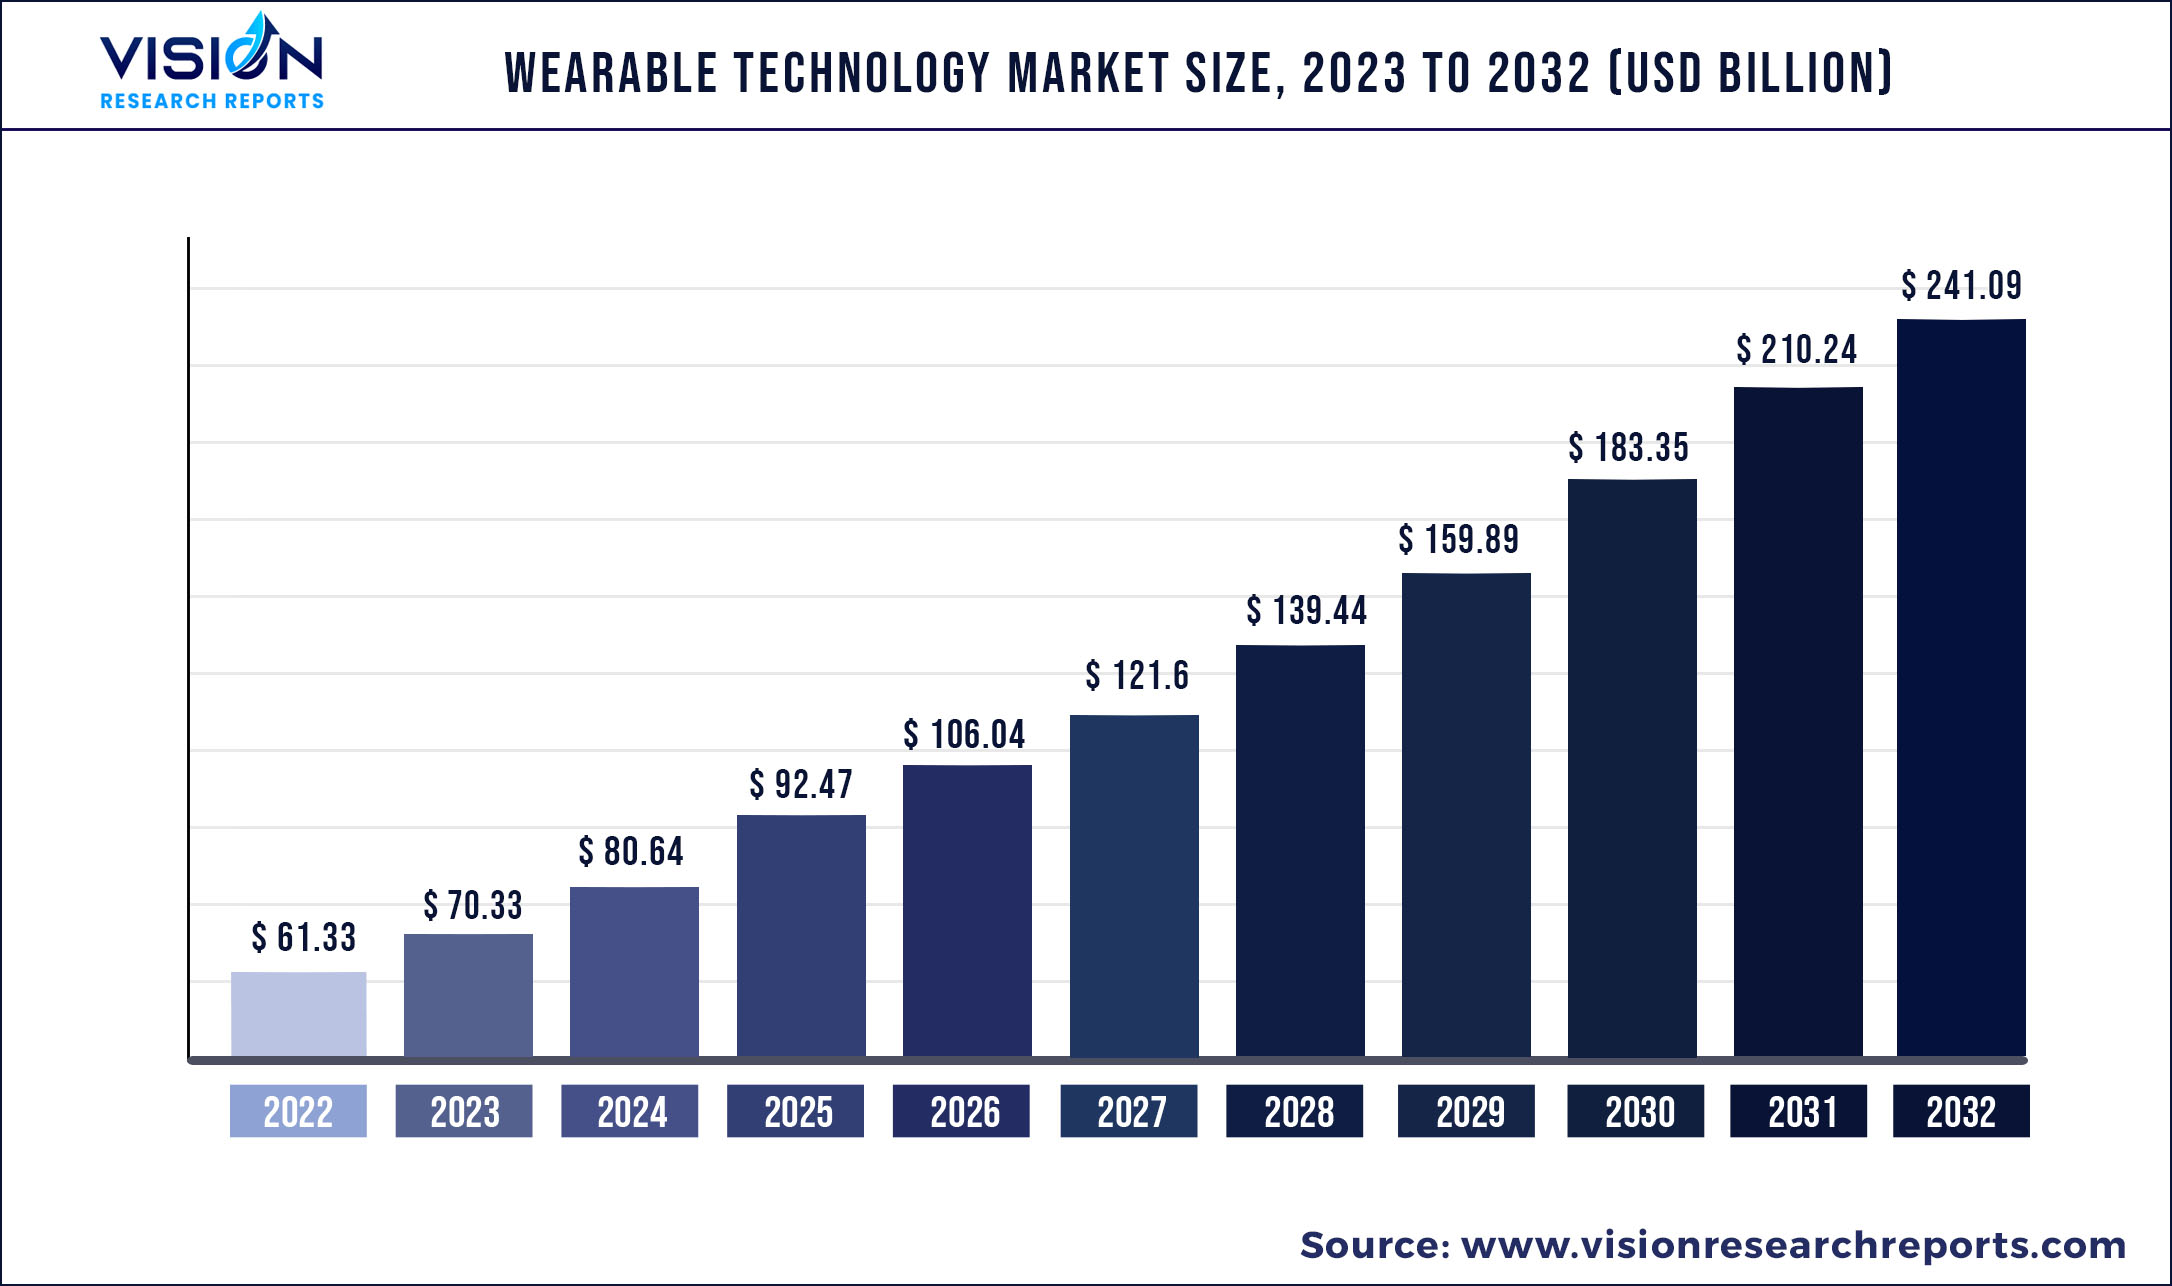
The global wearable technology market was surpassed at USD 61.33 billion in 2022 and is expected to hit around USD 241.09 billion by 2032, growing at a CAGR of 14.67% from 2023 to 2032.
Key Pointers
| Report Coverage | Details |
| Market Size in 2022 | USD 61.33 billion |
| Revenue Forecast by 2032 | USD 241.09 billion |
| Growth rate from 2023 to 2032 | CAGR of 14.67% |
| Base Year | 2022 |
| Forecast Period | 2023 to 2032 |
| Regions Covered | North America, Europe, Asia Pacific, Latin America, Middle East & Africa |
| Companies Covered | Apple Inc.; Samsung Electronics Co., Ltd.; Fitbit, Inc.; Garmin Ltd.; Huami Co. Ltd.; Fossil Group, Inc. |
The increasing adoption of smart wearable technology products among consumers is driving industry growth. These devices aid in monitoring health by keeping track of cholesterol levels, calories burnt, oxygen levels, etc., through sensors. In addition, several companies, such as Fitbit, Samsung, Noise, and Fossil Group, Inc., are introducing wearable technology watches and other accessories with health tracking solutions. Such a feature is anticipated to attract consumers as it helps them check their health, which paves the way for market growth.
For instance, in March 2022, Xiaomi Corp. launched the latest Xiaomi Watch S1 Series. It has 117 fitness modes and tracks blood oxygen saturation, health monitoring, and sleep monitoring. It has magnetic charge capabilities along with Amazon’s Alexa voice assistant. Rapid changes in consumer demographics, such as changing lifestyle patterns and preferences, are expected to boost product demand, which is anticipated to drive industry growth. In addition, high consumer spending on personal care products is projected to support the demand for wearable devices. The demand for smartwatches among swimmers, cyclists, runners, and gym-goers is high as they aid in tracking the calories burnt, hourly activity, and stationary time.
In addition, many vendors are focused on introducing products with multiple sports options, a large display, a better battery, and a rugged metal casing attracting athletes. This is expected to drive industry growth. Integrating AI and AR technologies enable manufacturers to add new advanced features to their products. For instance, the Adaptive EQ technology introduced by Apple, Inc. with the launch of their AirPods in 2021 tunes the sound in real-time based on the profile and fit of the user’s ear. The advent of technology has led to the integration of smart wearables in clothing, also known as smart clothing. Smart or IoT-based apparel are electrical components integrated into clothing that offer services, which can be used in larger smart systems through communication-based protocols.
The use of wearable devices in healthcare is rising due to the pandemic as these products offer advantages and benefits to both patients and healthcare providers. Some of these benefits include real-time health monitoring of vital statistics and earlier detection of disease or risk of a significant health event. Wearable technologies and ear-worn have witnessed robust growth as consumers rely on these devices for remote work, health tracking, fitness activities, and more. However, the increasing availability of counterfeit products is expected to challenge market growth. A rise in the production of low-cost fraudulent devices with more offerings and benefits is expected to restrain the growth of the industry as consumers usually opt for products offering similar features at a considerably lower price.
Wearable Technology Market Segmentations:
| By Product | By Application |
|
Wrist-Wear Eyewear & Headwear Footwear Neckwear Body-Wear Others |
Consumer Electronics Healthcare Enterprise & Industrial Applications Others |
Chapter 1. Introduction
1.1. Research Objective
1.2. Scope of the Study
1.3. Definition
Chapter 2. Research Methodology
2.1. Research Approach
2.2. Data Sources
2.3. Assumptions & Limitations
Chapter 3. Executive Summary
3.1. Market Snapshot
Chapter 4. Market Variables and Scope
4.1. Introduction
4.2. Market Classification and Scope
4.3. Industry Value Chain Analysis
4.3.1. Raw Material Procurement Analysis
4.3.2. Sales and Distribution Channel Analysis
4.3.3. Downstream Buyer Analysis
Chapter 5. COVID 19 Impact on Wearable Technology Market
5.1. COVID-19 Landscape: Wearable Technology Industry Impact
5.2. COVID 19 - Impact Assessment for the Industry
5.3. COVID 19 Impact: Global Major Government Policy
5.4. Market Trends and Opportunities in the COVID-19 Landscape
Chapter 6. Market Dynamics Analysis and Trends
6.1. Market Dynamics
6.1.1. Market Drivers
6.1.2. Market Restraints
6.1.3. Market Opportunities
6.2. Porter’s Five Forces Analysis
6.2.1. Bargaining power of suppliers
6.2.2. Bargaining power of buyers
6.2.3. Threat of substitute
6.2.4. Threat of new entrants
6.2.5. Degree of competition
Chapter 7. Competitive Landscape
7.1.1. Company Market Share/Positioning Analysis
7.1.2. Key Strategies Adopted by Players
7.1.3. Vendor Landscape
7.1.3.1. List of Suppliers
7.1.3.2. List of Buyers
Chapter 8. Global Wearable Technology Market, By Product
8.1. Wearable Technology Market, by Product, 2023-2032
8.1.1. Wrist-Wear
8.1.1.1. Market Revenue and Forecast (2020-2032)
8.1.2. Eyewear & Headwear
8.1.2.1. Market Revenue and Forecast (2020-2032)
8.1.3. Footwear
8.1.3.1. Market Revenue and Forecast (2020-2032)
8.1.4. Neckwear
8.1.4.1. Market Revenue and Forecast (2020-2032)
8.1.5. Body-Wear
8.1.5.1. Market Revenue and Forecast (2020-2032)
8.1.6. Others
8.1.6.1. Market Revenue and Forecast (2020-2032)
Chapter 9. Global Wearable Technology Market, By Application
9.1. Wearable Technology Market, by Application, 2023-2032
9.1.1. Consumer Electronics
9.1.1.1. Market Revenue and Forecast (2020-2032)
9.1.2. Healthcare
9.1.2.1. Market Revenue and Forecast (2020-2032)
9.1.3. Enterprise & Industrial Applications
9.1.3.1. Market Revenue and Forecast (2020-2032)
9.1.4. Others
9.1.4.1. Market Revenue and Forecast (2020-2032)
Chapter 10. Global Wearable Technology Market, Regional Estimates and Trend Forecast
10.1. North America
10.1.1. Market Revenue and Forecast, by Product (2020-2032)
10.1.2. Market Revenue and Forecast, by Application (2020-2032)
10.1.3. U.S.
10.1.3.1. Market Revenue and Forecast, by Product (2020-2032)
10.1.3.2. Market Revenue and Forecast, by Application (2020-2032)
10.1.4. Rest of North America
10.1.4.1. Market Revenue and Forecast, by Product (2020-2032)
10.1.4.2. Market Revenue and Forecast, by Application (2020-2032)
10.2. Europe
10.2.1. Market Revenue and Forecast, by Product (2020-2032)
10.2.2. Market Revenue and Forecast, by Application (2020-2032)
10.2.3. UK
10.2.3.1. Market Revenue and Forecast, by Product (2020-2032)
10.2.3.2. Market Revenue and Forecast, by Application (2020-2032)
10.2.4. Germany
10.2.4.1. Market Revenue and Forecast, by Product (2020-2032)
10.2.4.2. Market Revenue and Forecast, by Application (2020-2032)
10.2.5. France
10.2.5.1. Market Revenue and Forecast, by Product (2020-2032)
10.2.5.2. Market Revenue and Forecast, by Application (2020-2032)
10.2.6. Rest of Europe
10.2.6.1. Market Revenue and Forecast, by Product (2020-2032)
10.2.6.2. Market Revenue and Forecast, by Application (2020-2032)
10.3. APAC
10.3.1. Market Revenue and Forecast, by Product (2020-2032)
10.3.2. Market Revenue and Forecast, by Application (2020-2032)
10.3.3. India
10.3.3.1. Market Revenue and Forecast, by Product (2020-2032)
10.3.3.2. Market Revenue and Forecast, by Application (2020-2032)
10.3.4. China
10.3.4.1. Market Revenue and Forecast, by Product (2020-2032)
10.3.4.2. Market Revenue and Forecast, by Application (2020-2032)
10.3.5. Japan
10.3.5.1. Market Revenue and Forecast, by Product (2020-2032)
10.3.5.2. Market Revenue and Forecast, by Application (2020-2032)
10.3.6. Rest of APAC
10.3.6.1. Market Revenue and Forecast, by Product (2020-2032)
10.3.6.2. Market Revenue and Forecast, by Application (2020-2032)
10.4. MEA
10.4.1. Market Revenue and Forecast, by Product (2020-2032)
10.4.2. Market Revenue and Forecast, by Application (2020-2032)
10.4.3. GCC
10.4.3.1. Market Revenue and Forecast, by Product (2020-2032)
10.4.3.2. Market Revenue and Forecast, by Application (2020-2032)
10.4.4. North Africa
10.4.4.1. Market Revenue and Forecast, by Product (2020-2032)
10.4.4.2. Market Revenue and Forecast, by Application (2020-2032)
10.4.5. South Africa
10.4.5.1. Market Revenue and Forecast, by Product (2020-2032)
10.4.5.2. Market Revenue and Forecast, by Application (2020-2032)
10.4.6. Rest of MEA
10.4.6.1. Market Revenue and Forecast, by Product (2020-2032)
10.4.6.2. Market Revenue and Forecast, by Application (2020-2032)
10.5. Latin America
10.5.1. Market Revenue and Forecast, by Product (2020-2032)
10.5.2. Market Revenue and Forecast, by Application (2020-2032)
10.5.3. Brazil
10.5.3.1. Market Revenue and Forecast, by Product (2020-2032)
10.5.3.2. Market Revenue and Forecast, by Application (2020-2032)
10.5.4. Rest of LATAM
10.5.4.1. Market Revenue and Forecast, by Product (2020-2032)
10.5.4.2. Market Revenue and Forecast, by Application (2020-2032)
Chapter 11. Company Profiles
11.1. Apple Inc.
11.1.1. Company Overview
11.1.2. Product Offerings
11.1.3. Financial Performance
11.1.4. Recent Initiatives
11.2. Samsung Electronics Co., Ltd.
11.2.1. Company Overview
11.2.2. Product Offerings
11.2.3. Financial Performance
11.2.4. Recent Initiatives
11.3. Fitbit, Inc.
11.3.1. Company Overview
11.3.2. Product Offerings
11.3.3. Financial Performance
11.3.4. Recent Initiatives
11.4. Garmin Ltd.
11.4.1. Company Overview
11.4.2. Product Offerings
11.4.3. Financial Performance
11.4.4. LTE Scientific
11.5. Huami Co. Ltd.
11.5.1. Company Overview
11.5.2. Product Offerings
11.5.3. Financial Performance
11.5.4. Recent Initiatives
11.6. Fossil Group, Inc.
11.6.1. Company Overview
11.6.2. Product Offerings
11.6.3. Financial Performance
11.6.4. Recent Initiatives
Chapter 12. Research Methodology
12.1. Primary Research
12.2. Secondary Research
12.3. Assumptions
Chapter 13. Appendix
13.1. About Us
13.2. Glossary of Terms
 Cross-segment Market Size and Analysis for
Mentioned Segments
Additional Company Profiles (Upto 5 With No Cost)
Additional Countries (Apart From Mentioned Countries)
Country/Region-specific Report
Go To Market Strategy
Region Specific Market DynamicsRegion Level Market Share Import Export AnalysisProduction AnalysisOthers
Cross-segment Market Size and Analysis for
Mentioned Segments
Additional Company Profiles (Upto 5 With No Cost)
Additional Countries (Apart From Mentioned Countries)
Country/Region-specific Report
Go To Market Strategy
Region Specific Market DynamicsRegion Level Market Share Import Export AnalysisProduction AnalysisOthers