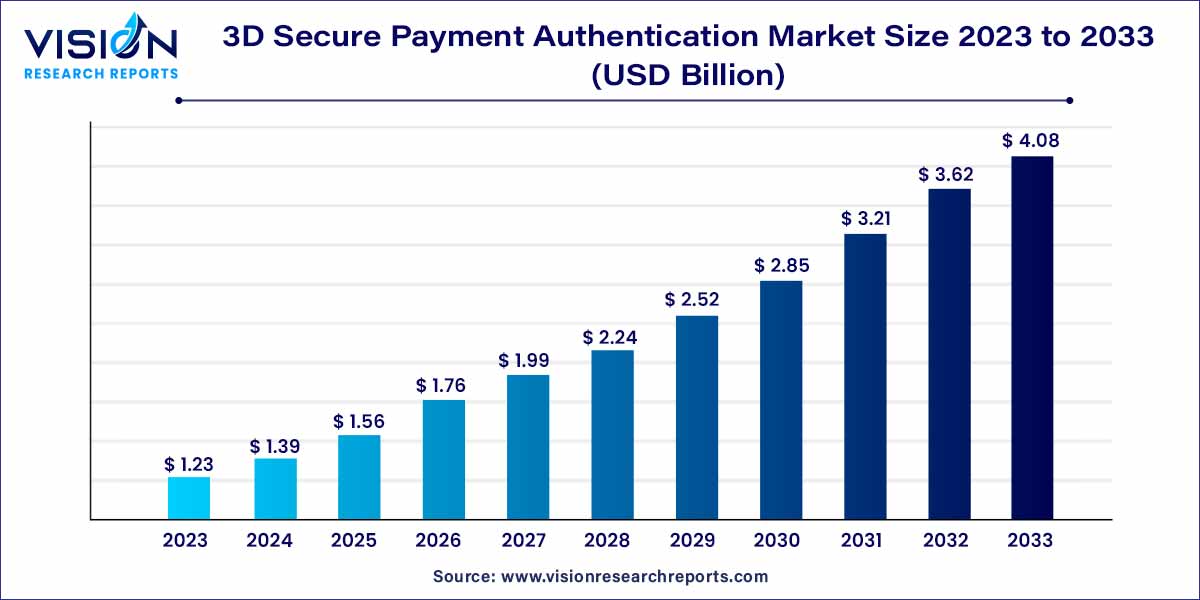
The global 3D secure payment authentication market size was surpassed at USD 1.23 billion in 2023 and is expected to hit around USD 4.08 billion by 2033, growing at a CAGR of 12.73% from 2024 to 2033. The 3D secure payment authentication market represents a pivotal sector in the ever-evolving landscape of digital finance. With the global surge in online transactions, ensuring the security of these payments has become paramount. 3D secure payment authentication stands out as a robust solution, offering an extra layer of protection through advanced authentication processes.

The growth of the 3D secure payment authentication market is propelled by several key factors. Firstly, the escalating trend of online shopping and digital transactions worldwide has significantly increased the demand for secure payment methods. As consumers continue to embrace e-commerce, businesses are adopting 3D secure protocols to instill trust and ensure the safety of online payments. Secondly, stringent regulatory requirements and industry standards mandating enhanced security measures in financial transactions have driven the widespread adoption of 3D secure payment authentication. These regulations create a compelling incentive for businesses to invest in advanced authentication solutions, thereby fueling market growth. Additionally, the continuous advancements in technology, such as biometric authentication and artificial intelligence, are revolutionizing the security landscape. Integration of these innovative technologies not only enhances the effectiveness of 3D secure systems but also augments user experience, contributing significantly to the market's expansion. Overall, the convergence of increased online activities, regulatory mandates, and technological innovations forms the cornerstone of the 3D Secure Payment Authentication market's remarkable growth trajectory.
| Report Coverage | Details |
| Growth Rate from 2024 to 2033 | CAGR of 12.73% |
| Market Revenue by 2033 | USD 4.08 billion |
| Revenue Share of North America in 2023 | 29% |
| Base Year | 2023 |
| Forecast Period | 2024 to 2033 |
| Market Analysis (Terms Used) | Value (US$ Million/Billion) or (Volume/Units)Companies Covered |
The merchant plug-in segment generated the maximum market share of 41% in 2023. The merchant plug-in serves as a bridge between the merchant's website and the Access Control Server, facilitating the authentication process. It acts as the intermediary responsible for gathering necessary transaction data and directing it to the Access Control Server. Merchants integrate the MPI into their e-commerce platforms, enabling the verification of cardholder identities before processing payments. This integration empowers merchants with the ability to customize authentication protocols, aligning them with specific business needs and customer preferences.
The access control server segment is anticipated to grow at the CAGR over the forecast period. The access control server stands as the central intelligence of the 3D Secure ecosystem. It serves as the hub where the authentication process unfolds. When a customer initiates a transaction, the ACS evaluates the risk level associated with the payment. Leveraging sophisticated algorithms, it assesses various factors, including transaction history, device information, and user behavior. Based on this analysis, the ACS triggers authentication requests to the card issuer, prompting the cardholder to verify their identity. This interaction ensures that only legitimate users gain access, safeguarding against unauthorized transactions and bolstering confidence in online payment systems.
The banks segment captured the maximum market share of 61% in 2023. Banks, as custodians of financial security, have embraced 3D Secure protocols to fortify their digital banking services. By integrating these advanced authentication methods, banks ensure that their customers' online transactions are shielded against unauthorized access and fraudulent activities. This proactive approach not only instills trust but also aligns with regulatory mandates, creating a secure environment for their clients to engage in online banking seamlessly.
The merchants & payment gateway segment is anticipated to witness significant growth over the forecast period. Merchants and payment gateways have swiftly adopted 3D Secure Payment Authentication to elevate the safety of their e-commerce platforms. For merchants, integrating 3D Secure technology translates into enhanced credibility. By providing a secure payment environment, merchants can attract a wider customer base, fostering loyalty and encouraging repeat transactions. The integration of 3D Secure protocols by payment gateways further augments this security net. Acting as intermediaries between merchants and financial institutions, payment gateways play a pivotal role in authenticating transactions. By employing 3D Secure methods, payment gateways ensure that the payment data transmitted between merchants and banks remains encrypted and immune to cyber threats.
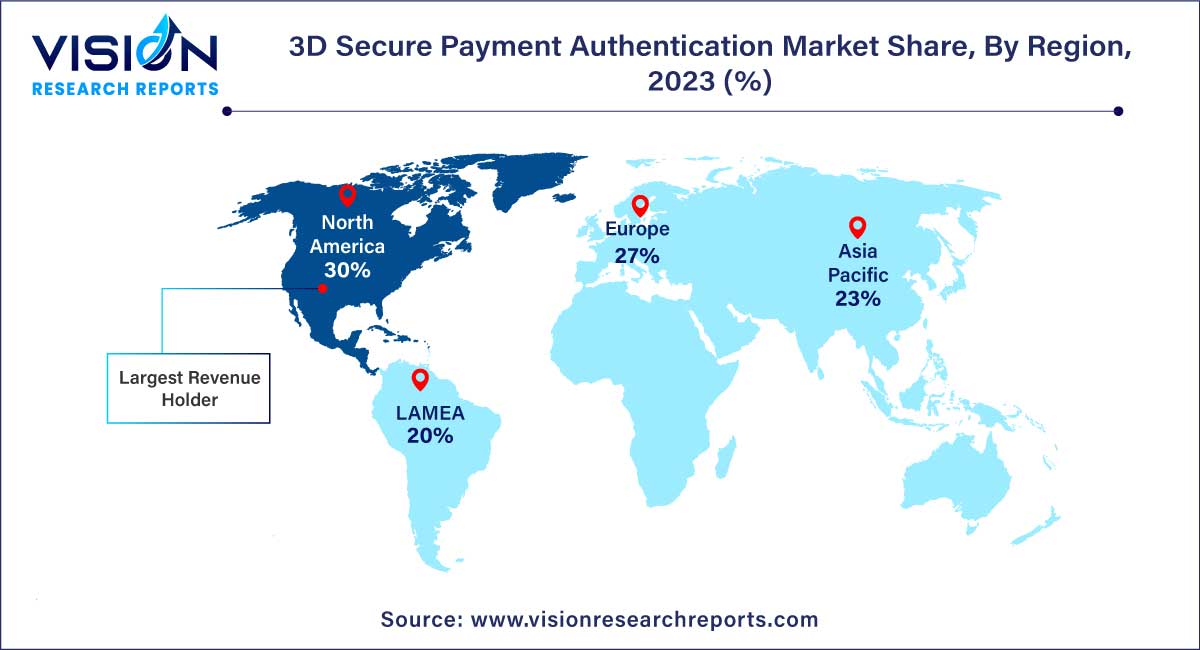
North America dominated the global market with the largest market share of 30% in 2023. North America, a frontrunner in digital innovation, has witnessed widespread acceptance of 3D Secure protocols. The region's robust financial infrastructure and stringent regulatory framework have encouraged banks, merchants, and payment gateways to invest in advanced authentication methods, ensuring secure online transactions. Additionally, the region's tech-savvy consumer base demands seamless yet secure payment experiences, further propelling the adoption of 3D Secure technology.

Asia Pacific is expected to witness the fastest growth over the forecast period. Asia-Pacific, home to some of the world's fastest-growing digital economies, has experienced a surge in online transactions. In this region, the adoption of 3D Secure Payment Authentication is driven by a burgeoning middle class, rapid urbanization, and the proliferation of smartphones. Banks and merchants in Asia-Pacific are investing in cutting-edge authentication methods to cater to the diverse payment preferences of their tech-savvy consumers. Additionally, the rise of digital commerce platforms and mobile payment apps has further accelerated the implementation of 3D Secure protocols, ensuring the security of online transactions across a vast and dynamic market.
By Component
By Application
By Region
Chapter 1. Introduction
1.1. Research Objective
1.2. Scope of the Study
1.3. Definition
Chapter 2. Research Methodology
2.1. Research Approach
2.2. Data Sources
2.3. Assumptions & Limitations
Chapter 3. Executive Summary
3.1. Market Snapshot
Chapter 4. Market Variables and Scope
4.1. Introduction
4.2. Market Classification and Scope
4.3. Industry Value Chain Analysis
4.3.1. Raw Material Procurement Analysis
4.3.2. Sales and Distribution Channel Analysis
4.3.3. Downstream Buyer Analysis
Chapter 5. COVID 19 Impact on 3D Secure Payment Authentication Market
5.1. COVID-19 Landscape: 3D Secure Payment Authentication Industry Impact
5.2. COVID 19 - Impact Assessment for the Industry
5.3. COVID 19 Impact: Global Major Government Policy
5.4. Market Trends and Opportunities in the COVID-19 Landscape
Chapter 6. Market Dynamics Analysis and Trends
6.1. Market Dynamics
6.1.1. Market Drivers
6.1.2. Market Restraints
6.1.3. Market Opportunities
6.2. Porter’s Five Forces Analysis
6.2.1. Bargaining power of suppliers
6.2.2. Bargaining power of buyers
6.2.3. Threat of substitute
6.2.4. Threat of new entrants
6.2.5. Degree of competition
Chapter 7. Competitive Landscape
7.1.1. Company Market Share/Positioning Analysis
7.1.2. Key Strategies Adopted by Players
7.1.3. Vendor Landscape
7.1.3.1. List of Suppliers
7.1.3.2. List of Buyers
Chapter 8. Global 3D Secure Payment Authentication Market, By Component
8.1. 3D Secure Payment Authentication Market, by Component, 2024-2033
8.1.1. Access Control Server
8.1.1.1. Market Revenue and Forecast (2021-2033)
8.1.2. Merchant Plug-in
8.1.2.1. Market Revenue and Forecast (2021-2033)
8.1.3. Others
8.1.3.1. Market Revenue and Forecast (2021-2033)
Chapter 9. Global 3D Secure Payment Authentication Market, By Application
9.1. 3D Secure Payment Authentication Market, by Application, 2024-2033
9.1.1. Banks
9.1.1.1. Market Revenue and Forecast (2021-2033)
9.1.2. Merchants & Payment Gateway
9.1.2.1. Market Revenue and Forecast (2021-2033)
Chapter 10. Global 3D Secure Payment Authentication Market, Regional Estimates and Trend Forecast
10.1. North America
10.1.1. Market Revenue and Forecast, by Component (2021-2033)
10.1.2. Market Revenue and Forecast, by Application (2021-2033)
10.1.3. U.S.
10.1.3.1. Market Revenue and Forecast, by Component (2021-2033)
10.1.3.2. Market Revenue and Forecast, by Application (2021-2033)
10.1.4. Rest of North America
10.1.4.1. Market Revenue and Forecast, by Component (2021-2033)
10.1.4.2. Market Revenue and Forecast, by Application (2021-2033)
10.2. Europe
10.2.1. Market Revenue and Forecast, by Component (2021-2033)
10.2.2. Market Revenue and Forecast, by Application (2021-2033)
10.2.3. UK
10.2.3.1. Market Revenue and Forecast, by Component (2021-2033)
10.2.3.2. Market Revenue and Forecast, by Application (2021-2033)
10.2.4. Germany
10.2.4.1. Market Revenue and Forecast, by Component (2021-2033)
10.2.4.2. Market Revenue and Forecast, by Application (2021-2033)
10.2.5. France
10.2.5.1. Market Revenue and Forecast, by Component (2021-2033)
10.2.5.2. Market Revenue and Forecast, by Application (2021-2033)
10.2.6. Rest of Europe
10.2.6.1. Market Revenue and Forecast, by Component (2021-2033)
10.2.6.2. Market Revenue and Forecast, by Application (2021-2033)
10.3. APAC
10.3.1. Market Revenue and Forecast, by Component (2021-2033)
10.3.2. Market Revenue and Forecast, by Application (2021-2033)
10.3.3. India
10.3.3.1. Market Revenue and Forecast, by Component (2021-2033)
10.3.3.2. Market Revenue and Forecast, by Application (2021-2033)
10.3.4. China
10.3.4.1. Market Revenue and Forecast, by Component (2021-2033)
10.3.4.2. Market Revenue and Forecast, by Application (2021-2033)
10.3.5. Japan
10.3.5.1. Market Revenue and Forecast, by Component (2021-2033)
10.3.5.2. Market Revenue and Forecast, by Application (2021-2033)
10.3.6. Rest of APAC
10.3.6.1. Market Revenue and Forecast, by Component (2021-2033)
10.3.6.2. Market Revenue and Forecast, by Application (2021-2033)
10.4. MEA
10.4.1. Market Revenue and Forecast, by Component (2021-2033)
10.4.2. Market Revenue and Forecast, by Application (2021-2033)
10.4.3. GCC
10.4.3.1. Market Revenue and Forecast, by Component (2021-2033)
10.4.3.2. Market Revenue and Forecast, by Application (2021-2033)
10.4.4. North Africa
10.4.4.1. Market Revenue and Forecast, by Component (2021-2033)
10.4.4.2. Market Revenue and Forecast, by Application (2021-2033)
10.4.5. South Africa
10.4.5.1. Market Revenue and Forecast, by Component (2021-2033)
10.4.5.2. Market Revenue and Forecast, by Application (2021-2033)
10.4.6. Rest of MEA
10.4.6.1. Market Revenue and Forecast, by Component (2021-2033)
10.4.6.2. Market Revenue and Forecast, by Application (2021-2033)
10.5. Latin America
10.5.1. Market Revenue and Forecast, by Component (2021-2033)
10.5.2. Market Revenue and Forecast, by Application (2021-2033)
10.5.3. Brazil
10.5.3.1. Market Revenue and Forecast, by Component (2021-2033)
10.5.3.2. Market Revenue and Forecast, by Application (2021-2033)
10.5.4. Rest of LATAM
10.5.4.1. Market Revenue and Forecast, by Component (2021-2033)
10.5.4.2. Market Revenue and Forecast, by Application (2021-2033)
Chapter 11. Company Profiles
11.1. GPayments Pty Ltd.
11.1.1. Company Overview
11.1.2. Product Offerings
11.1.3. Financial Performance
11.1.4. Recent Initiatives
11.2. Broadcom Inc.
11.2.1. Company Overview
11.2.2. Product Offerings
11.2.3. Financial Performance
11.2.4. Recent Initiatives
11.3. Mastercard Inc.
11.3.1. Company Overview
11.3.2. Product Offerings
11.3.3. Financial Performance
11.3.4. Recent Initiatives
11.4. RSA Security LLC
11.4.1. Company Overview
11.4.2. Product Offerings
11.4.3. Financial Performance
11.4.4. LTE Scientific
11.5. Modirum
11.5.1. Company Overview
11.5.2. Product Offerings
11.5.3. Financial Performance
11.5.4. Recent Initiatives
11.6. Visa Inc.
11.6.1. Company Overview
11.6.2. Product Offerings
11.6.3. Financial Performance
11.6.4. Recent Initiatives
11.7. Bluefin Payment Systems LLC
11.7.1. Company Overview
11.7.2. Product Offerings
11.7.3. Financial Performance
11.7.4. Recent Initiatives
11.8. DECTA Ltd.
11.8.1. Company Overview
11.8.2. Product Offerings
11.8.3. Financial Performance
11.8.4. Recent Initiatives
11.9. American Express Company
11.9.1. Company Overview
11.9.2. Product Offerings
11.9.3. Financial Performance
11.9.4. Recent Initiatives
11.10. JCB Co., Ltd
11.10.1. Company Overview
11.10.2. Product Offerings
11.10.3. Financial Performance
11.10.4. Recent Initiatives
Chapter 12. Research Methodology
12.1. Primary Research
12.2. Secondary Research
12.3. Assumptions
Chapter 13. Appendix
13.1. About Us
13.2. Glossary of Terms
 Cross-segment Market Size and Analysis for
Mentioned Segments
 Additional Company Profiles (Upto 5 With No Cost)
 Additional Countries (Apart From Mentioned Countries)
 Country/Region-specific Report
 Go To Market Strategy
 Region Specific Market Dynamics
 Region Level Market Share
 Import Export Analysis
 Production Analysis
 Others