5G Radio Access Network Market Size, Growth, Trends | Report 2023-2032
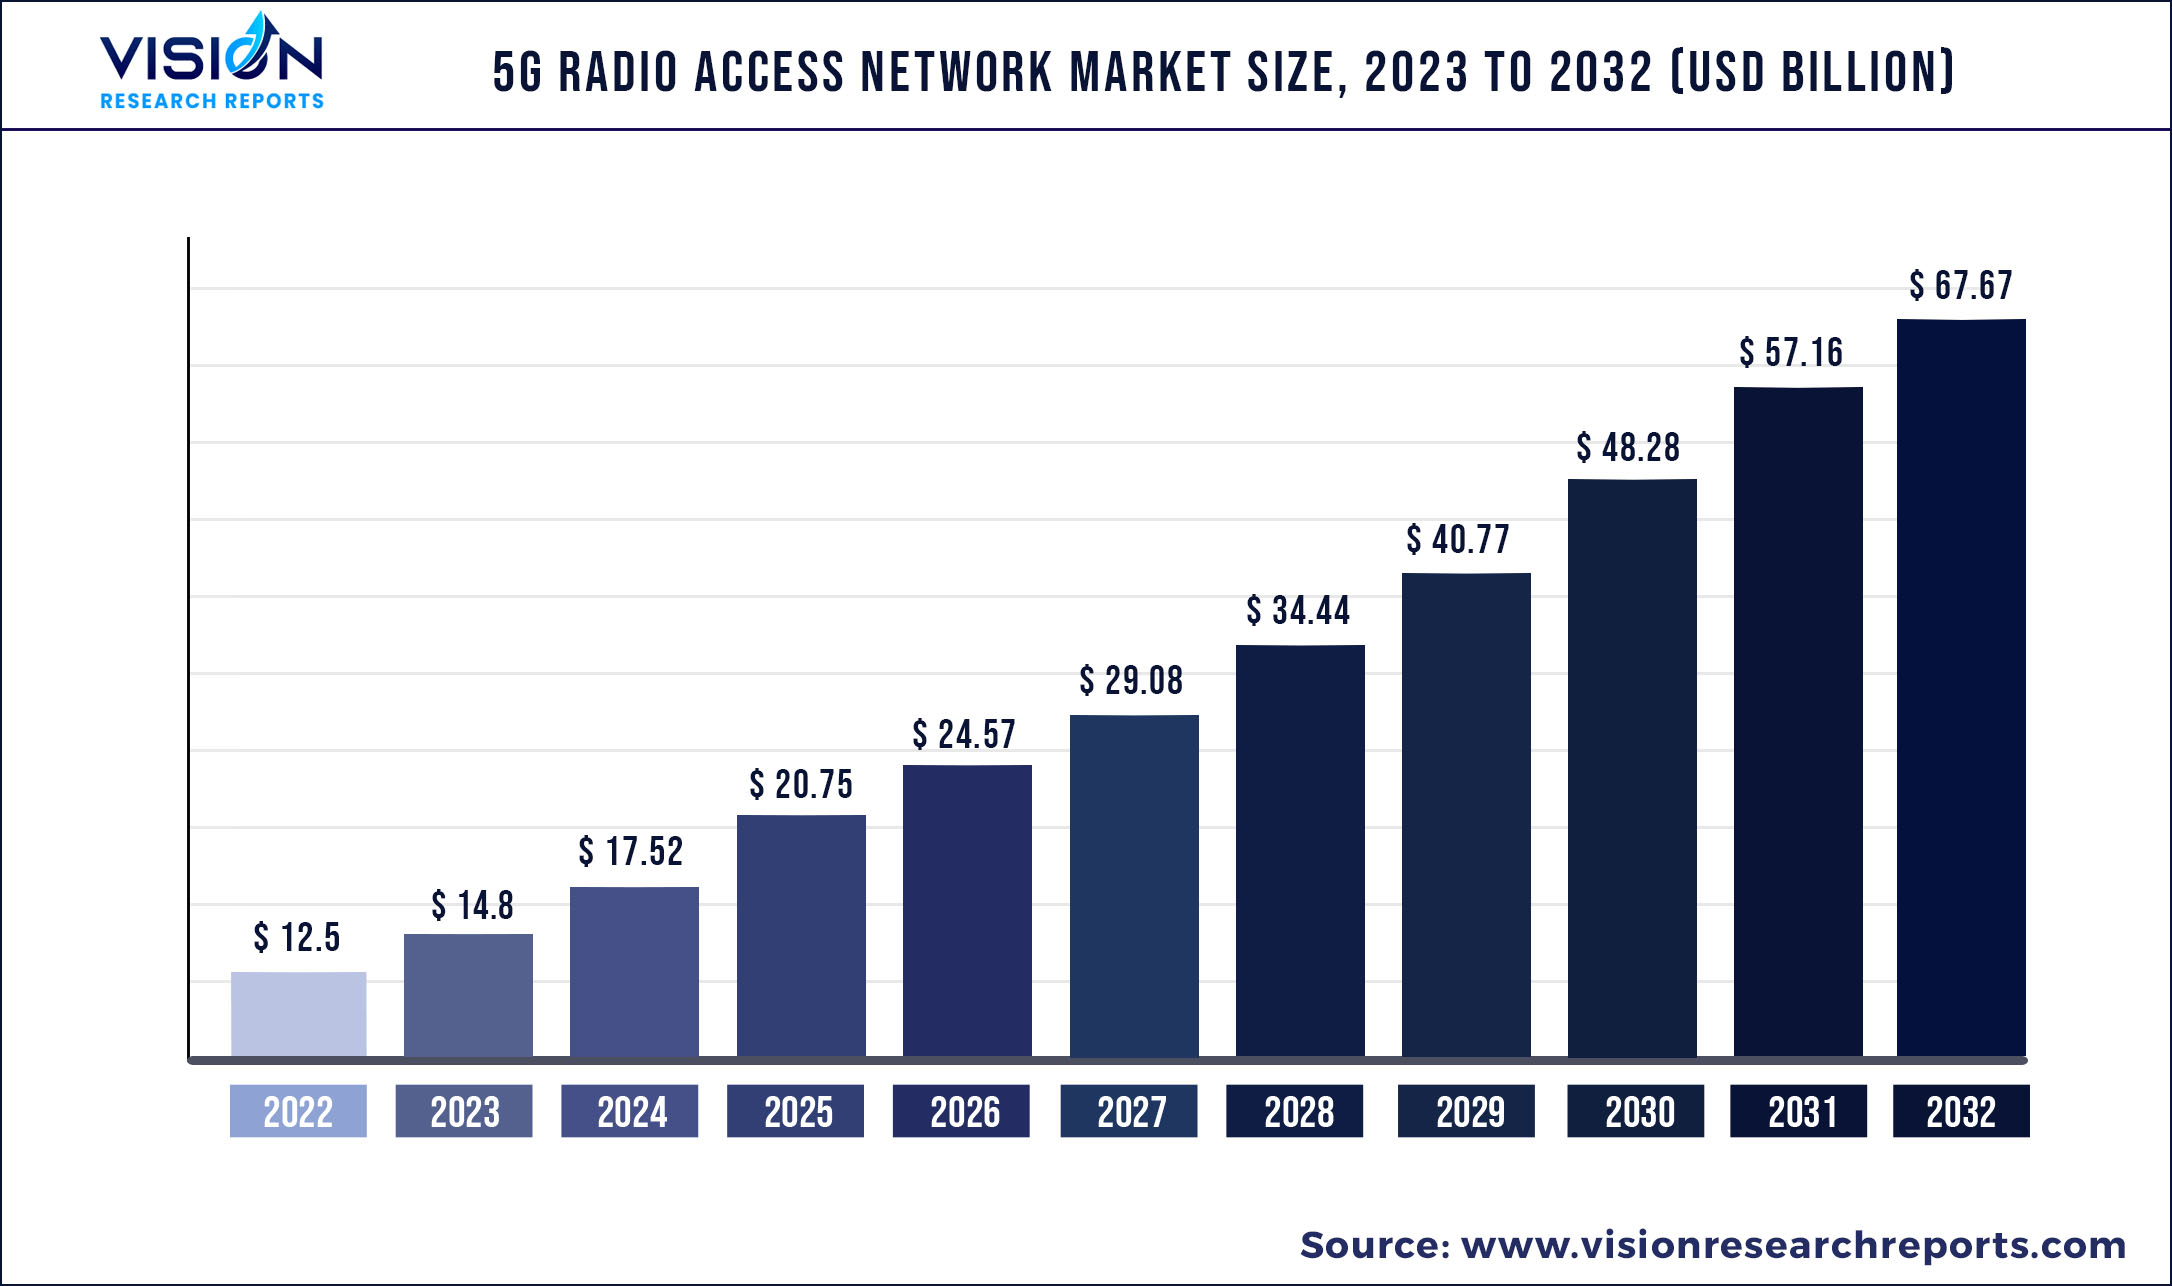
The global 5G radio access network market size was estimated at around USD 12.5 billion in 2022 and it is projected to hit around USD 67.67 billion by 2032, growing at a CAGR of 18.4% from 2023 to 2032.
Key Pointers
Report Scope of the 5G Radio Access Network Market
| Report Coverage | Details |
| Market Size in 2022 | USD 12.5 billion |
| Revenue Forecast by 2032 | USD 67.67 billion |
| Growth rate from 2023 to 2032 | CAGR of 18.4% |
| Base Year | 2022 |
| Forecast Period | 2023 to 2032 |
| Regions Covered | North America, Europe, Asia Pacific, Latin America, Middle East & Africa |
| Companies Covered | Telefonaktiebolaget LM Ericsson; Qualcomm Technologies, Inc.; Nokia; Intel Corporation; Samsung; Verizon; Cisco Systems, Inc.; Huawei Technologies Co., Ltd.; VMware, Inc.; Rakuten Symphony Singapore Pte. Ltd |
The increasing demand for low latency bandwidth connection and increased focus on research and development activities by key organizations are some of the factors fueling the market growth. Moreover, the robust deployment of a 5G radio access network (RAN) with several small cells and macrocell base stations worldwide is propelling the growth of the market during the forecast period.
The trend of deploying centralized RAN and virtual RAN (VRAN) is rapidly increasing among mobile network operators (MNOs) and network service providers to reduce overall infrastructure costs and network complexities. Furthermore, the RAN enables enterprises and mobile network operators utilizing private 4G or private 5G to offer network slicing solutions assigning capacities to individual enterprises to split network usage within a public mobile network. The industry is expanding at a tremendous growth rate owing to technological innovations coupled with users’ inclination towards 5G RAN solutions.
Radio access networks comprise wireless telecommunications systems, including antennas and base stations, to provide high performing 5G network solutions. It utilizes 5G radio frequency division duplex (FDD) frequencies to connect individual devices through radio connections providing wireless connectivity.
RAN encompasses different types, viz. evolved universal terrestrial RAN (E-UTRAN), Universal Radio Access Network (UTRAN), Virtualized Radio Access Network (VRAN), and Open Radio Access Network (ORAN), among others. The RAN base stations within a public mobile network are connected to a public mobile core network through microwave or fiber cables to aggregate signals. The latest RANs offer controllers utilizing software-defined networks (SDN), allowing them to control cellular device capacity and coverage.
This high market size is attributable to the growing deployment of private 5G radio access networks and core equipment across several use cases. These use cases include smart cities, remote surgeries, enterprises, wireless cameras, industrial robotics, and autonomous vehicles. Rapidly evolving RAN technologies have enabled several key telecom operators and end-use customers to deploy the virtualized network to diminish overall operating expenses.
Also, several market players such as Qualcomm Technologies, Inc., Nokia, Verizon, and Cisco Systems, Inc., among others, are significantly focused on providing RAN solutions for private 5G networks, which help clients to transform their existing legacy network infrastructure into the next generation 5G network.
For instance, in October 2022, Qualcomm Technologies, Inc. announced a collaboration with Vodafone Group to develop and integrate next-generation 5G radio units and distributed units with massive multiple-input multiple-output capabilities. The companies are also developing 5G ORAN infrastructure solutions powered by Qualcomm QRU100 5G radio access network platform and Qualcomm X100 5G RAN accelerator card.
5G Radio Access Network Market Segmentations:
By Component
By Architecture Type
By Deployment
By End-users
Chapter 1. Introduction
1.1. Research Objective
1.2. Scope of the Study
1.3. Definition
Chapter 2. Research Methodology
2.1. Research Approach
2.2. Data Sources
2.3. Assumptions & Limitations
Chapter 3. Executive Summary
3.1. Market Snapshot
Chapter 4. Market Variables and Scope
4.1. Introduction
4.2. Market Classification and Scope
4.3. Industry Value Chain Analysis
4.3.1. Raw Material Procurement Analysis
4.3.2. Sales and Distribution Channel Analysis
4.3.3. Downstream Buyer Analysis
Chapter 5. COVID 19 Impact on 5G Radio Access Network Market
5.1. COVID-19 Landscape: 5G Radio Access Network Industry Impact
5.2. COVID 19 - Impact Assessment for the Industry
5.3. COVID 19 Impact: Global Major Government Policy
5.4. Market Trends and Opportunities in the COVID-19 Landscape
Chapter 6. Market Dynamics Analysis and Trends
6.1. Market Dynamics
6.1.1. Market Drivers
6.1.2. Market Restraints
6.1.3. Market Opportunities
6.2. Porter’s Five Forces Analysis
6.2.1. Bargaining power of suppliers
6.2.2. Bargaining power of buyers
6.2.3. Threat of substitute
6.2.4. Threat of new entrants
6.2.5. Degree of competition
Chapter 7. Competitive Landscape
7.1.1. Company Market Share/Positioning Analysis
7.1.2. Key Strategies Adopted by Players
7.1.3. Vendor Landscape
7.1.3.1. List of Suppliers
7.1.3.2. List of Buyers
Chapter 8. Global 5G Radio Access Network Market, By Component
8.1. 5G Radio Access Network Market, by Component, 2023-2032
8.1.1. Hardware
8.1.1.1. Market Revenue and Forecast (2020-2032)
8.1.2. Software
8.1.2.1. Market Revenue and Forecast (2020-2032)
8.1.3. Services
8.1.3.1. Market Revenue and Forecast (2020-2032)
Chapter 9. Global 5G Radio Access Network Market, By Architecture Type
9.1. 5G Radio Access Network Market, by Architecture Type, 2023-2032
9.1.1. CRAN
9.1.1.1. Market Revenue and Forecast (2020-2032)
9.1.2. ORAN
9.1.2.1. Market Revenue and Forecast (2020-2032)
9.1.3. VRAN
9.1.3.1. Market Revenue and Forecast (2020-2032)
Chapter 10. Global 5G Radio Access Network Market, By Deployment
10.1. 5G Radio Access Network Market, by Deployment, 2023-2032
10.1.1. Indoor
10.1.1.1. Market Revenue and Forecast (2020-2032)
10.1.2. Outdoor
10.1.2.1. Market Revenue and Forecast (2020-2032)
Chapter 11. Global 5G Radio Access Network Market, By End-users
11.1. 5G Radio Access Network Market, by End-users, 2023-2032
11.1.1. Telecom Operators
11.1.1.1. Market Revenue and Forecast (2020-2032)
11.1.2. Enterprises
11.1.2.1. Market Revenue and Forecast (2020-2032)
Chapter 12. Global 5G Radio Access Network Market, Regional Estimates and Trend Forecast
12.1. North America
12.1.1. Market Revenue and Forecast, by Component (2020-2032)
12.1.2. Market Revenue and Forecast, by Architecture Type (2020-2032)
12.1.3. Market Revenue and Forecast, by Deployment (2020-2032)
12.1.4. Market Revenue and Forecast, by End-users (2020-2032)
12.1.5. U.S.
12.1.5.1. Market Revenue and Forecast, by Component (2020-2032)
12.1.5.2. Market Revenue and Forecast, by Architecture Type (2020-2032)
12.1.5.3. Market Revenue and Forecast, by Deployment (2020-2032)
12.1.5.4. Market Revenue and Forecast, by End-users (2020-2032)
12.1.6. Rest of North America
12.1.6.1. Market Revenue and Forecast, by Component (2020-2032)
12.1.6.2. Market Revenue and Forecast, by Architecture Type (2020-2032)
12.1.6.3. Market Revenue and Forecast, by Deployment (2020-2032)
12.1.6.4. Market Revenue and Forecast, by End-users (2020-2032)
12.2. Europe
12.2.1. Market Revenue and Forecast, by Component (2020-2032)
12.2.2. Market Revenue and Forecast, by Architecture Type (2020-2032)
12.2.3. Market Revenue and Forecast, by Deployment (2020-2032)
12.2.4. Market Revenue and Forecast, by End-users (2020-2032)
12.2.5. UK
12.2.5.1. Market Revenue and Forecast, by Component (2020-2032)
12.2.5.2. Market Revenue and Forecast, by Architecture Type (2020-2032)
12.2.5.3. Market Revenue and Forecast, by Deployment (2020-2032)
12.2.5.4. Market Revenue and Forecast, by End-users (2020-2032)
12.2.6. Germany
12.2.6.1. Market Revenue and Forecast, by Component (2020-2032)
12.2.6.2. Market Revenue and Forecast, by Architecture Type (2020-2032)
12.2.6.3. Market Revenue and Forecast, by Deployment (2020-2032)
12.2.6.4. Market Revenue and Forecast, by End-users (2020-2032)
12.2.7. France
12.2.7.1. Market Revenue and Forecast, by Component (2020-2032)
12.2.7.2. Market Revenue and Forecast, by Architecture Type (2020-2032)
12.2.7.3. Market Revenue and Forecast, by Deployment (2020-2032)
12.2.7.4. Market Revenue and Forecast, by End-users (2020-2032)
12.2.8. Rest of Europe
12.2.8.1. Market Revenue and Forecast, by Component (2020-2032)
12.2.8.2. Market Revenue and Forecast, by Architecture Type (2020-2032)
12.2.8.3. Market Revenue and Forecast, by Deployment (2020-2032)
12.2.8.4. Market Revenue and Forecast, by End-users (2020-2032)
12.3. APAC
12.3.1. Market Revenue and Forecast, by Component (2020-2032)
12.3.2. Market Revenue and Forecast, by Architecture Type (2020-2032)
12.3.3. Market Revenue and Forecast, by Deployment (2020-2032)
12.3.4. Market Revenue and Forecast, by End-users (2020-2032)
12.3.5. India
12.3.5.1. Market Revenue and Forecast, by Component (2020-2032)
12.3.5.2. Market Revenue and Forecast, by Architecture Type (2020-2032)
12.3.5.3. Market Revenue and Forecast, by Deployment (2020-2032)
12.3.5.4. Market Revenue and Forecast, by End-users (2020-2032)
12.3.6. China
12.3.6.1. Market Revenue and Forecast, by Component (2020-2032)
12.3.6.2. Market Revenue and Forecast, by Architecture Type (2020-2032)
12.3.6.3. Market Revenue and Forecast, by Deployment (2020-2032)
12.3.6.4. Market Revenue and Forecast, by End-users (2020-2032)
12.3.7. Japan
12.3.7.1. Market Revenue and Forecast, by Component (2020-2032)
12.3.7.2. Market Revenue and Forecast, by Architecture Type (2020-2032)
12.3.7.3. Market Revenue and Forecast, by Deployment (2020-2032)
12.3.7.4. Market Revenue and Forecast, by End-users (2020-2032)
12.3.8. Rest of APAC
12.3.8.1. Market Revenue and Forecast, by Component (2020-2032)
12.3.8.2. Market Revenue and Forecast, by Architecture Type (2020-2032)
12.3.8.3. Market Revenue and Forecast, by Deployment (2020-2032)
12.3.8.4. Market Revenue and Forecast, by End-users (2020-2032)
12.4. MEA
12.4.1. Market Revenue and Forecast, by Component (2020-2032)
12.4.2. Market Revenue and Forecast, by Architecture Type (2020-2032)
12.4.3. Market Revenue and Forecast, by Deployment (2020-2032)
12.4.4. Market Revenue and Forecast, by End-users (2020-2032)
12.4.5. GCC
12.4.5.1. Market Revenue and Forecast, by Component (2020-2032)
12.4.5.2. Market Revenue and Forecast, by Architecture Type (2020-2032)
12.4.5.3. Market Revenue and Forecast, by Deployment (2020-2032)
12.4.5.4. Market Revenue and Forecast, by End-users (2020-2032)
12.4.6. North Africa
12.4.6.1. Market Revenue and Forecast, by Component (2020-2032)
12.4.6.2. Market Revenue and Forecast, by Architecture Type (2020-2032)
12.4.6.3. Market Revenue and Forecast, by Deployment (2020-2032)
12.4.6.4. Market Revenue and Forecast, by End-users (2020-2032)
12.4.7. South Africa
12.4.7.1. Market Revenue and Forecast, by Component (2020-2032)
12.4.7.2. Market Revenue and Forecast, by Architecture Type (2020-2032)
12.4.7.3. Market Revenue and Forecast, by Deployment (2020-2032)
12.4.7.4. Market Revenue and Forecast, by End-users (2020-2032)
12.4.8. Rest of MEA
12.4.8.1. Market Revenue and Forecast, by Component (2020-2032)
12.4.8.2. Market Revenue and Forecast, by Architecture Type (2020-2032)
12.4.8.3. Market Revenue and Forecast, by Deployment (2020-2032)
12.4.8.4. Market Revenue and Forecast, by End-users (2020-2032)
12.5. Latin America
12.5.1. Market Revenue and Forecast, by Component (2020-2032)
12.5.2. Market Revenue and Forecast, by Architecture Type (2020-2032)
12.5.3. Market Revenue and Forecast, by Deployment (2020-2032)
12.5.4. Market Revenue and Forecast, by End-users (2020-2032)
12.5.5. Brazil
12.5.5.1. Market Revenue and Forecast, by Component (2020-2032)
12.5.5.2. Market Revenue and Forecast, by Architecture Type (2020-2032)
12.5.5.3. Market Revenue and Forecast, by Deployment (2020-2032)
12.5.5.4. Market Revenue and Forecast, by End-users (2020-2032)
12.5.6. Rest of LATAM
12.5.6.1. Market Revenue and Forecast, by Component (2020-2032)
12.5.6.2. Market Revenue and Forecast, by Architecture Type (2020-2032)
12.5.6.3. Market Revenue and Forecast, by Deployment (2020-2032)
12.5.6.4. Market Revenue and Forecast, by End-users (2020-2032)
Chapter 13. Company Profiles
13.1. Telefonaktiebolaget LM Ericsson
13.1.1. Company Overview
13.1.2. Product Offerings
13.1.3. Financial Performance
13.1.4. Recent Initiatives
13.2. Qualcomm Technologies, Inc.
13.2.1. Company Overview
13.2.2. Product Offerings
13.2.3. Financial Performance
13.2.4. Recent Initiatives
13.3. Nokia
13.3.1. Company Overview
13.3.2. Product Offerings
13.3.3. Financial Performance
13.3.4. Recent Initiatives
13.4. Intel Corporation
13.4.1. Company Overview
13.4.2. Product Offerings
13.4.3. Financial Performance
13.4.4. Recent Initiatives
13.5. Samsung
13.5.1. Company Overview
13.5.2. Product Offerings
13.5.3. Financial Performance
13.5.4. Recent Initiatives
13.6. Verizon
13.6.1. Company Overview
13.6.2. Product Offerings
13.6.3. Financial Performance
13.6.4. Recent Initiatives
13.7. Cisco Systems, Inc.
13.7.1. Company Overview
13.7.2. Product Offerings
13.7.3. Financial Performance
13.7.4. Recent Initiatives
13.8. Huawei Technologies Co., Ltd.
13.8.1. Company Overview
13.8.2. Product Offerings
13.8.3. Financial Performance
13.8.4. Recent Initiatives
13.9. VMware, Inc.
13.9.1. Company Overview
13.9.2. Product Offerings
13.9.3. Financial Performance
13.9.4. Recent Initiatives
13.10. Rakuten Symphony Singapore Pte. Ltd
13.10.1. Company Overview
13.10.2. Product Offerings
13.10.3. Financial Performance
13.10.4. Recent Initiatives
Chapter 14. Research Methodology
14.1. Primary Research
14.2. Secondary Research
14.3. Assumptions
Chapter 15. Appendix
15.1. About Us
15.2. Glossary of Terms
 Cross-segment Market Size and Analysis for
Mentioned Segments
Additional Company Profiles (Upto 5 With No Cost)
Additional Countries (Apart From Mentioned Countries)
Country/Region-specific Report
Go To Market Strategy
Region Specific Market DynamicsRegion Level Market Share Import Export AnalysisProduction AnalysisOthers
Cross-segment Market Size and Analysis for
Mentioned Segments
Additional Company Profiles (Upto 5 With No Cost)
Additional Countries (Apart From Mentioned Countries)
Country/Region-specific Report
Go To Market Strategy
Region Specific Market DynamicsRegion Level Market Share Import Export AnalysisProduction AnalysisOthers