AI In Media & Entertainment Market Size, Share | Report 2023-2032
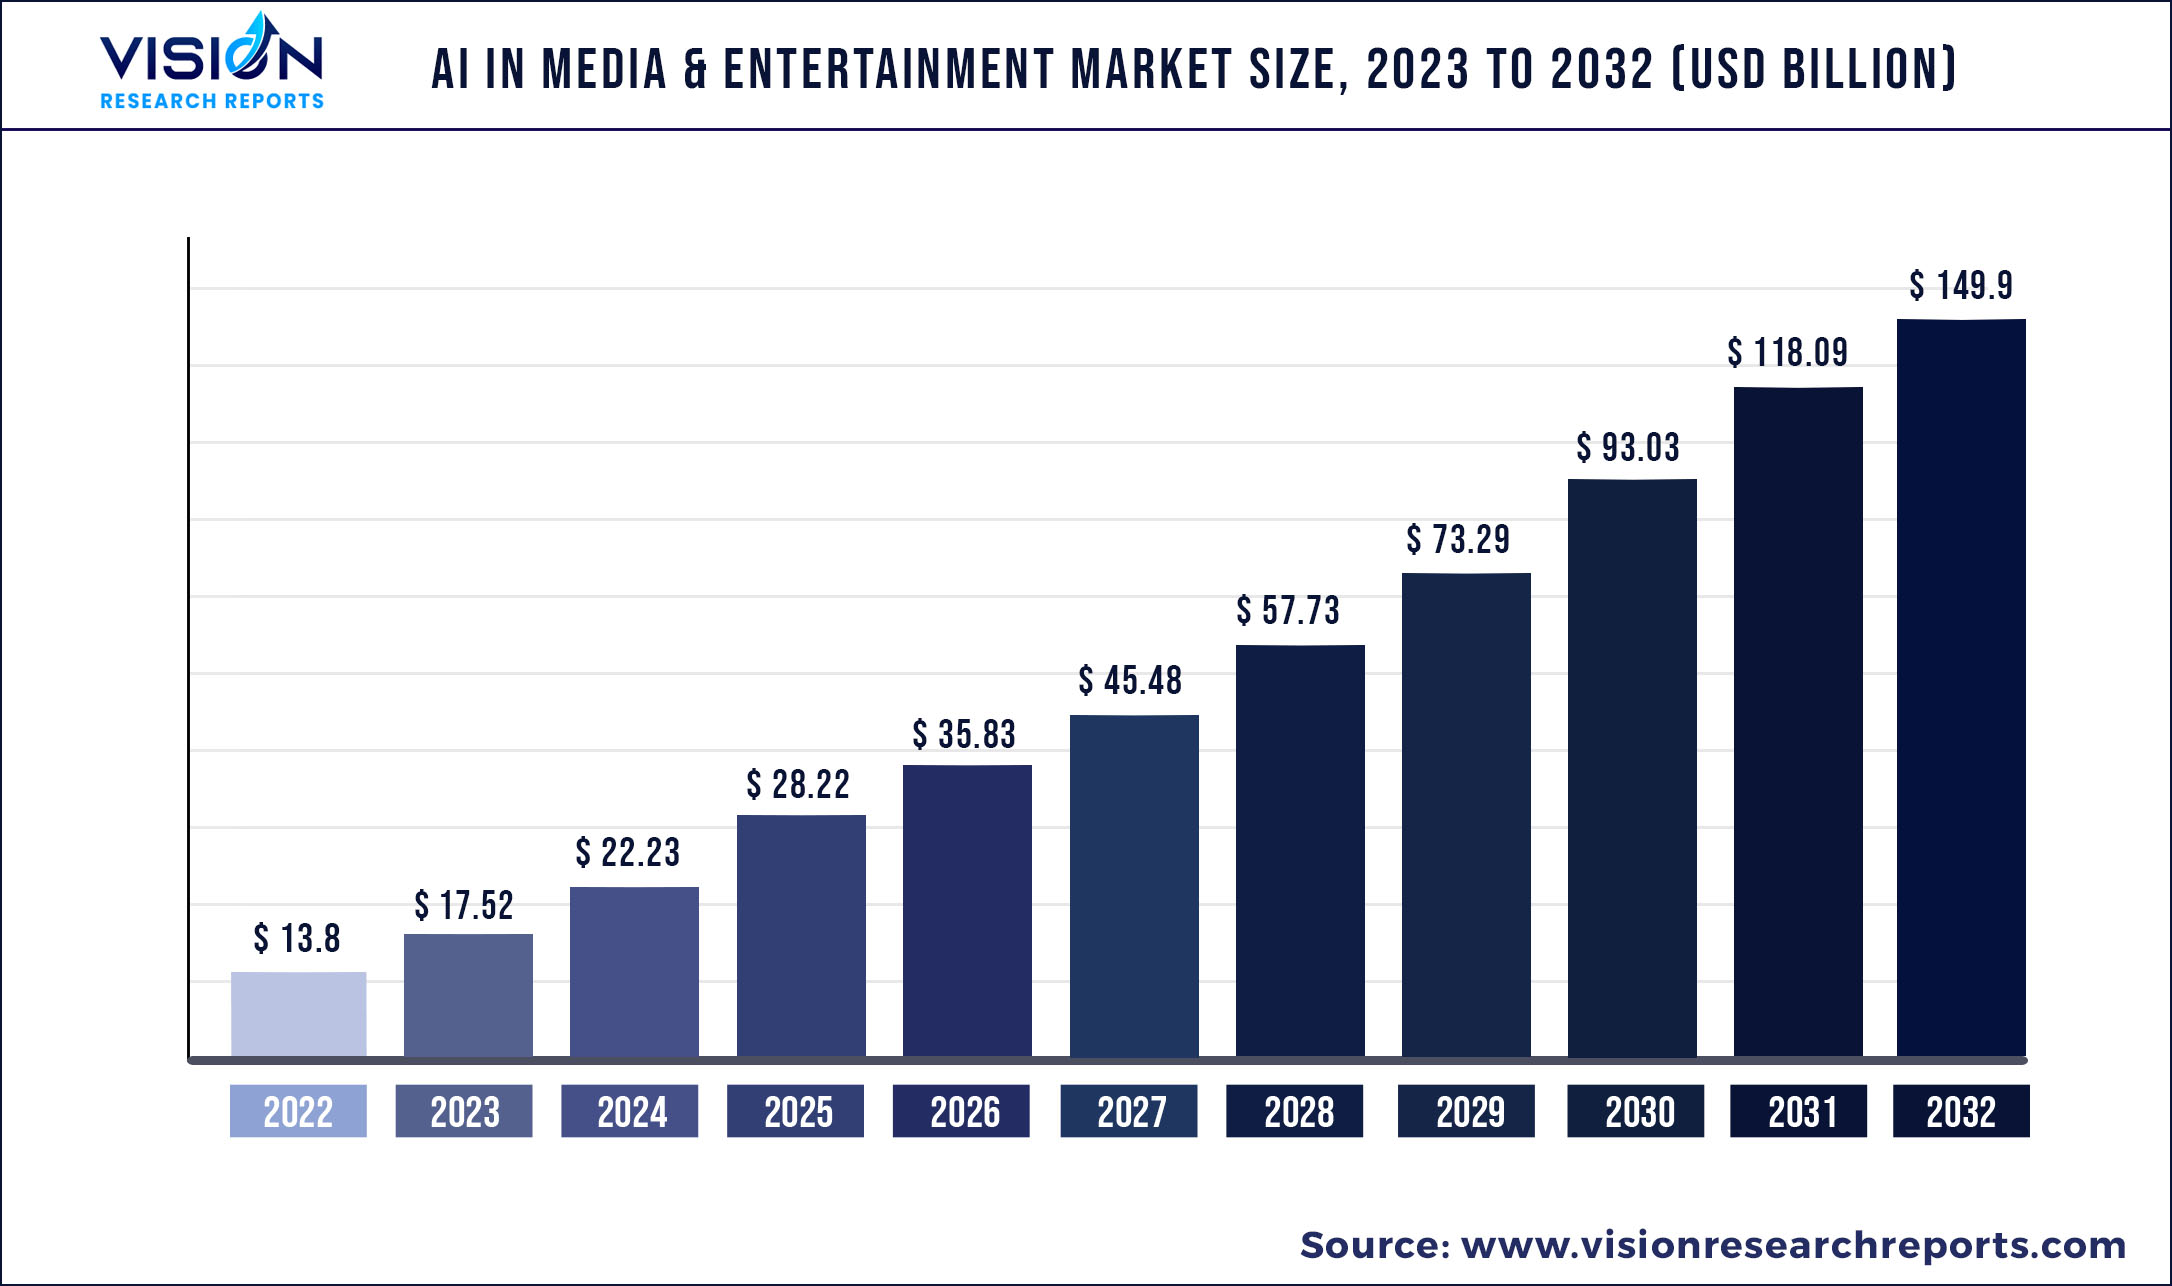
The global AI in media & entertainment market was valued at USD 13.8 billion in 2022 and it is predicted to surpass around USD 149.9 billion by 2032 with a CAGR of 26.94% from 2023 to 2032.
Key Pointers
Report Scope of the AI In Media & Entertainment Market
| Report Coverage | Details |
| Market Size in 2022 | USD 13.8 billion |
| Revenue Forecast by 2032 | USD 149.9 billion |
| Growth rate from 2023 to 2032 | CAGR of 26.94% |
| Base Year | 2022 |
| Forecast Period | 2023 to 2032 |
| Market Analysis (Terms Used) | Value (US$ Million/Billion) or (Volume/Units) |
| Regions Covered | North America, Europe, Asia Pacific, Latin America, Middle East & Africa |
| Companies Covered | Amazon Web Services, Inc.; Gearhouse South Africa PTY Ltd.; Gravity Media; GrayMeta; International Business Machines Corp.; LMG, LLC; Matchroom Sport Ltd.; Production Resource Group, L.L.C.; Synthesia Ltd; TAIT; Valossa Labs Ltd.; Veritone, Inc.; Pixellot; PlaySight Interactive Ltd.; AISportsWatch GmbH; Spiideo; Sportway AB; EVS Broadcast Equipment S.A.; Hudl; Move.ai; AutomaticTV |
Artificial intelligence (AI) uses in gameplay, fake story recognition, plagiarized detection, production planning and management, personalization, sales and marketing, talent finding, and other fields is propelling the rise of the global AI in the media and entertainment sector. The increasing popularity of virtual creation in the media and entertainment business, and its ability to create high-definition graphics and real-time virtual worlds, are the key factor driving the market.
Also, favorable government initiatives are expected to impact industry growth positively. AI systems are used to recognize objects and behaviors in sporting events. It can also use drone footage to provide broadcasts that include engaging material and in-depth sports analysis. For example, in a football match, AI-generated live footage may capture the adrenaline-fueled action and the players' and fans' responses after each score. Visuals used in the live broadcast of a match should contribute to the construction of an engaging story. Companies use AI to create more tailored services for users by endorsing personalized content following their tastes when users browse a video site and robustness for users with varying Internet speeds and bandwidths.
For instance, a prominent platform, Netflix has implemented AI technology aiming to create a superior personalized experience for its subscribed consumers. This AI-empowered system will automatically accomplish several machine learning pipelines that offer shows/movies/program recommendations. The media and entertainment business is witnessing unparalleled disruption. From rapid adoption of connected devices and sensitive expectations from customers to ongoing competition from internet video streaming providers and social media, several powerful forces are shapeshifting the media and entertainment industry landscape.
The integration of AI takes analytics to the next level by applying machine learning algorithms and natural language processing to make sense of vast quantities of data, over 80 percent of which is unstructured. They can help companies leverage building blocks, such as dialog capabilities, visual recognition, sentiment analysis, personality insights, and tone analysis, to help drive competitive benefits. The North America region is projected to dominate the market and offers significant opportunities for industry expansion as substantial investments are being made in AI projects and related R&D activities.
For instance, in June 2020, the developed version of Unreal Engine 4.25, a play station software by Epic Games, Inc., was upgraded and the advanced version was launched. An unreal engine is a VFX software implemented for designing, pre-visualizing, and visual editing effects in a real-time situation. In addition, increasing efforts made by film-making companies, for example, 20th century Fox used IBM’s AI system, Watson, to create a trailer for the horror movie “Morgan”.
AI In Media & Entertainment Market Segmentations:
| By Solution | By Application |
|
Hardware/Equipment Services |
Gaming Fake Story Detection Plagiarism Detection Personalization Production Planning & Management Sales & Marketing Talent Identification Content Capture Sports Automatic Productions |
Chapter 1. Introduction
1.1. Research Objective
1.2. Scope of the Study
1.3. Definition
Chapter 2. Research Methodology
2.1. Research Approach
2.2. Data Sources
2.3. Assumptions & Limitations
Chapter 3. Executive Summary
3.1. Market Snapshot
Chapter 4. Market Variables and Scope
4.1. Introduction
4.2. Market Classification and Scope
4.3. Industry Value Chain Analysis
4.3.1. Raw Material Procurement Analysis
4.3.2. Sales and Distribution Channel Analysis
4.3.3. Downstream Buyer Analysis
Chapter 5. COVID 19 Impact on AI In Media & Entertainment Market
5.1. COVID-19 Landscape: AI In Media & Entertainment Industry Impact
5.2. COVID 19 - Impact Assessment for the Industry
5.3. COVID 19 Impact: Global Major Government Policy
5.4. Market Trends and Opportunities in the COVID-19 Landscape
Chapter 6. Market Dynamics Analysis and Trends
6.1. Market Dynamics
6.1.1. Market Drivers
6.1.2. Market Restraints
6.1.3. Market Opportunities
6.2. Porter’s Five Forces Analysis
6.2.1. Bargaining power of suppliers
6.2.2. Bargaining power of buyers
6.2.3. Threat of substitute
6.2.4. Threat of new entrants
6.2.5. Degree of competition
Chapter 7. Competitive Landscape
7.1.1. Company Market Share/Positioning Analysis
7.1.2. Key Strategies Adopted by Players
7.1.3. Vendor Landscape
7.1.3.1. List of Suppliers
7.1.3.2. List of Buyers
Chapter 8. Global AI In Media & Entertainment Market, By Solution
8.1. AI In Media & Entertainment Market, by Solution, 2023-2032
8.1.1. Hardware/Equipment
8.1.1.1. Market Revenue and Forecast (2020-2032)
8.1.2. Services
8.1.2.1. Market Revenue and Forecast (2020-2032)
Chapter 9. Global AI In Media & Entertainment Market, By Application
9.1. AI In Media & Entertainment Market, by Application, 2023-2032
9.1.1. Gaming
9.1.1.1. Market Revenue and Forecast (2020-2032)
9.1.2. Fake Story Detection
9.1.2.1. Market Revenue and Forecast (2020-2032)
9.1.3. Plagiarism Detection
9.1.3.1. Market Revenue and Forecast (2020-2032)
9.1.4. Personalization
9.1.4.1. Market Revenue and Forecast (2020-2032)
9.1.5. Production Planning & Management
9.1.5.1. Market Revenue and Forecast (2020-2032)
9.1.6. Sales & Marketing
9.1.6.1. Market Revenue and Forecast (2020-2032)
9.1.7. Talent Identification
9.1.7.1. Market Revenue and Forecast (2020-2032)
9.1.8. Content Capture
9.1.8.1. Market Revenue and Forecast (2020-2032)
9.1.9. Sports Automatic Productions
9.1.9.1. Market Revenue and Forecast (2020-2032)
Chapter 10. Global AI In Media & Entertainment Market, Regional Estimates and Trend Forecast
10.1. North America
10.1.1. Market Revenue and Forecast, by Solution (2020-2032)
10.1.2. Market Revenue and Forecast, by Application (2020-2032)
10.1.3. U.S.
10.1.3.1. Market Revenue and Forecast, by Solution (2020-2032)
10.1.3.2. Market Revenue and Forecast, by Application (2020-2032)
10.1.4. Rest of North America
10.1.4.1. Market Revenue and Forecast, by Solution (2020-2032)
10.1.4.2. Market Revenue and Forecast, by Application (2020-2032)
10.2. Europe
10.2.1. Market Revenue and Forecast, by Solution (2020-2032)
10.2.2. Market Revenue and Forecast, by Application (2020-2032)
10.2.3. UK
10.2.3.1. Market Revenue and Forecast, by Solution (2020-2032)
10.2.3.2. Market Revenue and Forecast, by Application (2020-2032)
10.2.4. Germany
10.2.4.1. Market Revenue and Forecast, by Solution (2020-2032)
10.2.4.2. Market Revenue and Forecast, by Application (2020-2032)
10.2.5. France
10.2.5.1. Market Revenue and Forecast, by Solution (2020-2032)
10.2.5.2. Market Revenue and Forecast, by Application (2020-2032)
10.2.6. Rest of Europe
10.2.6.1. Market Revenue and Forecast, by Solution (2020-2032)
10.2.6.2. Market Revenue and Forecast, by Application (2020-2032)
10.3. APAC
10.3.1. Market Revenue and Forecast, by Solution (2020-2032)
10.3.2. Market Revenue and Forecast, by Application (2020-2032)
10.3.3. India
10.3.3.1. Market Revenue and Forecast, by Solution (2020-2032)
10.3.3.2. Market Revenue and Forecast, by Application (2020-2032)
10.3.4. China
10.3.4.1. Market Revenue and Forecast, by Solution (2020-2032)
10.3.4.2. Market Revenue and Forecast, by Application (2020-2032)
10.3.5. Japan
10.3.5.1. Market Revenue and Forecast, by Solution (2020-2032)
10.3.5.2. Market Revenue and Forecast, by Application (2020-2032)
10.3.6. Rest of APAC
10.3.6.1. Market Revenue and Forecast, by Solution (2020-2032)
10.3.6.2. Market Revenue and Forecast, by Application (2020-2032)
10.4. MEA
10.4.1. Market Revenue and Forecast, by Solution (2020-2032)
10.4.2. Market Revenue and Forecast, by Application (2020-2032)
10.4.3. GCC
10.4.3.1. Market Revenue and Forecast, by Solution (2020-2032)
10.4.3.2. Market Revenue and Forecast, by Application (2020-2032)
10.4.4. North Africa
10.4.4.1. Market Revenue and Forecast, by Solution (2020-2032)
10.4.4.2. Market Revenue and Forecast, by Application (2020-2032)
10.4.5. South Africa
10.4.5.1. Market Revenue and Forecast, by Solution (2020-2032)
10.4.5.2. Market Revenue and Forecast, by Application (2020-2032)
10.4.6. Rest of MEA
10.4.6.1. Market Revenue and Forecast, by Solution (2020-2032)
10.4.6.2. Market Revenue and Forecast, by Application (2020-2032)
10.5. Latin America
10.5.1. Market Revenue and Forecast, by Solution (2020-2032)
10.5.2. Market Revenue and Forecast, by Application (2020-2032)
10.5.3. Brazil
10.5.3.1. Market Revenue and Forecast, by Solution (2020-2032)
10.5.3.2. Market Revenue and Forecast, by Application (2020-2032)
10.5.4. Rest of LATAM
10.5.4.1. Market Revenue and Forecast, by Solution (2020-2032)
10.5.4.2. Market Revenue and Forecast, by Application (2020-2032)
Chapter 11. Company Profiles
11.1. Amazon Web Services, Inc.
11.1.1. Company Overview
11.1.2. Product Offerings
11.1.3. Financial Performance
11.1.4. Recent Initiatives
11.2. Gearhouse South Africa PTY Ltd.
11.2.1. Company Overview
11.2.2. Product Offerings
11.2.3. Financial Performance
11.2.4. Recent Initiatives
11.3. Gravity Media
11.3.1. Company Overview
11.3.2. Product Offerings
11.3.3. Financial Performance
11.3.4. Recent Initiatives
11.4. GrayMeta
11.4.1. Company Overview
11.4.2. Product Offerings
11.4.3. Financial Performance
11.4.4. LTE Scientific
11.5. International Business Machines Corp.
11.5.1. Company Overview
11.5.2. Product Offerings
11.5.3. Financial Performance
11.5.4. Recent Initiatives
11.6. LMG, LLC
11.6.1. Company Overview
11.6.2. Product Offerings
11.6.3. Financial Performance
11.6.4. Recent Initiatives
11.7. Matchroom Sport Ltd.
11.7.1. Company Overview
11.7.2. Product Offerings
11.7.3. Financial Performance
11.7.4. Recent Initiatives
11.8. Production Resource Group, L.L.C.
11.8.1. Company Overview
11.8.2. Product Offerings
11.8.3. Financial Performance
11.8.4. Recent Initiatives
11.9. Synthesia Ltd
11.9.1. Company Overview
11.9.2. Product Offerings
11.9.3. Financial Performance
11.9.4. Recent Initiatives
11.10. TAIT
11.10.1. Company Overview
11.10.2. Product Offerings
11.10.3. Financial Performance
11.10.4. Recent Initiatives
Chapter 12. Research Methodology
12.1. Primary Research
12.2. Secondary Research
12.3. Assumptions
Chapter 13. Appendix
13.1. About Us
13.2. Glossary of Terms
 Cross-segment Market Size and Analysis for
Mentioned Segments
Additional Company Profiles (Upto 5 With No Cost)
Additional Countries (Apart From Mentioned Countries)
Country/Region-specific Report
Go To Market Strategy
Region Specific Market DynamicsRegion Level Market Share Import Export AnalysisProduction AnalysisOthers
Cross-segment Market Size and Analysis for
Mentioned Segments
Additional Company Profiles (Upto 5 With No Cost)
Additional Countries (Apart From Mentioned Countries)
Country/Region-specific Report
Go To Market Strategy
Region Specific Market DynamicsRegion Level Market Share Import Export AnalysisProduction AnalysisOthers